ISO far-infrared observations of rich galaxy clusters††thanks: Based on observations with ISO, an ESA project with instruments founded by ESA member states (especially the PI countries: France, Germany, the Netherlands, and the United Kingdom) and with the participation of ISAS and NASA
Abstract
In a series of papers we investigate far-infrared emission from rich galaxy clusters. Maps have been obtained by ISO at , , , and using the PHT-C camera. Ground based imaging and spectroscopy were also acquired. Here we present the results for the cooling flow cluster Sérsic 159-03. An infrared source coincident with the dominant cD galaxy is found. Some off-center sources are also present, but without any obvious counterparts.
Key Words.:
galaxies: clusters: individual: Sérsic 159-03 – infrared: galaxies1 Introduction
The first paper in this series (Hansen et al. han99 (1999), paper i) presented infrared data for the Abell 2670 cluster. We identified 3 far-infrared sources apparently related to star forming galaxies in the cluster. The present paper concerns the rich cluster Sérsic 159-03. The central part of the Sérsic 159-03 cluster was mapped by the Infrared Space Observatory (ISO) satellite, using the PHT-C camera (Lemke et al. lem96 (1996)) at , , , and . The observations were performed twice with slightly different position angles which gives an opportunity to do independent detections and to study possible instrumental effects.
The Sérsic 159-03 cluster (Abell S1101, z=0.0564) is of richness class 0, Bautz-Morgan type iii with a central dominant cD galaxy (Abell et al. abe89 (1989)). A cooling flow is present, and Allen and Fabian (all97 (1997)) found a mass deposition rate of from ROSAT PSPC data. The cooling flow is centered on the cD galaxy which exhibits nebular line emission. Crawford and Fabian (cra92 (1992)) obtained optical spectra and found from line-ratio diagrams that the ratios obtained along the slit bridged the gap between class i and class ii in the scheme of Heckman et al. (hec89 (1989)). Their spectra had position angle . West of the center they discovered a detached filament of emission having extreme class ii characteristics. They argued that the different line ratios are due to changes in ionization properties. Below in Fig. 4 we show the extent of the nebular emission. In a subsequent paper Crawford and Fabian (cra93 (1993)) included IUE data to obtain the optical-ultraviolet continuum. They announced that a strong Ly line is present in the IUE spectrum.
2 Observations
2.1 The ISO data
A rectangular area centered on the cD galaxy of Sérsic 159-03 was mapped by ISO May 7, 1996 on revolution 173. The projected Z-axis of the spacecraft had a position angle of on the sky (measured from north through east). The observation was repeated June 4, 1996, during revolution 200, but this time with position angle . The observing mode was PHT 32 as for Abell 2670 (paper i). The 9 pixel C100 detector was used for and to map an area of . For and the 4 pixel C200 detector was applied to cover a mapped area of . The target dedicated times were 1467 seconds for C100 and 1852 seconds for C200.
| Grism | P.A. | exp. | slit | range | |
|---|---|---|---|---|---|
| min. | arcsec | Å | Å | ||
| #8 | 40 | 1.5 | 4 | 5900-8300 | |
| #8 | 40 | 1.5 | 4 | 5900-8300 | |
| #10 | 45 | 1.5 | 24 | 3500-8800 | |
| #10 | 30 | 1.5 | 24 | 3500-8800 |
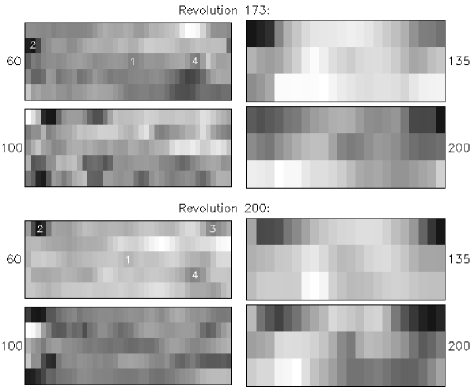
As described in paper i we apply the ISOPHOT Interactive Analysis software111The ISOPHOT data presented in this paper was reduced using PIA, which is a joint development by the ESA Astrophysics Division and the ISOPHOT consortium. (PIA) for the reduction work. We also perform parallel reductions using our own least squares reduction procedure (LSQ, cf. paper i). Although LSQ does not use sophisticated methods to correct for various effects – e.g. glitches from cosmic rays are simply discarded – we find it valuable for comparisons with the PIA reductions when evaluating the reality of features visible in the frames. The conclusion is that the PIA reduced images presented here (Fig. 1) do not contain noticeable artifacts from glitches. As in paper i we present the data maps with pixel sizes for C100 and for C200, but the instrumental resolution is only about for C100 and for C200 (paper i). The uncertainty of the maps increases towards the left and right borders due to the way the mapping was performed.
2.2 Optical data
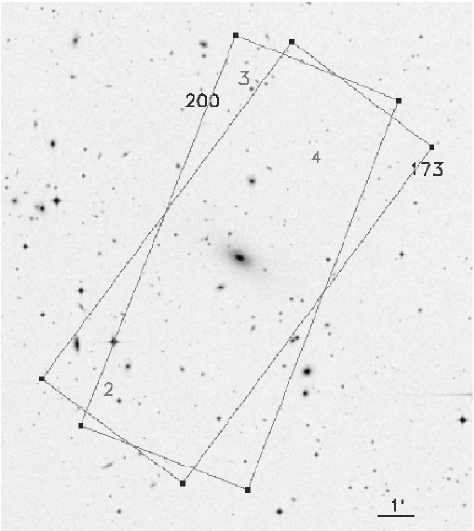
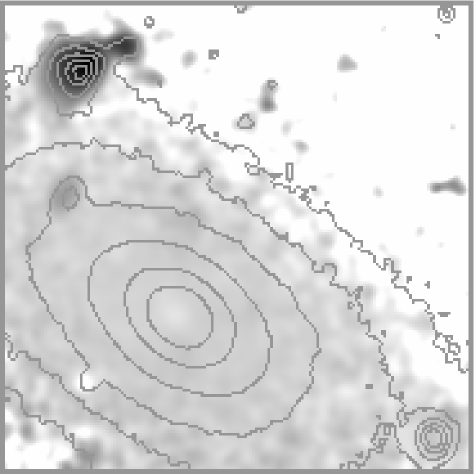
Optical imaging and spectroscopy were performed September 1996 using the DFOSC instrument on the Danish 1.54m telescope at La Silla. The field around the central cD galaxy is shown in Fig. 2. The image was obtained by adding exposures in B (45 min), V (30 min), and Gunn I (30 min). The distribution of B-I colour for a area covering the central parts of the dominant cD galaxy is given in Fig. 3.
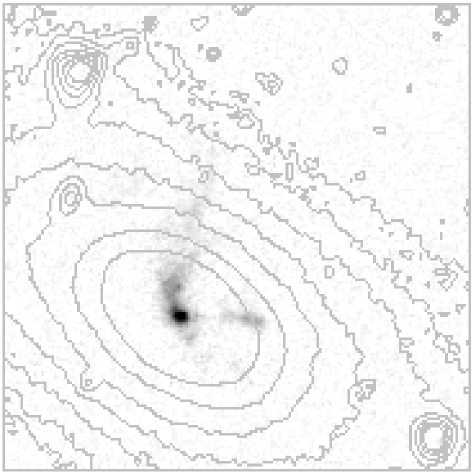
In order to image the distribution of the nebular emission we obtained narrow band exposures through a filter (, FWHM = 98 Å, 1 hour) covering the redshifted H+[N ii] lines and an off-band filter (, FWHM = 98 Å, 1 hour). After scaling and subtraction a H+[N ii] image is obtained. The central part of this image is shown in Fig. 4.
3 Results
The general brightness distribution in the maps is described most easily for the C200 maps. The and maps are rather similar. An enhancement is seen at the center in all four maps concordant with the position of the cD. A maximum is present in the upper left corners. After rotating the revolution 200 maps into coincidence with the rev. 173 maps we find these maxima to overlap suggesting the presence of one or more real sources. Similarly there are maxima in the upper right corners. Their positions and relative brightness in the maps can be understood if a source is present in the upper right corner of the rev. 200 maps, but just outside the rev. 173 field. A third characteristic feature is the brightness minimum to the lower left (i.e. south) of the center of the C200 maps. Again, when we compare the maps after rotation the reality of this minimum is confirmed. We conclude that the brightness distribution seen in the C200 maps is real.
The C100 maps have the advantage of better resolution which improves the possibility of identifying optical counterparts. However, the reality of the peaks in the maps is not convincing when the maps are compared after rotation. Generally the peaks occur at different locations. Even the central source is doubtful: The rev. 200 map shows a weak enhancement slightly displaced to the right of the center, but the rev. 173 map shows a minimum at the same location.
A comparison between the maps is more successful. Both show a central enhancement (C100-1) although slightly displaced to the right (north) in the rev. 173 map. The maximum brightness (object C100-2) occurs in both maps near the upper left corners and overlap after rotation. In Fig. 2 the approximate positions of overlap is marked by numbers for the off-center sources. The rev. 200 map has a peak (C100-3) in the upper right corner which may be related to the source present in the C200 maps. Furthermore, the peak (C100-4) in the right part of the rev. 200 map overlaps with an enhancement in the rev. 173 map. There are disagreements as well, however. The peak obvious in the rev. 173 map below C100-4 (confirmed by the LSQ reductions) is not visible in the rev. 200 map. We conclude that the sources C100-1, C100-2, C100-3, and C100-4 are likely to be real, but that the present reduction software still produces artifacts calling for caution in the interpretation.
In paper i we found that aperture photometry of the faint sources suffers significantly from the uncertainty in the evaluation of the background level. We therefore prefer to position, scale and subtract the PSF from the maps. The success in removing the source is then evaluated by eye. By varying the scaling we estimate the maximum and minimum acceptable flux. The median and its deviation from the limits are given in Table 2 for our identified infrared sources. We assume that the two sources in the upper corners of the C200 maps are identical to C100-2 and C100-3. The reality of C100-1 at may be questionable. C100-3 is outside the field in the rev. 173 map.
| object | rev. | ||||
|---|---|---|---|---|---|
| C100-1 | 173 | ||||
| 200 | |||||
| C100-2 | 173 | ||||
| 200 | |||||
| C100-3 | 173 | ||||
| 200 | |||||
| C100-4 | 173 | ||||
| 200 |
4 Discussion
4.1 The cD galaxy
The central infrared source, C100-1, is detected in all maps except at . The measured fluxes in the two independent observations also agree within the limits. We therefore regard the source as real. A comparison with the list of Jura et al. (jur87 (1987)) shows that the luminosity of Sérsic 159-03 at is larger than other early type galaxies detected by IRAS by an order of magnitude or more, except the extraordinarily bright galaxy NGC 1275 which is the center of the Perseus cluster cooling flow, and which is undergoing an encounter with an other galaxy (e.g. Nørgaard-Nielsen et al., noe93 (1993)).
In a previous paper (Hansen et al. han95 (1995)) we presented a model for the infrared emission from Hydra A measured by IRAS. We assumed that most of the mass cooling out of the cluster gas ends up in low mass stars forming in the flow. We further assumed that dust grains were able to grow in the cool pre-stellar clouds converting a fraction of the mass into grains. If the mechanism is effective we expect %. After a star has formed the remaining material is dispersed in the hot cluster gas. If a fraction is recycled to the hot phase a dust mass of is continuously injected into the cluster gas. At forehand we expect to be approximately %. The grains are destroyed by sputtering on a time scale , and a steady state is obtained. At any time a dust mass of is present. The grains are heated by hot electrons (in the inner galaxy the photon field may also be important), and the infrared emission can be evaluated. The present data do not allow testing of more elaborate models having radial distributions of e.g. the dust temperature. We therefore only make a simple estimate using mean values.
For Hydra A we found that and reproduced the observed IRAS flux. In Table 3 giving calculated fluxes we repeat the calculations for Sérsic 159-03, but with reduced to 2%. Considering the crude model and the uncertainty of the measurements we find the agreement with the observed values in Table 2 satisfactory. This result has some significance although has been used as a free parameter to obtain concordance. If a value of much larger than unity had been necessary to fit the observations the model would have had to be rejected. Also, a value significantly lower than 1% would have made the model unconvincing.
| keV | arcmin | Jy | Jy | Jy | Jy | K | ||
| 231 | 2.9 | 1.89 | 0.05 | 0.07 | 0.06 | 0.03 | 40 |
A possible disagreement with the model is, however, the small extent of the source. One would expect the infrared emission to show some distribution within the cooling radius which is . Although the resolution at is C100-1 is indistinguishable from a point source in all our measurements. The reason could be that (1) the star formation is concentrated to the center (as seems to be the case for Hydra A, see Hansen et al. han95 (1995)), (2) the model does not apply, or (3) instrumental effects prevents detection of a faint, extended distribution of FIR emission.
Alternative possibilities are that C100-1 is related to the active nucleus as inferred by the presence of a radio source (Large et al. lar81 (1981), Wright et al. wri94 (1994)), or that dust has been introduced into the system by a recent merger event. A hint may be that all three measurable images of the revolution 173 maps show a tendency to be displaced from the center by to the north where nebular line emission is seen (Fig. 4). The cD galaxy shows no signs of dust lanes, but exhibits a constant distribution in colour (Fig. 3). There are, however, two objects in the upper left part of Fig. 3 which are bluer than the cD. The brightest and bluest of these looks disturbed possibly due to tidal interaction. The spectra taken with P.A. = cover the object and contain emission lines. The emission is weak in Fig. 4 because the lines are shifted away from the peak transmission of the filter. Relative to the cD we find the velocity of the object to be . The galaxy may have plumped through the cD and contains young stars.
The origin of the optical filaments in Fig. 4 is a puzzle. It may be captured material from mergers, related to radio plasma, or connected to the cooling flow. The relative velocities do not support any particular model. The velocities have been measured from our spectra, and they are quite low as seen from Table 4.
emission of the cD galaxy (z = 0.0568)
| filament | rel. vel. | |
|---|---|---|
| P.A. north | ||
| P.A. south | – | |
| P.A. west | – |
Donahue and Voit (don93 (1993)) obtained spectra of the nuclear emission from the Sérsic 159-03 cD galaxy. They argued that the lack of [Ca ii] emission indicates that Ca is depleted onto dust grains. We have added all our spectra of the center together and all of the filaments. No [Ca ii] emission was visible in any of the two resulting spectra. We then shifted the [N ii] to the expected position of [Ca ii] and added the shifted line after scaling with various constants. In this way we find that no [Ca ii] emission stronger than 0.20 times [N ii] is present. Figure 1 of Donahue and Voit (don93 (1993)) predicts (from ionization calculations) that this ratio should never be smaller than 0.24. Although marginal compared to the case of Hydra A the discrepancy can be explained by the condensation of Ca onto grains in accord with Donahue and Voit’s result.
The presence of dust in the nebular gas does not necessarily exclude that it originates from the cooling cluster gas. Dust may grow in dense, cool clouds in connection with star formation. For the nebular gas in Hydra A Donahue and Voit (don93 (1993)) found a much tighter limit on the [Ca ii] line strongly suggesting the presence of dust. In Hydra A the nebular gas is concentrated to a central disk-like structure of several kpc where vigorous star formation has taken place, and Hansen et al. (han95 (1995)) argue that it is a result of the cooling flow (see also McNamara, mcn95 (1995)). In Sérsic 159-03 the extended nature of the filaments and the presence of the blue, star forming object is more in favour of a merger scenario, however.
4.2 Off-center infrared sources
There are no striking optical identifications to the off-center sources. The position of C100-2 is relatively well determined by the overlap of the two observations. The nearest object visible in Fig. 2 is to the south-west, is unresolved and of blue colour. It is not a known QSO (no QSO is closer than in the NASA/IPAC Extragalactic Database222The NASA/IPAC Extragalactic Database (NED) is operated by the Jet Propulsion Laboratory, California Institute of Technology, under contract with the National Aeronautics and Space Administration ), and it is just outside the overlap of the two observations. There are several faint optical objects in the area of C100-3, but no show up in our data with characteristics favouring a candidateship. The difficulties in pointing out candidates are even more pronounced for C100-4 which agrees poorly with the nearest faint objects in Fig. 2. However, C100-4 is also the most uncertain of the sources as it is only visible at .
5 Conclusion
The availability of two observations covering essentially the same field at several wavelengths allows us to identify 4 faint ( Jy) far-infrared sources with some confidence. A central source, C100-1, is attributed to the cD galaxy which contains optical filaments, but our optical images do not reveal significant evidence of dust lanes. The fluxes measured for C100-1 are of the same order of magnitude as expected from dust related to star formation in the cooling flow. For the non-central sources we cannot point out any particular optical candidates in contrast to the results from the Abell 2670 field (paper i) where galaxies with enhanced star formation were found coincident with the infrared sources.
Acknowledgements.
This work has been supported by The Danish Board for Astronomical Research.References
- (1) Abell G.O., Corwin H.G., Olowin R.P., 1989, ApJS 70, 1
- (2) Allen S.W., Fabian A.C., 1997, MNRAS 286, 583
- (3) Crawford C.S., Fabian A.C., 1992, MNRAS 259, 265
- (4) Crawford C.S., Fabian A.C., 1993, MNRAS 265, 431
- (5) Donahue M., Voit G.M., 1993, ApJ 414, L17
- (6) Hansen L., Jørgensen H.E., Nørgaard-Nielsen H.U., 1995, A&A 297, 13
- (7) Hansen L., Jørgensen H.E., Nørgaard-Nielsen H.U., Pedersen K., Goudfrooij P., Linden-Vørnle M.J.D., 1999, A&A 349, 406 (paper i)
- (8) Heckman T.M., Baum S.A., van Breugel W.J.M., McCarthy P., 1989, ApJ 338, 48
- (9) Jura M., Kim D.W., Knapp G.R., Guhathakurta P., 1987, ApJ 312, L11
- (10) Large M.I., Mills B.Y., Little A.G., Crawford D.F., Sutton J.M., 1981, MNRAS 194, 693
- (11) Lemke D. et al., 1996, A&A 315, L64
- (12) McNamara B.R., 1995, ApJ 443, 77
- (13) Nørgaard-Nielsen H.U., Goudfrooij P., Jørgensen H.E., Hansen L., 1993, A&A 279, 61
- (14) Wright A.E., Griffith M.R., Burke B.F., Ekers R.D., 1994, ApJS 91, 111