HV Ursae Majoris, a new contact binary with early-type components ††thanks: Based on the data obtained at the David Dunlap Observatory, University of Toronto
Abstract
We present the first and photometric observations for the short period variable star HV Ursae Majoris classified as a field RRc variable. The observed differences between the consecutive minima and the lack of colour variations disagree with the RRc-classification and suggest the possible binary nature of HV UMa. In order to reveal the real physical status of this star, we took medium resolution () spectra in the red spectral region centered at 6600 Å. Spectra obtained around the assumed quadratures clearly showed the presence of the secondary component.
An improved ephemeris calculated using our and Hipparcos epoch photometry is Hel. JD, P. A radial velocity curve was determined by modelling the cores of H profiles with two Gaussian components. This approximative approach gave a spectroscopic mass ratio of qsp=0.190.03. A modified Lucy model containing a temperature excess of the secondary was fitted to the V light curve. The obtained set of physical parameters together with the parallax measurement indicate that this binary lies far from the galactic plane, and the primary component is an evolved object, probably a subgiant or giant star. The large temperature excess of the secondary may suggest a poor thermal contact between the components due to a relatively recent formation of this contact system.
Key Words.:
stars: binaries: eclipsing – stars: fundamental parameters – stars: individual: HV UMa1 Introduction
The first note on the possible light variability of HV Ursae Majoris (= HD 103576 = HIP 58157, , , , mas, pc) was published by Penston (1973) who gave an ’uncertain’ mark to the range of V-magnitude (“var? V=8.60–8.83”). The periodic nature of the light variation was discovered by the Hipparcos satellite (ESA 1997) and the star was classified as an RRc variable. There is a note in ESA (1997) about the possibility of a double period but no firm conclusion was drawn. ESA (1997) gives a spectral type A3, while Slettebak & Stock (1959) published A7.
We started a long-term observational project of Strömgren photometry and spectroscopy of the newly discovered bright Hipparcos variables. The first results have already appeared in Kiss et al. (1999a, b). Since the period, spectral type and light curve do not exclude the possibility of wrong classification, accurate determination of the fundamental physical parameters is highly desirable.
The main aim of this paper is to present the first and photometry for HV UMa. Also, our radial velocity measurements are the first time-resolved spectroscopic observations of this star to date. The paper is organised as follows: the observations are described in Sect. 2, Sect. 3 deals with data analysis and the obtained physical parameters, while a discussion of the results is given in Sect. 4. A final list of conclusions is presented in Sect. 5.
2 Observations
2.1 Photometry
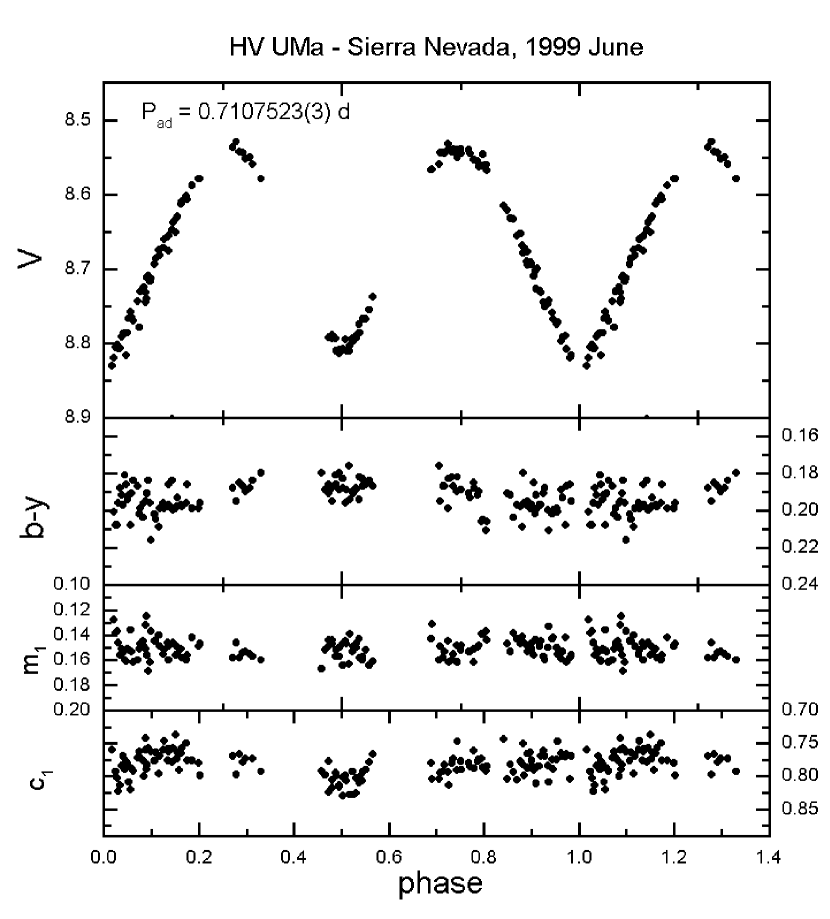
The Strömgren photometric observations were carried out on 9 nights in June, 1999, using the 0.9 m telescope at Sierra Nevada Observatory (Spain) equipped with a six-channel (uvby+) spectrograph photometer (Nielsen 1983). Earlier, measurements were obtained on one single night in March, 1999, using the 0.4 m Cassegrain-type telescope of Szeged Observatory equipped with a single-channel Optec SSP-5A photometer. These observations covered only 5 hours and revealed a 0.2 mag variation between two consecutive minima. We carried out differential photometry with respect to HD 103150 (=8.45, =0.54, =0.335, =0.149, =0.381 mag). The overall accuracy of the standard transformation is about mag for , and and mag for . The light and colour curves were phased using the corrected ephemeris (see below) and are plotted in Fig. 1.
| Julian Date | type |
|---|---|
| 2451263 | |
| 2451309 | spectr. |
| 2451310 | spectr. |
| 2451340 | |
| 2451341 | |
| 2451342 | |
| 2451343 | |
| 2451345 | |
| 2451346 | |
| 2451347 | |
| 2451349 | |
| 2451350 |
2.2 Spectroscopy
The spectroscopic observations were carried out at David Dunlap Observatory with the Cassegrain spectrograph attached to the 74” telescope on two nights in May, 1999. The detector and the spectrograph setup were the same as used by Vinkó et al. (1998). The resolving power () was 11,000 and the signal-to-noise ratio reached 30–50, depending on the weather conditions. The spectra were centered on 6600 Å and reduced with standard IRAF tasks, including bias removal, flat-fielding, cosmic ray elimination, aperture extraction (with the task ) and wavelength calibration. For the latter, two FeAr spectral lamp exposures were used, which were obtained before and after every three stellar exposures. The sequence of observations FeAr-var-var-var-FeAr was chosen because of the short period of HV UMa. Careful linear interpolation between the two comparison spectra was applied in order to take into account the sub-pixel shifts of the three stellar spectra caused by the movement of the telescope. We chose an exposure time of 10 minutes, which corresponds to 0.01 in binary orbital phase, avoiding phase smearing of the radial velocity curve. The spectra were normalized to the continuum by fitting a cubic spline, omitting the region of H.
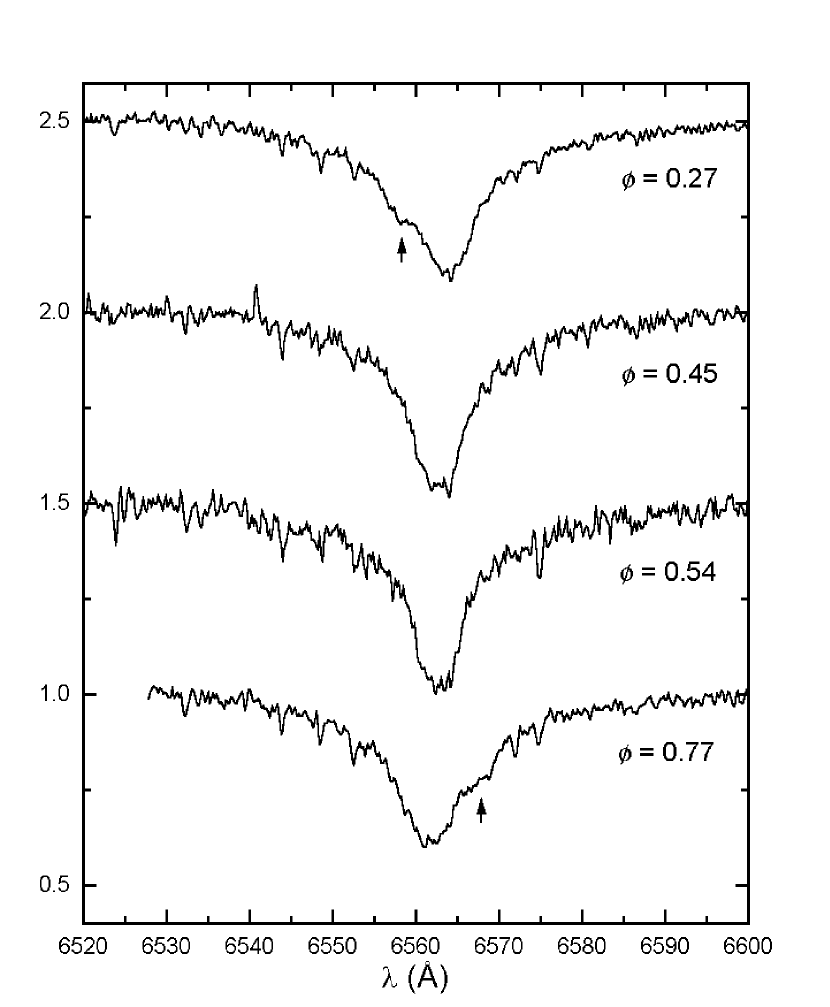
Besides a few telluric features, only the H line could be detected with acceptable S/N ratio in our 200 Å-wide spectra. At the phases of maximum light the line exhibited significant broadening and an excess bump appeared on the wings alternating between the blue and the red side (see Fig. 2). It can be interpreted most easily as the effect of a close companion star, therefore HV UMa is most probably a spectroscopic binary. Fig. 2 shows a few sample spectra with the calculated orbital phase indicated on the right side of every spectrum.
3 Physical parameters
3.1 Epoch and period
The Hipparcos data suggested that the light variation of HV UMa can be described with a single period of (ESA 1997). We observed only one moment of minimum (Hel. JD = 2451346.388), but the consecutive minimum appeared to be slightly fainter, therefore, we adopted a doubled Hipparcos period as a first approach () and shifted the observed time of minimum with to obtain the final epoch Hel. JD.
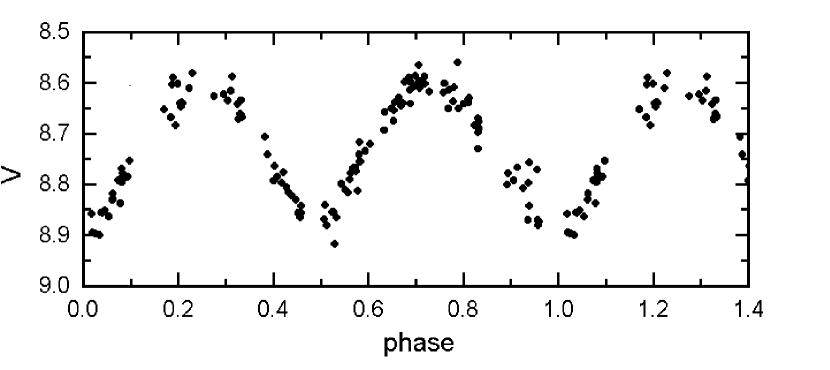
The next step was to refine the period. This was done by phasing Hipparcos epoch photometry with the newly determined epoch and the doubled Hipparcos-period. The resulting phase diagram showed a shift of (=). That shift was eliminated by recalculating the period until correct phase diagrams for both our and Hipparcos data (Fig. 3) were reached. The resultant period is . The fact that earlier Hipparcos data agree very well with our data suggests a quite stable period of HV UMa.
3.2 Classification
The shape of the light curve, i.e. the continuous light variation and the very deep secondary minimum (almost as deep as the primary one), the absence of significant colour variation, the appearance of the secondary line in the spectra at the quadrature phases all suggest that HV UMa is probably an eclipsing contact binary. This is confirmed by its low mass ratio and a consistent model of the light curve (see below).
Comparing the light curve phased with the final epoch and period (Fig. 1) with the line profiles observed at phases of maximum light (Fig. 2) it is visible that the secondary line appears on the blue side at the quadrature phase that follows the deeper minimum, while this bump is redshifted at . This indicates that the smaller companion star approaches us after the primary minimum, therefore that minimum is due to an occultation eclipse. The weak point of this analysis is that the light curve is not very well covered around the minima either by the Hipparcos data or our observations. The data obtained at Sierra Nevada have better inner precision (less scatter) than those provided by Hipparcos, and these data indicate that the minimum at is slightly deeper. Therefore, we adopted this eclipse as primary minimum, but this needs further confirmation. If the deeper minimmum is really due to an occultation eclipse then HV UMa is a so-called W-type contact binary.
Contact binaries can contain early (O–B) or late (G–K) spectral type stars. The latter group is referred to as the W UMa stars, while the former is known as early-type contact systems. The colours of HV UMa indicate early F spectral type, therefore HV UMa is an “intermediate” type contact binary between the W UMa stars and the OB-type contact systems. The surface temperature and the line profile of the HV UMa system makes it similar to the known contact systems UZ Leo and CV Cyg (Vinkó et al., 1996).
3.3 Radial velocities and spectroscopic mass ratio
Since the secondary component is only partly resolved, the radial velocities must be determined by modelling the individual line profiles in order to avoid blending effects (e.g. systematic decrease of the velocity amplitude). For this purpose we chose those spectra that were obtained around the quadratures. These show the presence of the secondary most clearly. One spectrum around light minimum was also modelled to test the applied method.
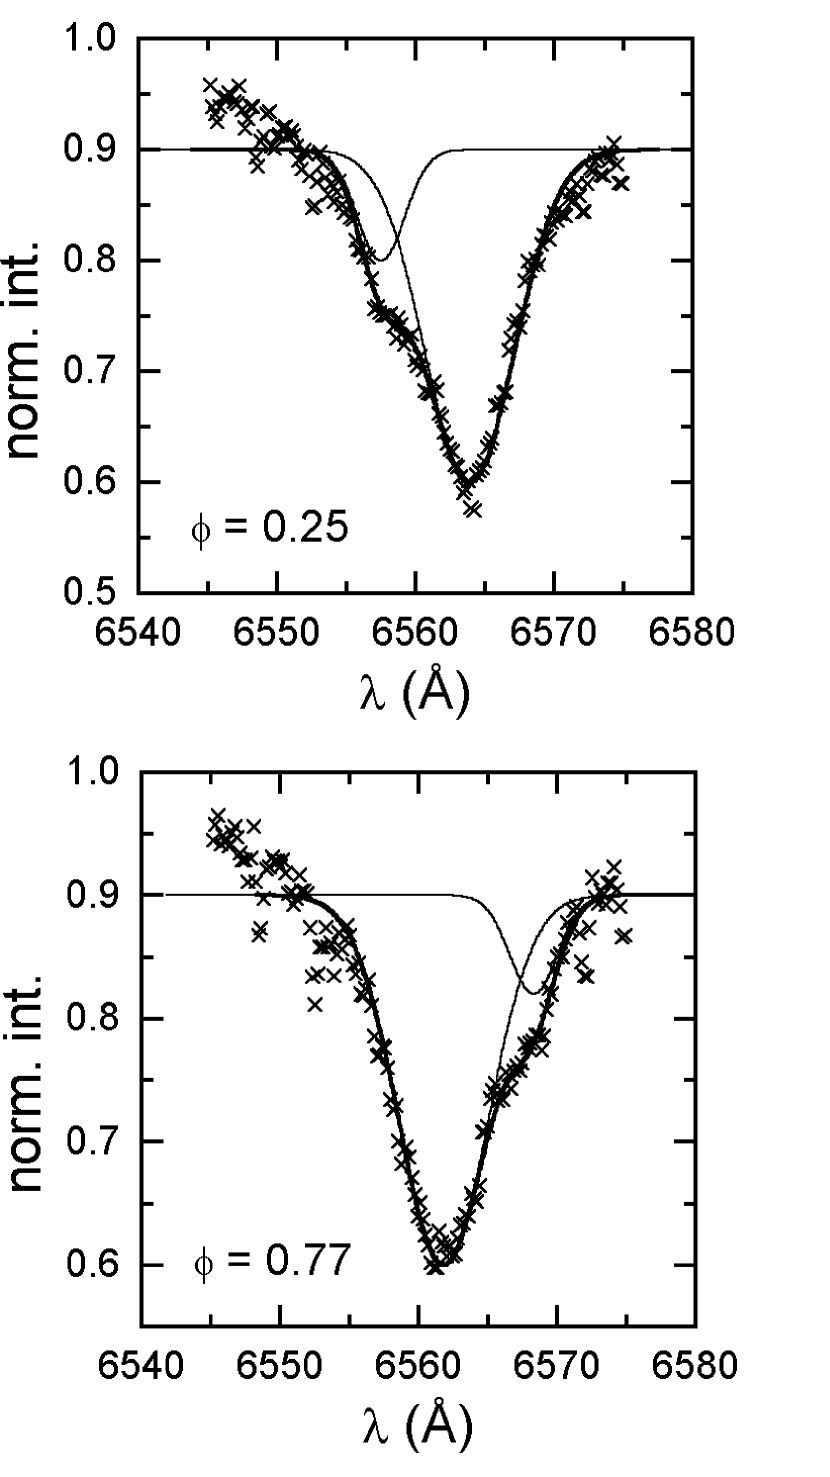
Because the H profile is strongly affected by the Stark broadening and shows wide non-gaussian wings, we normalized the profiles to the surrounding continuum, and selected the lower part of the profiles below the 0.9 intensity value. We fitted two individual Gaussian profiles to the line cores adjusting the amplitudes, FWHM values and line core positions. The initial values of these parameters were estimated from two spectra very close to the quadratures (=0.25 and 0.77). The FWHM converged very quickly to the final values, being 7.6 Å and 4.0 Å for the primary and secondary components, respectively. Line depths changed slightly from spectrum to spectrum, as the contributions are phase-dependent, resulting in 0.29–0.30 for the primary and 0.07–0.10 for the secondary (note, that these values mean line depths below 0.9 normalized intensity). The fitted line core positions resulted in the radial velocity variations for both components. Sample spectra with the fitted profile are shown in Fig. 4, while the radial velocities are presented in Table 2. The estimated accuracy of the individual velocities is about 5 km s-1 for the primary, and 10 km s-1 for the secondary, which is mainly determined by the resolution of the line core in wavelength. The velocity amplitudes resulting from this method are 471.5 km s-1 and 25410 km s-1, where the uncertainties are due to the random errors caused by the observational scatter. The corresponding mass-ratio is .
However, as was also pointed out by the referee, this kind of velocity determination may contain a large amount of systematic error, mainly due to the assumed Gaussian shape of the individual line profiles. The intrinsic H profiles of the components of HV UMa are probably quite different from Gaussian, therefore this approach can be considered as only the first approximation for extracting the radial velocities from the H profiles. The major part of the systematic error is governed by the shape of the wing of the primary component’s model profile on the side where the secondary star appears (blueward at and redward at phases). It is well visible in Fig. 4 that the position of the secondary line is shifted toward larger velocities with respect to the position of the “hump” on the observed profile, due to the increasing contribution of the primary line toward the main minimum of the combined line. If the primary line was steeper on the side where the secondary line exists, overlapping the secondary by a smaller amount, then the secondary line would be less shifted, thus, its position would be closer to the local hump on the observed profile, resulting in a smaller radial velocity of the secondary. On the other hand, a shallower secondary profile would give us systematically higher velocities due to the same reason.
In order to estimate the amount of this kind of systematic error, we simply determined the positions of the two local minima (the main minimum and the secondary’s hump) on the profiles observed around quadratures (four spectra around and two around ) when the presence of the hump appeared to be most prominent. This was done interactively, by eye, plotting the line profiles on the computer screen, which again introduced some subjectivity into the procedure, but it is stressed that this is done only for estimating the errors of the velocities and not for obtaining their actual values. Of course, the velocities of the secondary measured in this way were systematically smaller than those obtained by the Gaussian fitting. The velocities of the primary were almost the same, as could be expected. The total amplitude turned out to be km s-1, while the mass ratio changed to . Comparing these values with the results of the Gaussian fitting, we conclude that the errors of the radial velocity amplitude and the spectroscopic mass ratio (both random and systematic) are approximately km s-1 and , respectively. The finally adopted parameters determined spectroscopically, together with their errors are collected in Table 3. It is important to note that the mass ratio can be refined by modelling the light curve (Sect. 3.4), but the total velocity amplitude is tied only to the spectroscopic data, thus, its uncertainty will directly appear in the absolute parameters of the system.
| Hel. JD | |||
|---|---|---|---|
| 2400000+ | [km/s] | [km/s] | |
| 51309.6206 | 0.77 | 47 | 251 |
| 51309.6396 | 0.80 | 51 | 242 |
| 51309.6471 | 0.81 | 42 | 246 |
| 51310.6411 | 0.21 | 41 | 252 |
| 51310.6485 | 0.22 | 45 | 243 |
| 51310.6562 | 0.23 | 50 | 243 |
| 51310.6643 | 0.24 | 54 | 238 |
| 51310.6719 | 0.25 | 50 | 243 |
| 51310.6794 | 0.26 | 50 | 243 |
| 51310.6893 | 0.27 | 45 | 238 |
| 51310.6964 | 0.28 | 41 | 252 |
| 51310.7037 | 0.29 | 45 | 247 |
| 51310.7436 | 0.35 | 41 | 233 |
| 51310.8423 | 0.49 | 9 | 9 |
3.4 Light curve modelling
The V-light curve was synthesized with the computer code BINSYN described briefly in Vinkó et al. (1996). This code is based on the usual Roche-model characterized by the geometric parameters (photometric mass-ratio), (fill-out) and (orbital inclination). The relative depth of the eclipses were modelled introducing the relative temperature excess of the secondary (hot-secondary model). Because the primary minimum turned out to be due to occultation, the phases were shifted by 0.5 assigning to the transit eclipse (built-in default in BINSYN).
First, the effective temperature of the primary component was estimated based on synthetic colour grids by Kurucz (1993) and the observed mean Strömgren colour indices ( mag, mag, mag), resulting in K and dex (assuming and solar chemical abundance). The interstellar reddening in the direction and distance of HV UMa is expected to be small, because this variable lies far from the galactic plane. TU UMa, an RR Lyr variable lying 17∘ SE from HV UMa also has a negligible colour excess (Liu & Janes, 1989).
Other parameters necessary for modelling the binary star were as follows. A linear limb-darkening law with coefficient was adopted from tables of Al-Naimiy (1977). The gravity darkening exponent and the bolometric albedo were chosen at their usual values for radiative atmospheres: and . All these parameters were kept fixed during the solution for the best light-curve model.
The light-curve fitting was computed using a controlled random search method, the so-called Price algorithm (Barone et al., 1990, Vinkó et al., 1996). The optimized parameters were , , and . The best solution was searched for in the following parameter domains: , , and . The fit quickly converged to low inclination and low mass ratio values that were expected from the shallow eclipses ( mag) and the small spectroscopic mass ratio (). Also, it turned out that there are strong correlations between the optimized parameters. Due to this correlation, the physical parameters determined from the light curve fitting cannot be considered as a unique solution: certain parameter combinations describe the light curve almost equally well. In these cases the combination of photometric and spectroscopic information is very important: one can use the spectroscopic data to determine a consistent set of physical parameters that gives the best model fitting all the available data.
In order to combine the photometric and spectroscopic information and find a consistent description of the system, we modelled the observed H line profiles using the parameters from the light curve fitting. The model line profiles were computed by convolving an intrinsic H profile of a non-rotating star with the Doppler-broadening profile of the contact binary. The broadening profiles were calculated with the WUMA4 code (Rucinski, 1973). For the determination of the intrinsic H profile we used Kurucz’s ATLAS9 code modified by John Lester. This approach, however, has some limitations, because the H line is strongly affected by NLTE-mechanisms, therefore the ATLAS9-model profile will be somewhat different from the real intrinsic profile, especially near the line core. Thus, only a crude comparison between the modelled and observed line profiles was possible, neglecting the differences in the line core.
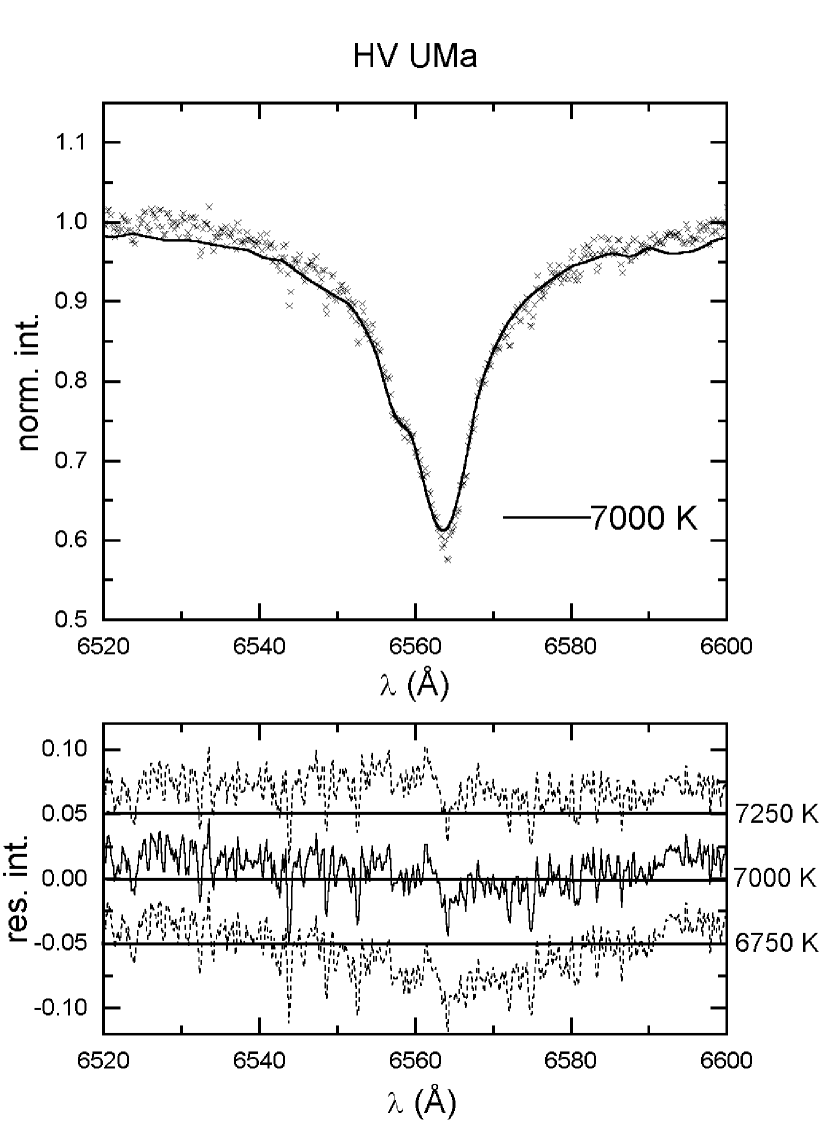
However, it turned out that the originally adopted effective temperature K was too high. With this temperature, the Stark-wings of the H line are so strong that they overwhelm the rotational broadening, producing much wider line profiles than observed. Thus, we reduced the value of the effective temperature until satisfactory agreement was found between the observations and the broadened model profiles. The resulting fit is plotted in Fig. 5 together with the observed line at . The residuals of three model profiles are also shown. It can be seen that at K the wings can be fitted quite well, but the computed line core is too shallow. On the other hand, if K is used, the computed line core agrees better, but the wings are wider. Thus, K was accepted as a compromise. The Strömgren-colours of the Kurucz-grid for this temperature are almost the same as for the originally adopted 7300 K, therefore this temperature is still consistent with the photometric colours.
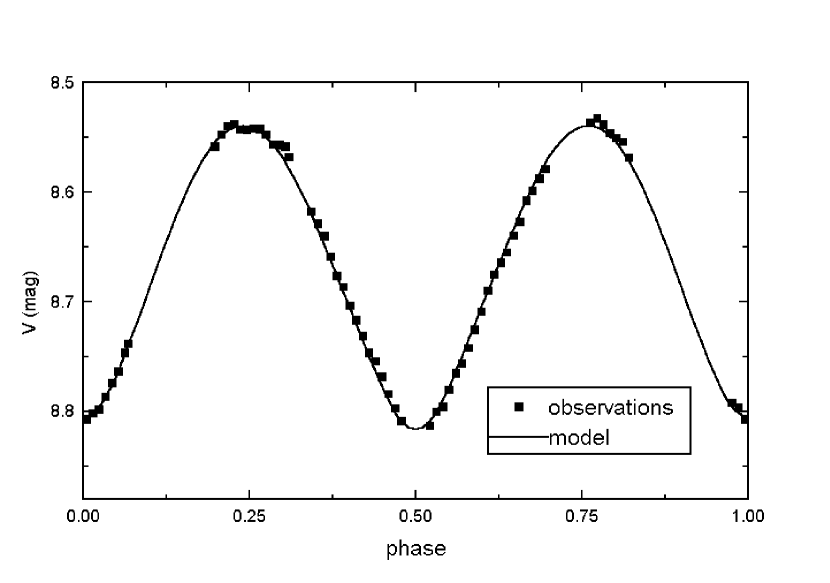
The light curve modelling was recomputed with K. The optimized parameters changed only slightly, resulted in a slightly smaller mass ratio and a slightly higher temperature excess. Table 3 shows the final set of physical parameters, while the fitted light curve is visible in Fig. 6. The distribution of the random points around the -minimum in the parameter space is plotted in Fig. 7. The structure of the sub-spaces in this diagram indicates the correlation between the different parameters.
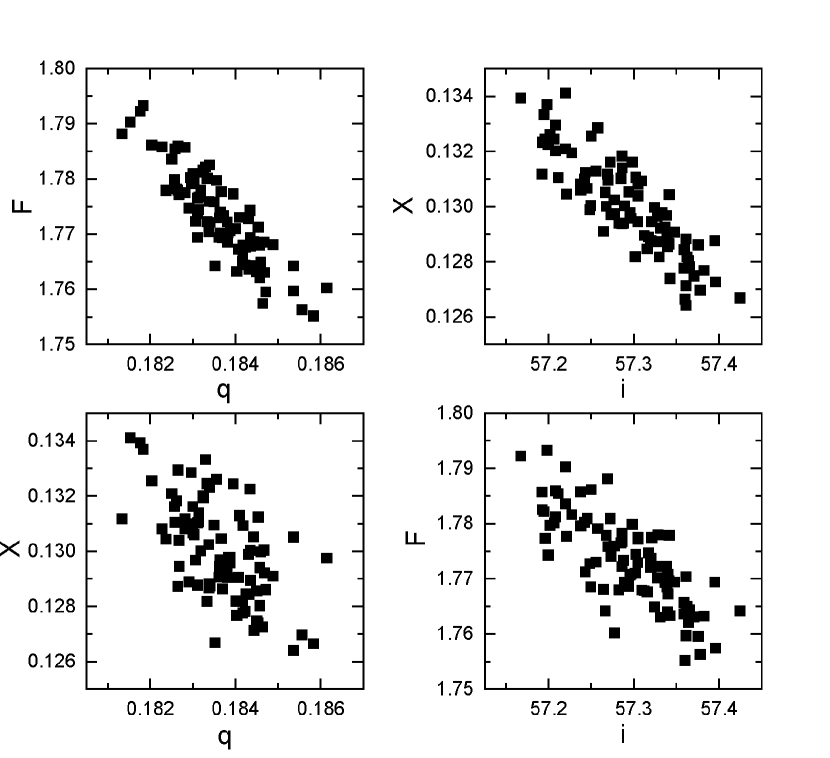
Another light curve model was computed in order to test the effect of the gravity darkening and reflection parameters that were originally fixed as if the atmosphere was radiative. The model with their “convective” values and resulted in an even larger temperature excess than in the radiative case. Because the temperature excess of the secondary is only a “correction” parameter in the light curve solution and it may not mean real temperature difference, it would be difficult to explain physically a very large value of the temperature excess that still does not cause significant colour variation. Thus, we adopted the model with radiative atmospheric parameters as our final solution, and this model is listed in Table 3. Note that the errors of the fitted parameters (3rd column) are difficult to estimate, because of the parameter correlation. We monitored the behaviour of the function during the optimization and assigned uncertainties to each parameter according to the spread of the random points for which . This criterion defines those solutions when the fitted curve runs well within the error bar at each measured normal point, giving a feasible fit to all observations. The parameter correlation means that the uncertainties are also not independent of each other: e.g. slightly decreasing forces increasing or (see Fig.7). The uncertainties of the calculated parameters (3rd panel in Table 3) were estimated assuming a km s-1 error in the radial velocity amplitude .
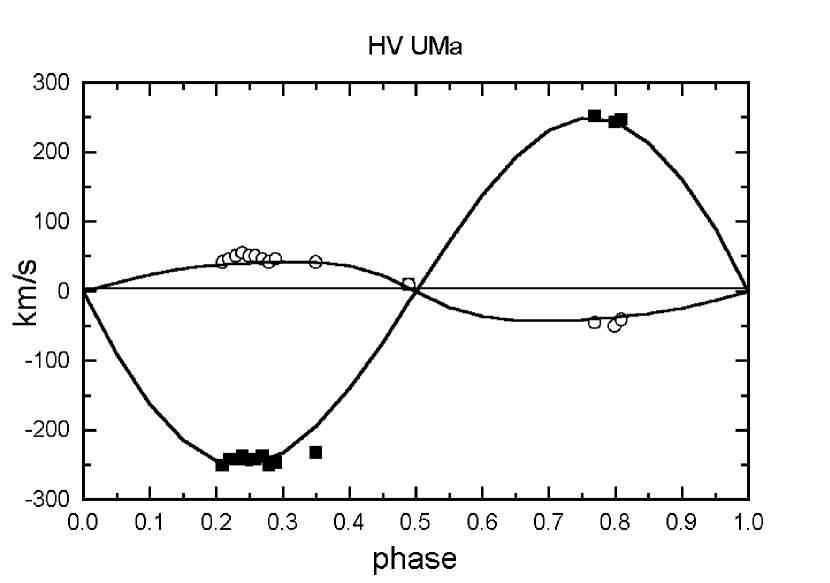
Because of the correlation between the optimized parameters, it is very important to check whether the radial velocities calculated from the model match the observed velocities. This comparison is plotted in Fig. 8 where an almost perfect agreement can be seen. The low mass ratio results in the distortion of the sinusoidal velocity curves, which is a well-known effect in close binaries.
| Fitted parameters | Value | |
|---|---|---|
| spectroscopy | ||
| (km s | 300 | 23 |
| 0.19 | 0.03 | |
| (K) | 7000 | 200 |
| photometry | ||
| 0.184 | 0.05 | |
| 1.77 | 0.15 | |
| 57.3 | 0.4 | |
| 0.13 | 0.03 | |
| Calculated parameters | Value | |
| (106 km) | 3.48 | 0.25 |
| 2.8 | 0.6 | |
| 0.5 | 0.17 | |
| 2.62 | 0.25 | |
| 1.18 | 0.16 | |
| (g cm-3) | 0.2 | 0.05 |
4 Discussion
The spectroscopic detection of the secondary component and the success of modelling the light- and velocity curves as well as the H line profile supports our conclusion that HV UMa is not a short-period RR Lyr variable, but an eclipsing binary system. The physical parameters listed in Table 3 give a deep contact configuration of this binary, explaining naturally the lack of significant colour change during the light variation cycle, which would be peculiar in a pulsating variable. Since the primary minimum is due to occultation, HV UMa is a so-called W-type contact binary (systems exhibiting transit eclipses as primary minima are called A-type).
It is well known that contact binaries can be formed either from hot, early-type stars or cool, late-type stars, the latter representing the class of W UMa-type variables (see e.g. Rucinski, 1993; Figueiredo et al., 1994 for reviews). The surface temperatures of W UMa-systems are usually below 7000 K, while the temperatures of early-type contact binaries show a much wider range, between 10,000 and 40,000 K. Thus, HV UMa falls into the temperature regime between 7000 and 10,000 K that is relatively rarely occupied by contact binaries. Systems like HV UMa may represent a transition population between early-type and late-type contact binaries (although even the existence of such transition is questionable). These systems lie on the boundary between radiative and convective atmospheres, at about late A - early F spectral types. Detailed studies of such systems would be important, because the formation and the structure of early-type systems having radiative envelopes and late-type contact binaries having convective envelopes is probably quite different.
The period value day also indicates that HV UMa is not a typical contact system. Recent statistical studies based on the data from the microlensing survey (Rucinski, 1998 and references therein) have shown that the number of contact systems strongly decreases above day, and there is a well-defined limit at days. Therefore, HV UMa is a member of the relatively rare “longer-period” contact binaries, although a few contact systems with days definitely exist, at least close to the galactic bulge. On the other hand, there exists a period-colour relation of “normal” W UMa-stars with period day, which indicates that longer period systems have bluer colour. On the plot of the empirical relation (Rucinski, 1983) the position of HV UMa, using the mean colour (Fig.1, assuming zero reddening) and our revised period (Sect. 3.1), is close to the upper boundary of the relation, suggesting an atypical, but not peculiar contact system.
A more recent diagram based on Hipparcos-parallaxes has been published by Rucinski (1997, see his Fig.2). The position of HV UMa on this diagram was calculated assuming and , resulting in . These data show that the position of HV UMa is entirely consistent with that of involving the older relation, being close to the blue short-period envelope (BSPE, Rucinski, 1997), but the system is definitely redder than the upper limit defined by the BSPE, consistently with other contact binaries. Also, a rough comparison of HV UMa with other contact binaries on the diagram based on -photometry (Rucinski, 1998) strengthens the status of HV UMa outlined above, again, being closer to the BSPE than other systems with similar period, although the lack of observed colour of HV UMa limits the reliability of this comparison at present. It can be concluded that all available measurements and pieces of information consistently support the contact binary nature of HV UMa.
The new physical parameters collected in Table 3, together with the Hipparcos-parallax ( mas) enable us to estimate the evolutionary status of HV UMa, provided it is indeed a contact binary with those parameters. The coordinates and the distance based on the Hipparcos-parallax indicate that HV UMa is a halo object: its distance from the galactic plane is pc, which means that Fe/H (assumed during the analysis of the line profiles and the colour indices) may not be true. Because the spectroscopic observations presented in this paper have limited spectral range ( Å around 6600 Å), and this region does not contain significant metallic lines in early-type stars, the spectroscopic derivation of Fe/H was not possible. Thus, because of the lack of further information we assumed Fe/H, which is not impossible for halo objects, but Fe/H is also likely.


The referee suggested the possibility that the low metal content of HV UMa critically affects the Stark broadening of the hydrogen lines, thus, significantly influencing the temperature derived from the H profile in Sect. 3.4. We investigated this effect in detail using the pre-computed H profiles by Kurucz (1979) including Stark broadening. In the left panel of Fig. 9 the dependence of the H equivalent width on metallicity is plotted. For each temperature, two model sequences for and 3.5 are shown. It can be seen that the decrease of the metallicity indeed affects the strength of H, but in this temperature range the variation of the equivalent width is governed mainly by the change of the effective temperature. The gravity (pressure) dependence is very weak. Because the equivalent width of the broad H line strongly depends on the strength of the Stark wings, it is expected that the wings of the H profile presented in Fig. 5 (corresponding to A/H) are not affected very largely by the possible lower metallicity of HV UMa, thus, the derived temperature K is only slightly dependent on metal content. This is illustrated in the right panel of Fig. 9, where two model profiles corresponding to two different temperatures ( and K) and A/H i.e. significantly lower metallicity than assumed in the previous section are presented together with the observed line profile at quadrature. It can be seen that the K model still gives a broader line profile than observed, while the K model results in a much better agreement in the wings, very similar to the case of solar metallicity presented in Fig. 5. Note, however, that the lower metal content causes a less deep line core of H, thus, the problem of fitting the whole H line is exaggerated when the effect of metallicity is taken into account. Nevertheless, it is concluded that the km s-1 temperature derived from the wings of H probably does not contain a significant systematic error due to the unknown metallicity of HV UMa.
As was mentioned in Sect. 3.4, the colour excess of HV UMa is . This is supported by the effective temperature derived spectroscopically (discussed above) and photometrically (from observed and tabulated Strömgren indices), because both methods resulted in a consistent value. The negligible reddening is also in agreement with the statement that HV UMa belongs to the halo population.
At first glance, the absolute geometric parameters collected in Table 3 would indicate that the HV UMa system consists of main-sequence components: both stars have and the mass and radius values of the primary are also similar to those of a main sequence star (the secondary is oversized in relation to its mass, typical of contact systems). However, the surface temperatures and luminosities indicate that HV UMa is probably an evolved object. First, the combined absolute magnitude of the system based on parallax measurement and results in mag, where the large error is due to the uncertainty of the Hipparcos-parallax. Using tabulated bolometric corrections, the total luminosity of the system is . Second, the luminosities of the components are and for the primary and secondary, respectively, giving for the combined luminosity, which is within the error of the distance-based total luminosity estimated above. However, both of these luminosities are much less than the expected luminosity of a main sequence star with (Lang, 1991). Moreover, this kind of main sequence star would have K, much higher than the surface temperature of HV UMa. Therefore, the primary component of HV UMa is too cool and too faint for its mass if it is assumed to be a main sequence object.
The agreement with a class III giant star having for is much better. The temperature of such giant star is K which is not very far from the surface temperature of HV UMa. Taking into account the energy transfer between the components in the contact binary (assuming that the total luminosity of the system is due to the energy production of only the more massive primary component), the corrected effective temperature of the primary component is K. The radius and the surface gravity of this giant star, and , also agrees well with the derived parameters of HV UMa. Therefore, the comparison of empirical and theoretical values of the physical parameters suggests that the primary component of HV UMa is an evolved object, probably a IV-III class subgiant, or giant star. Because W UMa stars are generally accepted to belong to the old disk population (e.g. Rucinski, 1993, 1998), it is reasonable that a long-period contact system, containing a more massive primary than most of other W UMa systems, is significantly evolved from the main sequence. Therefore, the evolved status of HV UMa qualitatively agrees with the age of other contact binaries.
It is interesting to compare the direct empirical absolute magnitude of HV UMa derived above ( mag) with the prediction of the period-colour-luminosity relation of W UMa stars calibrated by Rucinski & Duerbeck (1997) as . Using the same estimated index as above, the predicted absolute magnitude for HV UMa becomes mag, which agrees with the empirical value within the errors. Note, that the deviation of some of the calibrating W UMa stars in the sample of Rucinski & Duerbeck (1997) from the value predicted by this relation is as large as mag (see Fig. 4 in Rucinski & Duerbeck 1997), therefore the difference between the observed and the predicted absolute magnitude of HV UMa does not make this system discrepant with respect to other contact binaries. On the other hand, it is a bit surprising that the relation that is mainly based on main sequence objects gave such a good prediction for the more evolved HV UMa system. This agreement is probably limited to the particular range on the HR-diagram close to the position of HV UMa, and may not hold on for more evolved systems with day. Very few known contact systems exist above the day period value, as recently discussed by Rucinski (1998), this lack of systems also gives a natural limit for the applicability of this relation for longer periods.
The separation of the components in the HV UMa system and the evolved physical state of the primary may suggest that this contact system formed during a case B mass transfer. This may also give a reasonable explanation for the poor thermal contact K between the components. Model computations of the formation of contact binaries via evolution induced mass transfer from the more massive component (Sarna & Fedorova, 1989) predict large amount of temperature excess ( K) at the moment of reaching the contact configuration. The result that the eclipse depths of HV UMa can be modelled with only such high temperature excess may indicate that this contact system formed only recently and did not have enough time to reach better thermal contact. Note, that the temperature excess in W UMa-type contact binaries is usually considered unphysical, because the lack of the colour index variation suggests very good thermal contact for late-type stars. The physically consistent model of the eclipse depths of W UMa-stars contains large starspots on the surface of one or both components (e.g. Hendry et al., 1992). However, in the case of HV UMa with K, the presence of such starspots is less likely, thus, the eclipse depths of this system may indeed mean a 900 K temperature difference between the secondary and the primary.
5 Conclusions
The new results presented in this paper can be summarized as follows.
1. We reported the first photometric and medium resolution spectroscopic observations of the short-period variable star HV Ursae Majoris. Contrary to the RRc classification given by ESA (1997), the star turned out to be a new contact binary with early-type components.
2. An improved ephemeris was determined using our and Hipparcos epoch photometric data: Hel.JDmin=2451346.743+0.7107523(3)E. There is no indication of changing period over almost 10 years.
3. A radial velocity curve was measured directly from the H profiles by two-component Gaussian fitting of the line core regions in spectra recorded around the quadratures. We calculated a spectroscopic mass ratio of 0.190.03.
4. The effective temperature and the surface gravity were determined using the mean Strömgren indices, synthetic colours of Kurucz (1993) and theoretical (ATLAS9) line profiles giving K and log . The light curve modelling resulted in a complete set of physical parameters.
5. The physical parameters of HV UMa together with the parallax measurement indicate that this binary is situated far from the galactic plane, and the primary component is an evolved object, probably a subgiant or giant star. The large temperature excess of the secondary may be indicative of a poor thermal contact between the components due to a relatively recent formation of this contact system via case B mass transfer.
Acknowledgements.
This research was supported by MTA-CSIC Joint Project No.15/1998, Hungarian OTKA Grants #F022249, #T022259, #T032258, Pro Renovanda Cultura Hungariae Foundation Grant DT 1999 ápr./36. and Szeged Observatory Foundation. LLK wishes to express his thanks to the staff of the DDO for granting the necessary observing time. Also, LLK and BCS acknowledge the helpful assistance by É. Barát and B. Gere during the observations. Fruitful discussions with K. Szatmáry are also gratefully acknowledged. Thanks are due to the referee, Prof. S. Rucinski, whose criticism and many suggestions led to significant improvement of the paper. The NASA ADS Abstract Service was used to access data and references.References
- (1) Al-Naimiy H.M. 1977, Ap&SS 66, 281
- (2) Barone F., Milano L., Russo G. 1990, in: Active Close Binaries (ed. C.Ibanoglu), Kluwer Acad. Publ., p. 161.
- (3) ESA 1997, The Hipparcos and Tycho Catalogues, ESA SP-1200
- (4) Figueiredo J., De Greve J.P., Hilditch R.W. 1994, A&A 283, 144
- (5) Hendry P.D., Mochnacki S.W., Collier Cameron A. 1992, ApJ 399, 246
- (6) Kiss L.L., Csák B., Thomson J.R., Szatmáry K. 1999a, IBVS No. 4660
- (7) Kiss L.L., Csák B., Thomson J.R., Vinkó J. 1999b, A&A 345, 149
- (8) Kurucz R.L. 1979, ApJ S. 40, 1
- (9) Kurucz R.L. 1993, ATLAS9 Stellar Atmosphere Programs and 2 km/s Model Grids, CR-ROM No.13
- (10) Lang K.L. 1991, Astrophysical Data: Planets and Stars, Springer-Verlag
- (11) Liu T., Janes K.A. 1989, ApJS 69, 593
- (12) Nielsen R. F. 1983, Institute Theoric. Astrophysics Oslo Report No. 59, ed. O. Hauge, p 141
- (13) Penston M.J. 1973, MNRAS 164, 133
- (14) Rucinski S.M. 1973, Acta Astron 23, 79
- (15) Rucinski S.M. 1983, A&A 127, 84
- (16) Rucinski S.M. 1993, in: The Realm of Interacting Binary Stars eds. J Sahade et al., Kluwer, p.111.
- (17) Rucinski S.M. 1997, AJ 113, 1112
- (18) Rucinski S.M., Duerbeck H.W. 1997, PASP 109, 1340
- (19) Rucinski S.M. 1998, AJ 115, 1135
- (20) Sarna M.J., Fedorova A.V. 1989, A&A 208, 111
- (21) Slettebak A., Stock J. 1959, Astron. Abh. Hamburg Sternwarte 5, 105
- (22) Vinkó J., Hegedüs T., Hendry P.D. 1996, MNRAS 280, 489
- (23) Vinkó J., Evans N.R., Kiss L.L., Szabados L. 1998, MNRAS, 296, 824