Asymmetric, arc minute scale structures around NGC 1275
Abstract
ROSAT HRI observations show complicated substructure in the X–ray surface brightness within 5 arcminutes around NGC 1275 – the dominant galaxy of the Perseus cluster. The typical amplitude of the variations is of the order of 30% of the azimuthally averaged surface brightness at a given distance from NGC 1275. We argue that this substructure could be related to the activity of NGC 1275 in the past. Bubbles of relativistic plasma, inflated by jets, be forced to rise by buoyancy forces, mix with the ambient intracluster medium (ICM), and then spread. Overall evolution of the bubble may resemble the evolution of a hot bubble during a powerful atmospheric explosion. From a comparison of the time scale of the bubble inflation to the rise time of the bubbles and from the observed size of the radio lobes which displace the thermal gas, the energy release in the relativistic plasma by the active nucleus of NGC 1275 can be inferred. Approximate modeling implies a nuclear power output of the order of erg s-1 averaged over the last years. This is comparable with the energy radiated in X-rays during the same epoch. Detailed measurements of the morphology of the X–ray structure, the temperature and abundance distributions with Chandra and XMM may test this hypothesis.
Key Words.:
galaxies: active - galaxies: clusters: individual: Perseus - cooling flows - galaxies: individual: NGC 1275 - X-rays: galaxies1 INTRODUCTION
The Perseus cluster of galaxies (Abell 426) is one of the best studied clusters, due to its proximity (, corresponds to 30 kpc for ) and brightness. Detailed X–ray images were obtained with the Einstein IPC (Branduardi–Raymont et al. 1981) and HRI (Fabian et al. 1981) and the ROSAT PSPC (Schwarz et al. 1992, Ettori, Fabian, White 1999) and HRI (Böhringer et al. 1993; see also Heinz et al. 1998). The cluster has a prominent X–ray surface brightness peak at its center along with cool gas, which is usually interpreted as due to the pressure induced flow of gas releasing its thermal energy via radiation. The cooling flow is centered on the active galaxy NGC1275, containing a strong core-dominated radio source (Per A, 3C 84) surrounded by a lower surface brightness halo (e.g. Pedlar et al. 1990, Sijbring 1993). Analysis of the ROSAT HRI observations of the central arcminute has shown that the X-ray emitting gas is displaced by the bright radio emitting regions (Böhringer et al. 1993), suggesting that the cosmic ray pressure is at least comparable to that of the hot intracluster gas. Many other studies explored correlations of X-ray, radio, optical, and ultraviolet emission (see e.g. McNamara, O’Connell & Sarazin, 1996 and references therein). In this contribution, we discuss asymmetric structure in the X–ray surface brightness within 5 arcminutes of NGC 1275 and suggest that buoyant bubbles of relativistic plasma may be important in defining the properties of this structure.
2 IMAGES
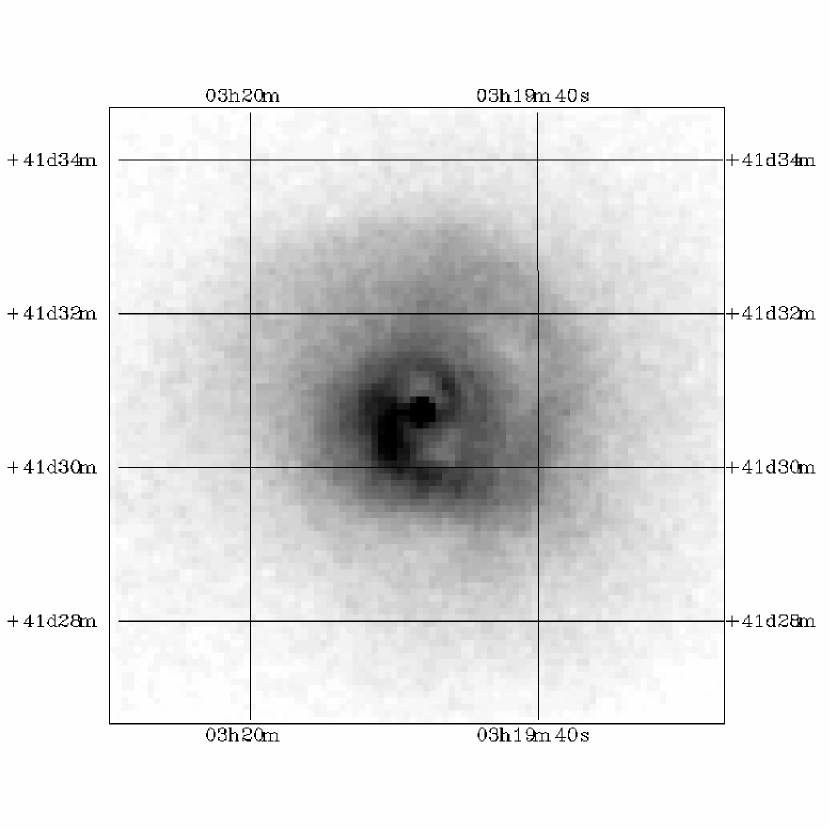
The longest ROSAT HRI pointing towards NGC 1275 was made in August 1994 with a total exposure time of about 52 ksec. The subsection of the HRI image, smoothed with a Gaussian, is shown in Fig. 1. The image is centered at NGC 1275. Two X–ray minima immediately to the north and south of NGC 1275 coincide (Böhringer et al. 1993) with bright lobes of radio emission at 332 MHz, mapped with the VLA by Pedlar et al. (1990). Another region of reduced brightness ( to the north–west from NGC 1275) was detected earlier in Einstein IPC and HRI images (Branduardi–Raymont et al. 1981, Fabian et al. 1981). It was suggested that reduced brightness in this region could be due to a foreground patch of a photoabsorbing material or pressure driven asymmetry in the thermally unstable cooling flow (Fabian et al. 1981). The complex shape of the X-ray surface brightness is much more clearly seen in Fig. 2 which shows the same image, adaptively smoothed using the procedure of Vikhlinin, Forman, Jones (1996). The “compressed” isophotes in the figure delineate a complex spiral–like structure. Comparison of Fig. 2 and Fig. 1 shows that the same structure is present in both images, i.e. it is not an artifact of the adaptive smoothing procedure.
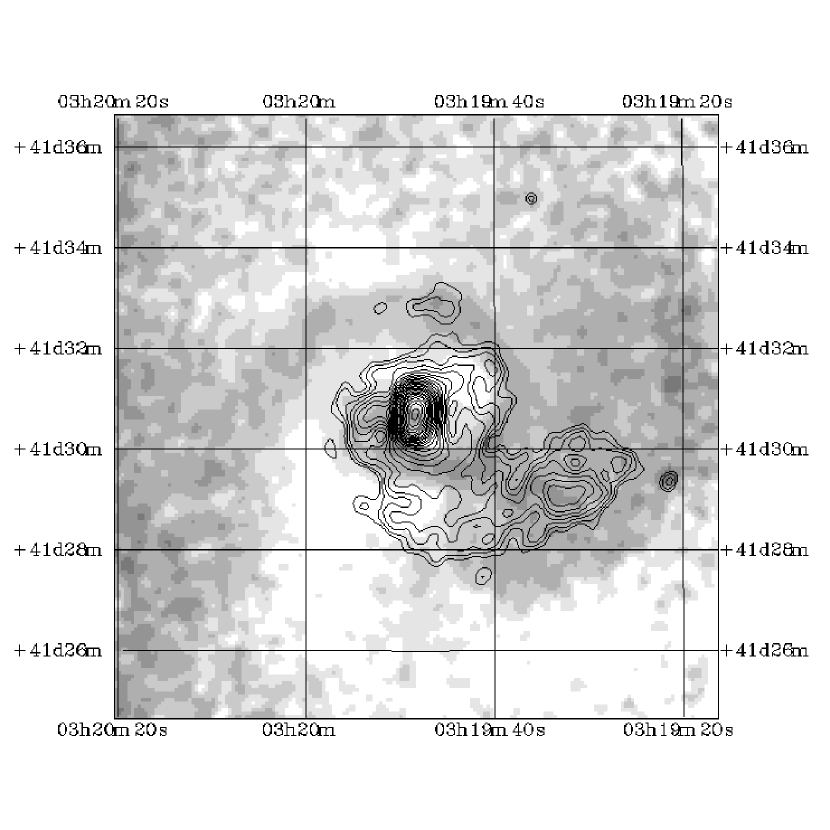
In order to estimate the amplitude of the substructure relative to the undisturbed ICM, we divided the original image (Fig.1) by the azimuthally averaged radial surface brightness profile. The resulting image, convolved with the Gaussian is shown in Fig.3. The regions having surface brightness higher than the azimuthally averaged value appear grey in this image and form a long spiral–like structure starting near the cluster center and ending from the center to the south–east. Of course the appearance of the excess emission as a “spiral” strongly depends on the choice of the “undisturbed” ICM model (which in the case of Fig.3 is a symmetric distribution around NGC 1275). Other models would imply different shapes for the regions having excess emission. In particular a substantial part of the subtructure seen in Fig.1 and 2 can be accounted for by a model consisting of a sequence of ellipses with varying centers and position angles (e.g. using the IRAF procedure ellipse due to Jedrzejewski, 1987). Nevertheless the image shown in Fig.3 provides a convenient characterization of the deviations of the X–ray surface brightness relative to the azimuthally averaged value. Comparison of Fig.3 and Fig.1, 2 allows one to trace all features visible in Fig.3 back to the original image.
Superposed onto the image shown in Fig.3 are the contours of the radio image of 3C 84 at 1380 MHz (Pedlar et al. 1990). The radio image was obtained through DRAGN atlas (http://www.jb.man.ac.uk/atlas edited by J. P. Leahy, A . H. Bridle, and R. G. Strom). In this image, having a resolution of arcsec2, the central region is not resolved (unlike the higher resolution image of the central area used in Böhringer et al. 1993) and it does not show features, corresponding to the gas–voids north and south of the nucleus. The compact feature to the west of NGC 1275, visible both in X–rays and radio, is the radio galaxy NGC 1272. Fig.3 hints at possible relations between some prominent features in the radio and X–rays. In particular, the X–ray underluminous region to the North–West of NGC 1275 (Branduardi–Raymont et al. 1981, Fabian et al. 1981) seems to coincide with a “blob” in radio. A somewhat better correlation is seen if we compare our image with the radio map of Sijbring (1993), with its better angular resolution), but again the correlation is not one to one111Note, that some random correlation is expected since both the X–ray and radio emission are asymmetric and centrally concentrated around NGC 1275. A similar partial correlation of X–rays and radio images also was found for another well studied object – M87 (Böhringer et al. 1995). For M87, the relatively compact radio halo surrounds the source and some morphological similarities of the X–ray and radio images are observed. Gull and Northover (1973) suggested that buoyancy plays an important role in the evolution of the radio lobes. Böhringer et al. (1993, 1995) pointed out that buoyant bubbles of cosmic rays may affect the X–ray surface brightness distribution in NGC 1275 and M87. Below we speculate on the hypothesis that this mechanism is operating in both sources and the disturbance of X–ray surface brightness is related, at least partly, with the activity of an AGN in the past.

3 EVOLUTION OF THE OLD RADIO LOBES
The complex substructure of the X–ray emission in the Perseus cluster is seen at various spatial scales. At large scales (larger than – ), excess emission to the east of NGC 1275 was observed in the HEAO–2 IPC and ROSAT images (Branduardi–Raymont et al. 1981, Fabian et al. 1981, Schwarz et al. 1992, Ettori, Fabian, White 1999). Schwarz et al. (1992), using ROSAT PSPC data, found that the temperature is lower in this region and suggested that there is a subcluster projected on the A426 cluster and merging with the main cluster. At much smaller scales (), there are two X–ray minima (symmetrically located to the north and south of NGC 1275) which Böhringer et al. (1993) explained as due to the displacement of the X–ray emitting gas by the high pressure of the radio emitting plasma associated with the radio lobes around NGC 1275. As is clear from Fig.1,2 at intermediate scales (arcminutes), substructure is also present. We concentrate below on the possibility that at these spatial scales, the disturbed X–ray surface brightness distribution is affected by the bubbles of radio emitting plasma, created by the jets in the past and moving away from the center due to buoyancy.
Recently Heinz, Reynolds & Begelman (1998) argued that the time-averaged power of the jets in NGC 1275 exceeds . This conclusion is based on the observed properties (in particular – sharp boundaries) of the X–ray cavities in the central , presumably inflated by the relativistic particles of the jet. Such a high power input is comparable to the total X–ray luminosity of the central region (i.e. 200 kpc) around NGC 1275. If the same power is sustained for a long time (e.g. cooling time of the gas years at a radius of 200 kpc) then the entire cooling flow region could be affected. Following Gull and Northover (1973) we assume that buoyancy (i.e. Rayleigh–Taylor instability) limits the growth of the cavities inflated by the jets. After the velocity of rise due to buoyancy exceeds the expansion velocity, the bubble detaches from the jet and begins rising. As we estimate below, for the jet power of the bubble at the time of separation from the jet should have a size 10–20 kpc (). The subsequent evolution of the bubble may resemble the evolution of a powerful atmospheric explosion or a large gas bubble rising in a liquid (e.g. Walters and Davison 1963, Onufriev 1967, Zhidov et al. 1977). If the magnetic field does not provide effective surface tension to preserve the quasi–spherical shape of the bubble, then it quickly transforms into a torus and mixes with the ambient cooling flow gas. The torus keeps rising until it reaches the distance from the center where its density (accounting for adiabatic expansion) is equal to the density of the ambient gas. Since the entropy of the ICM rises with distance from the center in the cooling flow region, the torus is unlikely to travel a very large distance from the center. Then the torus extends in the lateral direction in order to occupy the layer having a similar mass density. Below we give order of magnitude estimates characterizing the formation and evolution of the bubble.
For simplicity we assume a uniform ICM in the cluster center, characterised by the density and pressure . The bubble is assumed to be spherical. During the initial phase (Scheuer 1974, Heinz et al., 1998) jets with a power inflate the cocoon with relativistic plasma and surrounded by a shell of the compressed ICM. The expansion is supersonic and from dimensional arguments it follows that the radius of the bubble as a function of time is given by the expression
| (1) |
where is a numerical constant (see e.g. Heinz et al., 1998 for a more detailed treatment). At a later stage, expansion slows and becomes subsonic. The evolution of the bubble radius is then given by the expression
| (2) |
where is the adiabatic index of the relativistic gas in the bubble (i.e. ). The above equation follows from the energy conservation law, if we equate the power of the jet with the change of internal energy plus the work done by the expanding gas at constant pressure: . The expansion velocity is then simply the time derivative of equation (1) or (2).
The velocity at which the bubble rises due to buoyancy can be estimated as
| (3) |
where is a numerical constant of order unity, is the mass density of the relativistic gas in the bubble, is the gravitational acceleration, is the distance of the bubble from the cluster center, is the gravitating mass within this radius and, is the Keplerian velocity at this radius. In equation (3) we assumed that and therefore replaced the factor (Atwood number) with unity. The presently observed configuration of the bubbles on either side of NGC 1275 suggests that . Assuming that such a similar relation is approximately satisfied during the subsequent expansion phase of the bubble we can further drop the factor in equation (3). Thus as a crude estimate we can assume that ( is a commonly accepted value for incompressible fluids). Following Ettori, Fabian, and White (1999) we estimate the Keplerian velocity taking the gravitating mass profile as a sum of the Navarro, Frenk and White (1995) profile for the cluster and a de Vaucouleurs (1948) profile for the galaxy. For the range of parameters considered in Ettori, Fabian, White (1999), the Keplerian velocity between a few kpc and 100 kpc falls in the range 600-900 km/s. We can now equate the expansion velocity (using equation (2) for subsonic expansion) and the velocity due to buoyancy in order to estimate the parameters of the bubble when it starts rising:
| (4) |
| (5) |
Here and are the duration of the expansion phase and the radius of the bubble respectively. In the above equation we neglected the contribution to the radius (and time) of the initial supersonic expansion phase. Thus for and for (Böhringer et al. 1993) we expect , which approximately corresponds to the size of the X–ray cavities reported by Böhringer et al. (1993). If, as suggested by Heinz et al. (1998), the jet power is larger than then the bubble size will exceed 50 kpc () before the buoyancy velocity exceeds the expansion velocity. Of course these estimates of the expanding bubble are based on many simplifying assumptions (e.g. constant pressure assumption in equation (2)). In a subsequent publication we consider the expansion of the bubble in more realistic density and temperature profiles expected in cluster cooling flows.
According to e.g. Walters and Davison (1963), Onufriev (1967), Zhidov et al. (1977), a large bubble of light gas rising through much heavier gas under a buoyancy force will quickly transform into a rotating torus, which consists of a mixture of smaller bubbles of heavier and lighter gases. This transformation occurs on times scales of the Rayleigh–Taylor instability (i.e. ) and during this transformation the whole bubble changes its distance from the center by an amount . The torus then rises until its average mass density is equal to the mass density of the ambient gas. The rise is accompanied by adiabatic expansion and further mixing with the ambient gas. Accounting for adiabatic expansion the mass density of the torus will change during the rise according to
| (6) |
where is the ICM pressure at a given distance from the center, is volume fraction of the ambient ICM gas mixed with the relativistic plasma at the stage of torus formation, and are the adiabatic indices of the relativistic plasma and the ICM. Note that in equation (6) we (i) neglected further mixing with the ICM during the rise of the torus and (ii) mixing was assumed to be macroscopic (i.e. separate bubbles of the relativistic plasma and ICM occupy the volume of the torus). The equilibrium position of the torus can be found if we equate the torus density and the ICM density and solve this equation for . We consider two possibilities here. One possibility is to assume that in the inhomogeneous cooling flow, the hot phase is almost isothermal and gives the dominant contribution to the density of the gas. Adopting the temperature of keV for the hot phase and using the same gravitational potential as above, one can conclude that if a roughly equal amount (by volume) of the relativistic plasma and the ambient gas are mixed (i.e. ), during the formation of the torus, then it could rise 100-200 kpc before reaching an equilibrium position. Accounting for additional mixing will lower this estimate. Alternatively we can adopt the model of a uniform ICM with the temperature declining towards the center (e.g. temperature is decreasing from 6 keV at 200 kpc to 2 keV at 10 kpc). Then for the same value of mixing () the equilibrium position will be at the distance of 60 kpc from NGC 1275. Once at this distance the torus as a whole will be in equilibrium and it will further expand laterally in order to occupy the equipotential surface at which the density of the ambient gas is equal to the torus density. If the cosmic rays and thermal gas within the torus are uniformly mixed (or a magnetic field binds the blobs of thermal plasma and cosmic rays), the torus will not move radially. If, on the contrary, separate (and unbound) blobs of relativistic plasma exist then they will still be buoyant, but since their size is now much smaller than the distance from the cluster center the velocity of their rise will be much smaller than the Keplerian velocity. Analogously overdense blobs (with uplifted gas) may then (slowly) fall back to the center.
We now consider how radio and X–ray emission from the torus evolve with time. Duration of the rise phase of the torus will be at least several times longer than the time of the bubble formation (see eq. (3)), since the velocity of rise is a fraction of the Keplerian velocity (see e.g. Zhidov et al., 1977), i.e., years. Adiabatic expansion and change of the transverse size of the torus in the spherical potential tend to further increase this estimate. Even if we neglect energy losses of the relativistic electrons due to adiabatic expansion we can estimate an upper limit on the electron lifetime due to synchrotron and inverse Compton (IC) losses.
| (7) |
where is the wavelength of the observed radio emission, is the strength of the magnetic field, is the value characterizing the total energy density of the magnetic field and cosmic microwave background. This life time (of the electrons emitting at a given frequency) will be longest if the energy density of the magnetic field approximately matches the energy density of the microwave background, i.e., . Then the maximum life time of the electrons producing synchrotron radiation at 20 cm is years. This time is comparable to the time needed for the torus to reach its final position. Therefore, the torus could be either radio bright or radio dim during its evolution. If no reacceleration takes place, then the torus will end up as a radio dim region. We note here that, although the electrons may lose their energy via synchrotron and IC emission, the magnetic field and especially relativistic ions have a much longer lifetime (e.g. Soker & Sarazin 1990, Tribble 1993) and will provide pressure support at all stages of the torus evolution.
As we assumed above, the bubble detaches from the jet when the expansion velocity of the bubble is already subsonic. This means that there will be no strongly compressed shell surrounding the bubble and the emission measure along the line of sight going through the center of the bubble will be smaller than that for the undisturbed ICM, i.e., at the moment of detachment the bubble appears as an X–ray dim region. The X–ray brightness of the torus during final stages of evolution (when the torus has the same mass density as the ambient ICM) depends on how the relativistic plasma is mixed with the ambient gas (Böhringer et al. 1995). If mixing is microscopic (i.e. relativistic and thermal particles are uniformly mixed over the torus volume on spatial scales comparable with the mean free path) then the emission measure of the torus is the same as that for a similar region of the undisturbed ICM. Since part of the pressure support in the torus is provided by magnetic field and cosmic rays then the temperature of the torus gas must be lower than the temperature of the ambient gas (Böhringer et al. 1995). Thus emission from the torus will be softer than the emission from the ambient gas.
If, on the contrary, mixing is macroscopic (i.e. separate bubbles of relativistic and thermal plasma occupy the volume of the torus), then the torus will appear as an X–ray bright region (the average density is the same as of ICM, but only a fraction of the torus volume is occupied by the thermal plasma). For example, if half of the torus volume is occupied by the bubbles of the relativistic plasma then the emissivity of the torus will be a factor of 2 larger than that of the ambient gas. The X–ray emission of the torus is again expected to be softer than the emission of the ambient gas for two reasons (i) gas uplifted from the central region has lower entropy than the ambient gas and therefore will have lower temperature when maintaining pressure equilibrium with the ambient gas (ii) gas, uplifted from the central region, can be multiphase with stronger density contrasts between phases than the ambient gas and as a result a dense, cooler phase would give a strong contribution to the soft emission. Cosmic rays may heat the gas, but at least for the relativistic ions, the time scale for energy transfer is very long (comparable to the Hubble time). Trailing the torus could be the filaments of cooling flow gas dragged by the rising torus in a similar fashion as the rising (and rotating) torus after an atmospheric explosion drags the air in the form of a skirt.
We note here that the morphology predicted by such a picture is very similar to the morphology of the “ear–like” feature in the radio map of M87, reported by Böhringer et al. (1995). The “ear” could be a torus viewed from the side. The excess X–ray emission trailing the radio feature could then be due to the cooling flow gas uplifted by the torus from the central region. For Perseus the X–ray underluminous region to the North–West of NGC 1275 could have the same origin (i.e. rising torus). In fact, the whole “spiral” structure seen in Fig.2 could be the remains of one very large bubble (e.g. with the initial size of the order of arminutes – corresponding to a total jet power of ) inflated by the nucleus over a period of years. Alternatively multiple smaller bubbles, produced at different periods may contribute to the formation of the X–ray feature. If the jets maintain their direction over a long time then a quasi–continuous flow of bubbles will tend to mix the ICM in these directions uplifting the gas from the central region to larger distances. If the jet direction varies (e.g. precession of the jet on a timescale of years) then a complex pattern of disturbed X–ray and radio features may develop.
4 ALTERNATIVE SCENARIOS
Of course there are other possible explanations for disturbed X–ray surface brightness. We briefly discuss a few alternative scenarios below.
Assuming that the undisturbed ICM is symmetric around NGC 1275 (as was assumed in Fig.3) one may try to attribute the observed spiral-shaped emission to the gas stripped from an infalling galaxy or group of galaxies. Stripped gas (if denser and cooler than the ICM) will be decelerated by ram pressure and will fall toward the center of the potential, producing spiral–like structure. Rather narrow and long features tentatively associated with stripped gas were observed e.g., for the NGC 4921 group in Coma (Vikhlinin et al. 1996) and NGC 4696B in the Centaurus cluster (Churazov et al. 1999). We note here that to prevent stripping at much larger radii, the gas must be very dense (e.g., comparable to the molecular content of a spiral galaxy). A crude estimate of the gas mass needed to produce the observed excess emission (assuming a uniform cylindrical feature with a length of 200 kpc and radius of 15 kpc, located 60 kpc away from NGC1275) gives values of the order of a few – . Here we adopted a density for the undisturbed ICM of at this distance from NGC 1275 following the deprojection analysis of Fabian et al. (1981) and Ettori, Fabian, and White (1999). The factor of two higher density within the feature will cause a 20–40% excess in the surface brightness. In the above estimate for the mass of hot gas in the filament, it is assumed that this medium is approximately homogeneous and in ionization equilibrium. If the medium is very clumpy, the radiative emission of the plasma would be enhanced and this would result in an overestimate of the relevant gas mass. Such clumps should be easily seen with the high angular resolution of Chandra. Also if the medium consists of turbulently mixed hot and cold plasma, the very efficient excitation of lines in cold ions by hot electrons could lead to enhanced radiation (see e.g. Böhringer and Fabian 1989, Table 4) which may lead to an overestimate of the gas mass by up to an order of magnitude. The signature of this effect is a strongly line dominated spectrum, (see e.g. Böhringer and Hartquist, 1987) which could be tested by Chandra or XMM, in particular for the important iron L-shell lines. Thus it is possible that the inferred gas mass could be lower by up to an order of magnitude which makes the stripping scenario more likely and future observations with the new X-ray observatories can help to differentiate between these interpretations.
As was suggested by Fabian et al. (1981) a large scale pressure–driven asymmetry may be expected in a thermally unstable cooling flow. This is perhaps the most natural explanation which does not invoke any additional physics. The same authors gave an estimate of the amount of neutral gas needed to explain the NW dip due to photoabsorption: excess hydrogen column density around is required to suppress the soft count rate in this region.
Yet another possibility is that the motion of NGC 1275 with respect to the ICM causes the observed substructure. As pointed out in Böhringer et al. (1993), NGC 1275 is perhaps oscillating at the bottom of the cluster potential well causing the excess emission to the east of the nucleus. Since the X-ray surface brightness peak is well centered on NGC 1275, it is clear that the galaxy drags the central part of the cooling flow as it moves in the cluster core. At a distance larger than 2-3 arcminutes from NGC 1275, the cluster potential dominates over the potential of the galaxy. The gas at this distance should be very sensitive to the ram pressure of the ambient cluster gas and might give rise to the asymmetric (and time dependent) features.
The motion of NGC 1275 could also contribute to the X-ray structure through the formation of a “cooling wake” (David et al. 1994). If NGC 1275 is moving significantly, then inhomogeneities in the cooling gas would be gravitationally focussed and compressed into a wake. The wake would mark the, possibly complex, motion of NGC 1275, as it is perturbed by galaxies passing through the cluster core. Such a feature would be cool, since it arises from overdense concentrations of gas.
Finally, one can assume that cooling gas may have some angular momentum (e.g., produced by mergers) and the observed spiral structure simply reflects slow rotation of the gas combined with non-uniform cooling. Following Sarazin et al. (1995), one can assume that this gas will preserve the direction of its angular momentum and that this infalling material would eventually feed an AGN – NGC 1275. One then might expect the radio jets to be aligned perpendicular to the rotation plane of the gas. At first glance, the “spiral” feature appears approximately face-on, suggesting that jets should be directed along the line of sight as indeed is derived from the radio observations (see Pedlar et al. 1990).
5 CONCLUSIONS
The X–ray surface brightness around NGC 1275 (dominant galaxy of the Perseus cluster) is perturbed at various spatial scales. We suggest that on arcminute scales, the disturbance is caused by bubbles of relativistic plasma, inflated by jets during the past years. Overall evolution of the buoyant bubble will resemble the evolution of a hot bubble during a powerful atmospheric explosion. Colder gas from the central region of the cooling flow may be uplifted by the rising bubbles and (in the case of continuous jet activity) may make several cycles (from the center to the outer regions and back) on time scales comparable to the cooling time of the gas in the cooling flow.
A very important result that can be inferred from this model is the total power output of the nuclear energy source in NGC 1275 in the form of relativistic plasma. This energy release averaged over a time scale of about to years is estimated as a function of the inflation time of the central radio lobes, the rise time of the inflated bubbles due to buoyancy forces, and the actual size of the central bubbles. A geometrically simplified model yields a power output on the order of erg s-1. This is comparable with the energy lost at the same time by thermal X-ray radiation from the entire central cooling flow region. This raises the question, where does all this energy go, especially if the energy release is persistent over a longer epoch during which the relativistic electrons can lose their energy by radiation, but the energy in protons and in the magnetic field is mostly conserved. The complicated X-ray morphology discussed in this paper may indicate long lasting nuclear activity, if we interpret the peculiar structure in the X-ray surface brightness as remnants of decaying radio lobe bubbles.
Detailed measurements of the morphology of the X–ray structure and the temperature and abundance distribution with Chandra and XMM may test this hypothesis. The gas uplifted from the central region is expected to be cooler than the ambient gas and to have an abundance of heavy elements typical of the innermost region. If cosmic rays are mixed with the thermal gas, then the pressure, as derived from X–ray observations, may be lower than the pressure of the ambient gas.
Acknowledgements.
We thank the referees for several helpful comments and suggestions. We are grateful to Nail Inogamov and Nail Sibgatullin for useful discussions. This research has made use of data obtained through the High Energy Astrophysics Science Archive Research Center Online Service, provided by the NASA/Goddard Space Flight Center. W. Forman and C. Jones acknowledge support from NASA contract NAS8-39073.References
- Böhringer & Hartquist (1987) Böhringer H. & Hartquist, T.W., 1987, MNRAS, 228, 915
- Böhringer & Fabian (1989) Böhringer H. & Fabian A.C., 1989, MNRAS, 237, 1147
- Böhringer et al. (1993) Böhringer, H., Voges, W., Fabian, A.C., Edge, A.C., Neumann, D.M., 1993 MNRAS, 264, L25
- Böhringer & Morfill (1993) Böhringer, H., Morfill, G.E., 1993 ApJ, 330, 609
- Böhringer et al. (1995) Böhringer, H., Nulsen, P. E.J., Braun, R., Fabian, A. C., 1995 MNRAS, 274, L67
- Branduardi-Raymont et al. (1981) Branduardi-Raymont, G., Fabricant, D., Feigelson, E., Gorenstein, P., Grindlay, J., Soltan, A., Zamorani, G., 1981 ApJ, 248, 55
- Churazov et al. (1999) Churazov E., Gilfanov M., Jones C., Forman W., 1999 ApJ, 520, 105
- David et al. (1994) David, L., Jones, C., Forman, W., Daines, S. 1994, ApJ, 428, 544
- de Vaucouleurs (1948) de Vaucouleurs 1948 Ann. Astrophys, 11, 247
- Ettori, Fabian and White (1999) Ettori, S. Fabian, A.C. White, D.A. 1999, MNRAS, 300, 837
- Fabian et al. (1981) Fabian, A. C., Hu, E. M., Cowie, L. L., Grindlay, J., 1981 ApJ, 248, 47
- Gull and Northover (1973) Gull, S.F., Northover, K. J. E. 1973 Nature, 244, 80
- Jedrzejewski (1987) Jedrzejewski, R.I. 1987, MNRAS, 226, 747
- Heinz, Reynolds, Begelman (1998) Heinz, S., Reynolds, C.S., Begelman, M.C., 1998 ApJ, 501, 126
- McNamara,O’Connell, Sarazin (1996) McNamara, B.R., O’Connell, R.W., Sarazin, C.L., 1996 AJ, 112, 91
- Navarro, Frenk, White (1995) Navarro, J.F. Frenk, C.S. White, S.D.M. 1995 MNRAS, 275, 720
- Onufriev (1967) Onufriev, A.T. 1967, Zhurnal Prikladnoi Mekhaniki i Tehnicheskoi Fisiki, 2, 101
- Pedlar et al. (1990) Pedlar, A., Ghataure, H.S., Davies, R.D., Harrison, B.A., Perley, R., Crane, P.C., Unger, S.W., 1990 MNRAS, 246, 477
- Sarazin et al. (1995) Sarazin, C.L., Burns, J.O., Roettiger, K., McNamara, B.R., 1995 ApJ, 447, 559
- Scheuer (1974) Scheuer, P.A.G. 1974 MNRAS, 166, 513
- Schwarz et al. (1992) Schwarz, R. A., Edge, A. C., Voges, W., Boehringer, H., Ebeling, H., Briel, U. G., 1992, A&A, 256, L11
- Sijbring (1993) Sijbring D., 1993, Ph.D., Groningen Univ.
- Soker & Sarazin (1990) Soker, N., Sarazin, C., 1990 ApJ, 348, 73
- Tribble (1993) Tribble, P.C., 1993 MNRAS, 263, 31
- Vikhlinin, Forman, & Jones (1996) Vikhlinin A., Forman W., Jones C, 1996 ApJ, 474, L7
- (26) Walters, J.K. Davidson, J.F. 1963, J.Fluid.Mech., 17, 321
- Zhidov et al. (1977) Zhidov, I.G. Meshkov, E.E. Popov, V.V.Rogachev, V.G. Tolshmyakov A.I. 1977, Zhurnal Prikladnoi Mekhaniki i Tehnicheskoi Fisiki , 3, 75