Resolving the extragalactic hard X-ray background
∗ NASA Goddard Space Flight Center, Code 662, Greenbelt, MD 20771
† Institute for Astronomy, University of Hawaii, 2680 Woodlawn Drive, Honolulu, HI 96822
‡ Astronomy Department, University of Maryland, College Park, MD 20742
To be published in Nature
The origin of the hard ( keV) X-ray background has remained mysterious for over 35 years. Most of the soft ( keV) X-ray background has been resolved into discrete sources, which are primarily quasars; however, these sources do not have the flat spectral shape required to match the X-ray background spectrum. Here we report the results of an X-ray survey 30 times more sensitive than previous studies in the hard band and four times more sensitive in the soft band. The sources detected in our survey account for at least 75 per cent of the hard X-ray background. The mean X-ray spectrum of these sources is in good agreement with that of the background. The X-ray emission from the majority of the detected sources is unambiguously associated with either the nuclei of otherwise normal bright galaxies or optically faint sources, which could either be active nuclei of dust enshrouded galaxies or the first quasars at very high redshifts.
For some time after the discovery of the cosmic X-Ray background (XRB)giacconi , there was considerable controversy over whether the background arose from a superposition of discrete sources or from thermal bremsstrahlung emission from a hot intergalactic gas. We now know that the bulk of the XRB cannot originate in a uniform hot intergalactic medium since a strong Compton distortion on the cosmic microwave background spectrum was not observed by the FIRAS instrument on COBE mather2 ; wright .
At soft X-ray energies ( keV) the XRB has been extensively studied with the ROSAT satellite. The deepest ROSAT source counts reach per square degree at a limiting flux of erg cm-2 s-1, and at this level per cent of the XRB is resolved into discrete sources hasinger . The great majority of the optical identifications of a complete sample of 50 ROSAT sources, at a limiting flux of erg cm-2 s-1, are unobscured active galactic nuclei (AGN) schmidt1 . However, because the objects detected in the soft band do not have the spectrum of the XRB, a new population of absorbed or flat spectrum objects are needed to make up the background at higher energies. Detailed models developed to resolve this “spectral paradox” assumed that most of the flux in the XRB is produced by active galaxies that are obscured by dust. When deep imaging sky surveys with the ASCAueda ; ueda1 ; ueda2 ; cagnoni and BeppoSAXfiore satellites became possible in the hard ( keV) X-ray band, per cent of the hard XRB was resolved, but only indirect identifications of the optical counterparts could be made.
The Chandra satelliteweisskopf , with its great sensitivity over a wide energy range, excellent image quality, superb positional accuracy, and reasonable field-of-view, can directly image the sources that make up the hard XRB. We have therefore carried out a deep imaging survey of the Hawaii Deep Survey Field SSA13 with the ACIS-S instrument on Chandra to resolve the hard XRB and to identify the nature of the sources that produce it. We chose to centre on the SSA13 fieldlilly , which has existing multiwavelength observationswindhorst ; songaila ; barger , to maximize the immediate identification of optical/near-infrared (NIR) counterparts and redshifts for the X-ray source detections. We find that above a flux threshold of erg cm-2 s-1 ( keV), we can account for at least per cent of the sky flux, with the main uncertainty being the sky flux itself. Our deep optical observations show a rich assortment of hard X-ray sources which could not have been discovered by previous satellites.
Chandra X-ray Survey of SSA13
The SSA13 observation was performed on 1999 December 3–4 for an elapsed time of 100.9 ks. The optical axis of the telescope at RA(2000), Dec(2000) was positioned on the back illuminated CCD (S3) of ACIS since this detector has a much better soft X-ray sensitivity than the front illuminated chips. Furthermore, since the back illuminated detectors did not suffer the radiation damage which affected the front illuminated chips in orbit, they are well characterised by extensive ground-based calibrations.
The overall sensitivity of the instrument spans a wide energy range from 0.2 to 10 keV. Two energy-dependent images of the S3 chip were generated in the hard ( keV) and soft ( keV) bands, as was a keV image of the front illuminated S2 chip that covered a neighboring region. We extracted sources independently for the hard and soft band images. Sources brighter than erg cm-2 s-1 ( keV) or erg cm-2 s-1 ( keV; S3 chip only) which lie within 6 arcminutes of the optical axis are given in Table 1, ordered by right ascension; the table contains 22 sources selected in the hard band and a further 15 sources selected solely in the soft band. Details of the extraction and calibration of the X-ray data and of the optical photometry may be found in the table footnote.
Number Counts and the Resolution of the X-ray Background
The cumulative counts per square degree, , are the sum of the inverse areas of all sources brighter than flux . Sources at the faintest fluxes can be detected only at smaller off-axis angles where the PSF and vignetting corrections are smaller; thus, the area diminishes with flux. In Fig. 1a, b we present our cumulative counts per square degree (filled squares) in the soft and hard bands, respectively, with uncertainties from the Poisson error in the number of detected sources (jagged solid lines). To the limiting flux levels of erg cm-2 s-1 ( keV) and erg cm-2 s-1 ( keV), simulations show that the counts are nearly complete and that Eddington bias is unimportant; thus, the raw counts accurately represent the true counts.


Our soft band counts are in excellent agreement with the deep ROSAT counts in the Lockman Hole from Hasinger et al.hasinger in the region of overlap. At fainter fluxes our new counts fall at the lower limit of their fluctuation analysis, which suggests an ongoing flattening.
An area-weighted maximum likelihood fitmurdoch of a single power-law to the keV counts over the flux range erg cm-2 s-1 is given by the relation
| (1) |
where the errors on the power-law index are 68% confidence. Likewise, a power-law fit to the keV counts over the flux range erg cm-2 s-1 is given by
| (2) |
where the counts intercept the ASCA extrapolation at the upper end of the flux range. Though the range in indices is consistent with the power-law index of 1.5 seen at brighter fluxes, the counts are significantly lower than an extrapolation of the ASCA counts.
The source contributions to the XRB can be obtained by summing the individual fluxes divided by area or, more indirectly, by integrating using the power-law fits. We list the directly summed source contributions to the XRB in the two bands in Table 2, along with previous determinations by ROSAT and ASCA. With the additional 10 per cent contribution from our data to the soft band, a maximum flux of erg cm-2 s-1 deg-2 remains to be accounted for. In the hard band, the combination of the present results with the ASCA measurements at higher fluxes means that at least per cent of the background (using the highest published normalisation) is resolved to the currently observed flux limits.
Optical Properties of the X-ray Sources
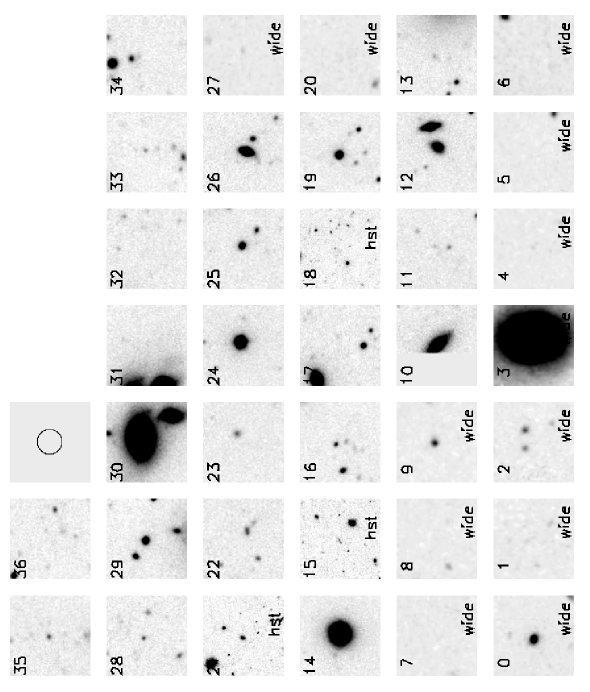
We have compared our X-ray images with existingcowie96 ; wilson deep , , , and images obtained with the Keck 10 m and UH 2.2 m telescopes. Because of the excellent arcsec X-ray positional accuracy, we can, in most cases, securely identify the optical counterparts to the X-ray sources. In Fig. 2a, b we show thumbnail -band images of all of the X-ray sources in Table 1. Only one source, CXO J131159.3+423928 (significant in both the hard and soft X-ray images), is significantly extended in the X-ray images; it is probably a high redshift cluster. The optical image (thumbnail 35 of Fig. 2a) is centred on a faint () galaxy which lies at the centre of a region of enhanced galaxy density. In addition to the probable cluster, the hard sample contains two quasars, eight bright galaxies, and eleven optically faint () objects, while the soft sample contains five quasars, five bright galaxies, and fifteen unidentified optically faint objects. Morphologically the X-ray selected bright galaxy population consists of a mixture of early spirals and elliptical galaxies. Three of the bright galaxies show possible signs of interaction with nearby bright neighbors while the remainder are clearly isolated.
Our Keck spectra for the quasars show broad MgII or CIV and Lyman alpha lines. In some of the bright galaxy spectra clear AGN signatures are present (e.g., a broad absorption line galaxy with P-Cygni profiles at ). However, although subtle AGN signatures may be present in their optical spectra, most of the bright galaxies would not have been identified in an optical survey as AGN. We illustrate this in Fig. 3 with spectra for three of the bright galaxies.

The X-ray Spectrum

The photon intensity of the XRB, , where is the photon energy in keV and has units of [photons cm-2 s-1 keV-1 sr-1], can be approximated by a power-law, . The HEAO1 A-2 experimentmarshall found that the XRB spectrum from keV was well described by a photon index , and this result has been confirmed and extended to lower energies by recent analyses of ASCAgendreau ; chen ; miyaji ; ishisaki and BeppoSAXvecchi data.
The photon indices of the individual sources given in Table 1 were computed from the ratios of the counts in the keV band to those in the keV band, assuming each source could be described by a single power-law. There is an extremely wide range of hardness in both samples, ranging from negative indices to in the hard-selected sample and from to values above 2 in the soft sample. The composite (counts-weighted) photon index is in the hard sample and in the soft sample. The progressive hardening of the soft sample as we move to fainter fluxes is a continuation of a trend seen in the ROSAT sampleshasinger93 ; almaini . The combined spectrum of all the soft X-ray sources of Table 1 is well fit by a single power-law over the keV range with an index of and an extinction corresponding to the galactic cm-2. If we assume that 75 per cent of the keV background has an index of 1.22 and that the remaining 25 per cent of the background comes from sources that have fluxes greater than erg cm-2 s-1 ( keV) and an average photon indexueda1 of 1.63, then the index of the combined sample is 1.38, which agrees extremely well with the spectrum of the hard X-ray background marshall ; gendreau ; chen ; miyaji ; ishisaki ; vecchi .
Inspection of Table 1 suggests that the hardest sources tend to correspond to the bright galaxies, with the optically faint objects having intermediate hardness, and the quasars being the softest of the sources observed. We illustrate this more clearly in Fig. 4 where we have plotted -band magnitude versus photon index. Of the objects, more than half are galaxies, and the majority of these have . The five known quasars all lie in the range, consistent with that of most brighter AGN. The faint sources spread over a wide range of indices that overlap both of the other populations. We can quantify this by generating the counts-weighted averages for each population separately. For the hard-selected sample, we find that the bright galaxies (#9, 12, 26, 29) have an average photon index of , the faint objects (#1, 6, 7, 8, 9, and 22) have , and the two quasars have . For the soft-selected sample, the 15 unidentified objects with have a composite index of , which is almost identical to that of the optically faint objects in the hard sample, and the quasars have a composite index of .
The Source of the Background
Our data conclusively show that AGN are the major contributors to the hard X-ray background. Many of our sources agree with the predictions of XRB synthesis modelssetti ; madau ; matt ; comastri ; zdziarski ; smith ; gilli ; schmidt2 ; miyaji2 constructed within the framework of AGN unification schemes to account for the spectral intensity of the hard XRB and to explain the X-ray source counts in the hard and soft energy bands. In the unified scheme, the orientation of a molecular torus surrounding the nucleus determines the classification of the source. The models invoke, along with a population of unobscured AGN, whose nuclear emission we see directly, a substantial population of intrinsically obscured AGN whose hydrogen column densities of cm-2 around the nucleus block our line-of-sight.
The AGN that make up the hard XRB come in two main flavors: roughly 40 per cent are luminous early-type galaxies (both ellipticals and early spirals) in the redshift range from to just beyond , and roughly 50 per cent have faint or, in some cases, undetectable optical counterparts. Most of these objects would not have been found even in sensitive optical surveys for AGN.
The bright galaxy population is extremely hard with an average photon index of . The X-ray sources are point-like and centred on the galaxy nuclei, which suggests that they are produced by accretion onto the central black holes that are known to be present in such systems. The hardness of the X-ray spectra indicates that these X-ray sources are highly obscured. Such sources were described by Moran et al.moran based on Einstein data. After hard X-ray components were discovered by Allen et al.allen in ASCA spectra of six nearby giant elliptical galaxies, a modeldm1 was constructed which was able to account for a large fraction of the XRB with objects of this type. The model predicted that a significant fraction of the hard number counts at fluxes erg cm-2 s-1 could arise from sources at low redshift, as is indeed now observed to be the case. The absolute magnitudes of these sources lie between and ( km s-1 Mpc-1 and ), or from just below to several times the luminosity, and their rest-frame keV luminosities range from to erg s-1. These sources are at too low redshifts to be likely submillimeter candidates; however, they should be far-infrared sources, which SIRTF and other upcoming airborne and space missions should be able to detect.
The optically faint sources have an average photon index of . These sources could either be a smooth continuation to of the bright early-type galaxies with obscured luminous X-ray nuclei, more distant obscured AGN, or something more exotic, such as extremely high redshift () quasars. For this final possibility, the objects would be invisible in the -band because of scattering by the foreground intergalactic neutral hydrogen. In the soft sample, eleven of the optically faint sources have and could lie in this category. This places an upper limit on the surface density of this type of source of 0.26 per square arcminute to the erg cm-2 s-1 limit of the keV sample, which is slightly lower than the predictions of the toy model of Haiman and Loebhaiman for X-ray selected high-redshift quasars. The handful of objects which are detected in the NIR but absent in are the most promising candidates for this type of object and, in some cases (e.g., object 19 in the soft sample) may be bright enough for follow-up with NIR spectroscopy to test the hypothesis.
Comparison with submillimeterbarger1 ; hughes ; gunn , far-infrared, and radio samples should allow us to determine what fraction of objects in these surveys are X-ray emitting AGN. As near-infrared spectra and photometric redshift estimates of the optically faint sources are established, we will be able to refine the obscured AGN models and determine whether any of the faint sources are indeed very high redshift quasars. With the X-ray, optical, and submillimeter samples all now approaching the full resolution of their respective backgrounds, we are close to achieving a complete cosmic census of the population of galaxies and AGN.
Acknowledgements
We thank J. Halpern and G. Hasinger for comments which greatly improved the first draft of this paper. We acknowledge E. Boldt for his many years of pioneering work concerning the X-ray background and R. Giacconi, whose insight and enthusiasm have inspired this subject. We thank the CXC, L. Van Speybroeck, M. Weisskopf and the MSFC team, M. Bautz, G. Garmire, and the ACIS team for building and operating such an excellent observatory. We acknowledge the use of HEASARC software. A.J. Barger acknowledges support from the Hubble and Chandra fellowship programs.
References
- (1) Giacconi, R., Gursky, H., Paolini, F., & Rossi, B. Evidence for X-rays from sources outside the Solar system. Phys. Rev. Lett. 9, 439–443 (1962).
- (2) Mather, J.C. et al. Measurement of the cosmic microwave background spectrum by the COBE FIRAS instrument. Astrophys. J. 420, 439–444 (1994).
- (3) Wright, E.L. et al. Interpretation of the COBE FIRAS CMBR spectrum. Astrophys. J. 420, 450–456 (1994).
- (4) Hasinger, G., Burg, R., Giacconi, R., Schmidt, M., Trümper, J., & Zamorani, G. The ROSAT Deep Survey. I. X-ray sources in the Lockman Field. Astron. Astrophys. 329, 482–494 (1998).
- (5) Schmidt, M. et al. The ROSAT deep survey. II. Optical identification, photometry and spectra of X-ray sources in the Lockman field. Astron. Astrophys. 329, 495–503 (1998).
- (6) Ueda, Y. et al. A population of faint galaxies that contribute to the cosmic X-ray background. Nature 391, 866–868 (1998).
- (7) Ueda, Y. et al. LOG N-LOG S relations and spectral properties of sources from the ASCA large sky survey: their implications for the origin of the cosmic X-ray background (CXB). Astrophys. J. 518, 656–671 (1999).
- (8) Ueda, Y., Takahashi, T., Ishisaki, Y., Ohashi, T., Makishima, K. The ASCA medium sensitivity survey (the GIS catalog project): source counts and evidence for emerging population of hard sources. Astrophys. J. 524, L11–L14 (1999).
- (9) Cagnoni, I., Della Ceca, R., Maccacaro, T. A Medium Survey of the Hard X-Ray Sky with the ASCA Gas Imaging Spectrometer: The ( keV) Number Counts Relationship. Astrophys. J. 493, 54–61 (1998).
- (10) Fiore, F., La Franca, F., Giommi, P., Elvis, M., Matt, G., Comastri, A., Molendi, S., & Gioia, I. The contribution of faint AGN to the hard X-ray background. Mon. Not. R. Astron. Soc. 306, L55–L60 (1999).
- (11) Weisskopf, M.C. The Chandra X-ray Observatory (CXO): an overview. In the proceedings of the NATO-ASI held in Crete, Greece (in the press); also as preprint astro-ph/9912097 at http:xxx.lanl.gov (1999).
- (12) Lilly, S.J., Cowie, L.L., & Gardner J.P. A deep imaging and spectroscopic survey of faint galaxies. Astrophys. J. 369, 79–105 (1991).
- (13) Songaila, A., Cowie, L.L., Hu, E.M., & Gardner J.P. The Hawaii K band Galaxy Survey III. Spectroscopy of galaxies. Astrophys. J. Suppl. Ser. 94, 461–515 (1994).
- (14) Windhorst, R.A. et al. Identification of faint radio sources with optically luminous interacting disk galaxies. Nature 365, 471–474 (1995).
- (15) Barger, A.J., Cowie, L.L., & Sanders, D.B. Resolving the submillimeter background. Astrophys. J. 518, L5–L8 (1999).
- (16) Piccinotti, G., Mushotzky, R.F., Boldt, E.A., Holt, S.S., Marshall, F.E., Serlemitsos, P.J., Shafer, R.A. A complete X-ray sample of the high-latitude () sky from HEAO 1 A-2: and luminosity functions. Astrophys. J. 253, 485–503 (1982).
- (17) Chen, L.-W., Fabian, A.C., & Gendreau, K.C. ASCA and ROSAT observations of the QSF3 field: the X-ray background in the keV band. Mon. Not. R. Astron. Soc. 285, 449–471 (1997).
- (18) Hasinger, G., Burg, R., Giacconi, R., Hartner, G., Schmidt, M., Trmper, J., & Zamorani, G. A deep X-ray survey in the Lockman Hole and the soft X-ray . Astron. Astrophys. 275, 1–15 (1993).
- (19) Murdoch, H.S., Crawford, D.F., & Jauncey, D.L. Maximum Likelihood estimation of the Number-Flux density distribution of radio sources in the presence of noise and comfusion. Astrophys. J. 183, 1–13 (1973).
- (20) Gendreau, K.C. et al. ASCA Observations of the Spectrum of the X-Ray Background. Publ. Astron. Soc. Jpn 47, L5–L9 (1995).
- (21) Marshall, F. et al. The diffuse X-ray background spectrum from 3 to 50 keV. Astron. J. 235, 4–10 (1980).
- (22) Vecchi, A., Molendi, S., Guainazzi, M., Fiore, F., & Parmar, A.N. The BeppoSAX 1-8 keV cosmic background spectrum. Astron. Astrophys. 349, L73–L76 (1999).
- (23) Cowie, L.L., Songaila, A., Hu, E.M., & Cohen, J.G. New insight on galaxy formation and evolution from Keck spectroscopy of the Hawaii Deep Fields. Astron. J. 112, 839–864 (1996).
- (24) Wilson, G., Cowie, L.L., Barger, A.J., & Burke, D.J. The evolution of the universal ultraviolet luminosity density with redshift. Astrophys. J. (submitted) (2000).
- (25) Miyaji, T. et al. The cosmic X-ray background spectrum observed with ROSAT and ASCA. Astron. Astrophys. 334, L13–L16 (1998).
- (26) Ishisaki, Y., Makishima, K., Takahashi, T., Ueda, Y., Ogasaka, Y., & Inoue, H. Astrophys. J. (submitted) (1999).
- (27) Almaini, O. et al. A deep ROSAT survey. XII. The X-ray spectra of faint ROSAT sources. Mon. Not. R. Astron. Soc. 282, 295–303 (1996).
- (28) Setti, G. & Woltjer, L. Active galactic nuclei and the spectrum of the X-ray background. Astron. Astrophys. 224, L21–L23 (1989).
- (29) Madau, P., Ghisellini, G., & Fabian, A.C. The unified Seyfert scheme and the origin of the cosmic X-ray background. Mon. Not. R. Astron. Soc. 270, L17–L21 (1994).
- (30) Matt, G. & Fabian, A.C. Spectral constraints on Seyfert 2 galaxies as major contributors to the hard (3–100 keV) X-ray background. Mon. Not. R. Astron. Soc. 267, 187–192 (1994).
- (31) Comastri, A., Setti, G., Zamorani, G., & Hasinger, G. The contribution of AGNs to the X-ray background. Astron. Astrophys. 296, 1–12 (1995).
- (32) Zdziarski, A.A., Johnson, W.N., Done, C., Smith, D., & McNaron-Brown, K. The average X-ray/gamma-ray spectra of Seyfert galaxies from GINGA and OSSE and the origin of the cosmic X-ray background. Astrophys. J. 438, L63–L66 (1995).
- (33) Smith, D.A. & Done, C. Unified theories of active galactic nuclei: a hard X-ray sample of Seyfert 2 galaxies. Mon. Not. R. Astron. Soc. 280, 355–377 (1996).
- (34) Gilli, R., Risaliti, G., & Salvati, M. Beyond the standard model for the cosmic X-ray background. Astron. Astrophys. 347, 424–433 (1999).
- (35) Schmidt, M., Giacconi, R., Hasinger, G., Trmper, J., & Zamorani, G. The X-ray luminosity function of active galactic nuclei. In Highlights in X-ray Astronomy. MPE report (in the press); also as preprint astro-ph/9908295 at http:xxx.lanl.gov (1999).
- (36) Miyaji, T., Hasinger, G., Schmidt, M. Soft X-ray AGN luminosity function from ROSAT surveys I. Astron. Astrophys. (in the press); also as preprint astro-ph/9910410 at http:xxx.lanl.gov (1999).
- (37) Moran, E.C., Helfand D.J., Becker R.H., & White, R.L. The Einstein two-sigma catalog: silver needles in the X-ray haystack. Astrophys. J. 461, 127-145 (1996).
- (38) Allen, S.W., Di Matteo, T., & Fabian, A.C. Hard X-ray emission from elliptical galaxies Mon. Not. R. Astron. Soc. (in the press); also as preprint astro-ph/9905052 at http:xxx.lanl.gov (1999).
- (39) Di Matteo, T. & Allen, S.W. Hard X-ray emission from elliptical galaxies and its contribution to the X-ray background. Astrophys. J. 527, L21–L24 (1999).
- (40) Haiman, Z. & Loeb, A. X-ray emission from the first quasars. Astrophys. J. 521, L9–L13 (1999).
- (41) Hughes, D.H., et al. High-redshift star formation in the Hubble Deep Field revealed by a submillimetre-wavelength survey. Nature 394, 241–247 (1998).
- (42) Barger, A.J., et al. Submillimetre-wavelength detection of dusty star-forming galaxies at high redshift. Nature 394, 248–251 (1998).
- (43) Gunn, K.F. & Shanks, T. Implications of an obscured AGN model for the X-ray background at submillimeter and far-infrared wavelengths. Mon. Not. R. Astron. Soc. (submitted); also as preprint astro-ph/9909089 at http:xxx.lanl.gov (1999).
Notes to Table 1 X-ray sources in the SSA13 field selected in the hard ( keV; S2 and S3 chips) or soft ( keV; S3 chip) bands. The X-ray images were prepared using xselect and associated ftools at GSFC. ACIS grades 0, 2, 3, 4, and 6 were used, and columns at the boundaries of the readout nodes were rejected. Counts lying within a diameter aperture were measured, together with the background in a radius annulus, at intervals along the field. The distribution of detected counts is Poisson. A cut of 17 counts in the hard S3 image and 10 counts in the other two images represents a probability threshold against background fluctuations and ensures a % probability of a single spurious source detection in the entire sample. The source counts were corrected for the enclosed energy fraction within the aperture. For the S3 chip the flux calibrations were made using an array of effective areas versus energy at 12 positions and an assumed power-law spectrum having counts-weighted mean photon indices ( keV) and ( keV). The galactic cm-2 is too low to affect the flux conversions. For the S2 chip a single conversion factor of erg cm-2 ct-1 was used. Using the on-axis flux calibrations of ( keV) and ( keV) to convert the S3 counts per second to flux, we determine limiting minimum fluxes of erg cm-2 s-1 ( keV) and erg cm-2 s-1 ( keV). The table is restricted to sources with off-axis angles , where % of the energy is enclosed within a radius, and to sources where the noise, computed from the variance of the background and signal, is less than one third the signal. The borders of each chip have incomplete exposure times due to the spacecraft dither so objects detected in these borders were not included in our counts analysis. The NIR and optical magnitudes are computed in radii intervals. is Kron-Cousins, is Johnson, is a broad filter centred at microns, and is a Å filter centred at Å. Lower limits are .
Notes to Table 2 The statistical errors on our observed sky brightnesses dominate the systematic errors, which are expected to be less than 10 per cent. To be consistent with Hasinger et al.hasinger , we converted our soft band sky brightness of erg cm-2 s-1 deg-2 to the keV range using the measured mean photon index. This result was then compared with the keV background (where galactic contamination is less than at lower energies) of erg cm-2 s-1 deg-2 from Gendreau et al.gendreau , using a fit to ASCA data, and Chen et al.chen , using a fit to joint ASCA/ROSAT data. In the hard band the summed counts are compared with the keV background of erg cm-2 s-1 deg-2 from Marshall et al.marshall , using a fit to HEAO1 A2 data, and Vecchi et al.vecchi , using a fit to BeppoSAX data.
| # | RA(2000) | Dec(2000) | (2–10 keV) | (0.5–2 keV) | ||||||||||
|---|---|---|---|---|---|---|---|---|---|---|---|---|---|---|
| ( cgs) | ( cgs) | |||||||||||||
| 0S2S2Detected in the S2 chip. | 13 | 12 | 43.38 | 42 | 44 | 36.73 | 20.13 | 24.60 | ||||||
| 1bbSignificant detection in both samples. | 13 | 12 | 40.24 | 42 | 39 | 35.55 | 0.93 | 24.43 | 25.19 | |||||
| 2S2S2Detected in the S2 chip. | 13 | 12 | 39.62 | 42 | 45 | 48.77 | 24.36 | |||||||
| 3S2S2Detected in the S2 chip. | 13 | 12 | 39.50 | 42 | 42 | 48.83 | 17.08 | 19.89 | 0.111 | |||||
| 4ssS3 source detected only in soft band sample. | 13 | 12 | 37.94 | 42 | 40 | 5.53 | 0.45 | 24.10 | ||||||
| 5S2S2Detected in the S2 chip. | 13 | 12 | 37.16 | 42 | 43 | 21.08 | ||||||||
| 6bbSignificant detection in both samples. | 13 | 12 | 36.86 | 42 | 38 | 44.55 | 0.28 | |||||||
| 7bbSignificant detection in both samples. | 13 | 12 | 36.58 | 42 | 40 | 2.80 | 1.54 | |||||||
| 8hhS3 source detected only in hard band sample. | 13 | 12 | 36.00 | 42 | 40 | 44.11 | 23.94 | 25.40 | ||||||
| 9b,S3eb,S3efootnotemark: | 13 | 12 | 35.68 | 42 | 41 | 50.67 | 0.90 | 20.91 | 22.95 | 23.40 | 1.320 | |||
| 10S2S2Detected in the S2 chip. | 13 | 12 | 34.48 | 42 | 43 | 9.27 | 16.38 | 19.26 | 23.22 | 24.19 | 0.241 | |||
| 11ssS3 source detected only in soft band sample. | 13 | 12 | 32.36 | 42 | 39 | 49.39 | 1.38 | 20.16 | 24.37 | 25.82 | ||||
| 12hhS3 source detected only in hard band sample. | 13 | 12 | 31.34 | 42 | 39 | 2.19 | 18.02 | 20.54 | 23.37 | 23.76 | 0.586 | |||
| 13ssS3 source detected only in soft band sample. | 13 | 12 | 30.83 | 42 | 39 | 42.73 | 2.12 | 19.75 | 23.94 | 25.80 | 25.36 | |||
| 14ssS3 source detected only in soft band sample. | 13 | 12 | 29.26 | 42 | 37 | 32.33 | 2.09 | 16.04 | 18.39 | 20.91 | 21.35 | 0.234 | ||
| 15S2S2Detected in the S2 chip. | 13 | 12 | 28.25 | 42 | 44 | 54.52 | 21.64 | 24.41 | 25.33 | |||||
| 16bbSignificant detection in both samples. | 13 | 12 | 26.00 | 42 | 37 | 35.86 | 1.43 | 19.73 | 22.67 | 24.53 | 25.14 | |||
| 17ssS3 source detected only in soft band sample. | 13 | 12 | 25.29 | 42 | 41 | 19.53 | 1.45 | 21.68 | 26.93 | |||||
| 18S2eS2eIn the S2 excluded border. | 13 | 12 | 22.48 | 42 | 44 | 49.97 | 20.73 | 24.98 | 26.26 | |||||
| 19bbSignificant detection in both samples. | 13 | 12 | 22.32 | 42 | 38 | 13.89 | 1.80 | 17.80 | 19.84 | 21.53 | 22.23 | 2.565qqQuasar spectrum. | ||
| 20ssS3 source detected only in soft band sample. | 13 | 12 | 21.63 | 42 | 35 | 49.97 | 1.65 | 25.06 | ||||||
| 21ssS3 source detected only in soft band sample. | 13 | 12 | 21.50 | 42 | 44 | 5.41 | 1.60 | 19.23 | 22.06 | 23.36 | 23.98 | 1.305qqQuasar spectrum. | ||
| 22bbSignificant detection in both samples. | 13 | 12 | 20.11 | 42 | 42 | 22.42 | 1.53 | 24.14 | 25.75 | |||||
| 23ssS3 source detected only in soft band sample. | 13 | 12 | 19.19 | 42 | 38 | 8.36 | 0.62 | 24.56 | 26.72 | |||||
| 24bbSignificant detection in both samples. | 13 | 12 | 15.32 | 42 | 39 | 0.22 | 1.75 | 16.18 | 17.92 | 18.66 | 19.00 | 2.565qqQuasar spectrum. | ||
| 25ssS3 source detected only in soft band sample. | 13 | 12 | 11.72 | 42 | 44 | 12.59 | 2.16 | 18.65 | 20.70 | 22.22 | 22.27 | 0.950qqQuasar spectrum. | ||
| 26bbSignificant detection in both samples. | 13 | 12 | 10.02 | 42 | 41 | 29.94 | 0.76 | 16.74 | 19.47 | 22.50 | 24.15 | 0.212 | ||
| 27ssS3 source detected only in soft band sample. | 13 | 12 | 9.93 | 42 | 36 | 15.30 | 1.72 | 19.66 | 23.50 | 27.32 | ||||
| 28ssS3 source detected only in soft band sample. | 13 | 12 | 8.38 | 42 | 41 | 43.08 | 2.88 | 20.39 | 23.24 | 25.64 | ||||
| 29bbSignificant detection in both samples. | 13 | 12 | 6.55 | 42 | 41 | 41.31 | 0.05 | 17.80 | 20.50 | 23.66 | 24.82 | 0.696 | ||
| 30hhS3 source detected only in hard band sample. | 13 | 12 | 6.55 | 42 | 41 | 25.16 | 15.22 | 17.47 | 20.52 | 22.31 | 0.180 | |||
| 31ssS3 source detected only in soft band sample. | 13 | 12 | 5.18 | 42 | 41 | 23.45 | 1.62 | 21.16 | 28.02 | |||||
| 32hhS3 source detected only in hard band sample. | 13 | 12 | 4.18 | 42 | 41 | 13.59 | 22.39 | |||||||
| 33ssS3 source detected only in soft band sample. | 13 | 12 | 1.23 | 42 | 42 | 7.78 | 2.60 | 21.08 | 23.65 | 26.67 | 3.405qqQuasar spectrum. | |||
| 34ssS3 source detected only in soft band sample. | 13 | 11 | 59.66 | 42 | 41 | 52.89 | 0.53 | 26.21 | ||||||
| 35bbSignificant detection in both samples. | 13 | 11 | 59.36 | 42 | 39 | 28.17 | 1.01 | 23.04 | ||||||
| 36ssS3 source detected only in soft band sample. | 13 | 11 | 59.19 | 42 | 38 | 34.12 | 0.93 | 27.29 | ||||||
| Energy range | Flux range | Source Contribution | Percentage | Reference |
|---|---|---|---|---|
| (keV) | (erg cm-2 s-1) | (erg cm-2 s-1 deg-2) | of XRB11The range given is a combination of the uncertainty in the source contribution (from the third column) and the variation in the published sky flux. | |
| Hasinger et al.hasinger | ||||
| present paper | ||||
| Ueda et al.ueda1 | ||||
| present paper |