Spirals and the size of the disk in EX Dra
Abstract
Observations at high spectral and temporal resolution are presented of the dwarf nova EX Dra in outburst. The disk seen in the He i line reconstructed by Doppler tomography shows a clear two-armed spiral pattern pointing to spiral shocks in the disk. The Balmer and He ii maps also give evidence for the presence of spirals. The eclipse as seen in the red continuum indicates a disk radius of 0.31 times the orbital separation, which might be large enough to explain the observed spiral shocks through excitation by the tidal field of the secondary. The eclipse in the Balmer line profiles, well resolved in our observations, indicates a somewhat smaller disk size (0.25). We discuss the possibility that this is related to an optical depth effect in the lines.
Key Words.:
accretion disks – hydrodynamics – Cataclysmic Variables – stars: EX Dra1 Introduction
Spiral shocks in accretion disks have been predicted from numerical simulations (Sawada et al. 1986, 1987, Różyczka & Spruit 1993, Yukawa et al. 1997), and analytic considerations (Spruit 1987, Spruit et al. 1987, Larson 1990). They are excited by the tidal field of the secondary if the disk extends far enough into the Roche lobe and can result in two prominent spiral arms. If shock dissipation is the main mechanism damping the wave, it extends over the entire disk and causes accretion at an effective -value of (Spruit 1987, Larson 1990, Godon 1997).
The first observational evidence for shock waves in accretion disks of cataclysmic variables (CVs) was the detection of a clear two-armed structure in the disk of IP Peg during rise to outburst (Steeghs et al. 1997). The spiral pattern, interpreted as evidence for shock waves, has also been seen during outburst maximum (Harlaftis et al. 1999) and early decline of outburst (Morales-Rueda et al. 2000).
At the temperatures expected from dwarf nova disks models, whether in outburst or in quiescence, the predicted spirals are tightly wound and would be hard to detect observationally (Bunk et al. 1990), so that their presence in the observations is somewhat unexpected. Spirals this strong are most naturally explained if the disk temporarily extends rather far into the primary Roche lobe, so that the tidal force of the secondary causes a strong disturbance. A strong non-axisymmetric disturbance, however, would also cause the gas to loose angular momentum quickly (transfered to the secondary), so that the disk would shrink to a smaller radius where the tidal force is weaker. Spirals in disks of CVs would then be understandable if they are a temporary phenomenon, perhaps restricted to outbursts. To test this, more observations of different systems at sufficient spectral resolution and signal-to-noise are needed (Steeghs & Stehle 1999).
With high quality spectroscopic studies of different CVs it should also be possible to answer the question if spiral shocks in CV accretion disks are a common phenomenon. Systems suitable for this purpose would be bright and have frequent outbursts, such as SS Cyg and EX Dra.
EX Dra is a double–eclipsing dwarf nova with a 5-hour orbit (Barwig et al. 1993, Billington et al. 1996, system parameters by Fiedler et al. 1997). There is suggestive evidence for asymmetric structures in the He i Doppler map reconstructed from outburst data taken in 1993 (Joergens et al. 2000). From eclipse maps obtained at various stages in the outburst cycle Baptista & Catalan (1999) claim that spiral waves form at the early stages of an outburst. We report in this paper on observations at high spectral and temporal resolution during an outburst in 1996.
2 Observations and reduction
EX Dra was observed on the nights of July 27 and 28 1996, with the ISIS spectrograph on the 4.2 m William Herschel Telescope. The red ISIS arm was equipped with the TEK 5 CCD, the blue arm with TEK 1 CCD, covering the wavelength ranges 6375-6778 Å and 4585-4993 Å respectively, at a dispersion of 0.4 Å/pixel. The spectra were observed during seeing of 1.4 – 1.7 arc sec, using an exposure time of 60s. The spectra were optimally-extracted, including the elimination of cosmic ray hits but not the correction of Pixel-to-pixel variations of the detector sensitivity. Slit losses due to variable atmospheric conditions were corrected using a faint comparison star on the slit. The red spectra, but not the blue spectra, were flux calibrated.
Our spectra were taken roughly in the middle of an outburst. Photometric observation at the Wendelstein observatory showed that the system was already in outburst on 26 July, and in quiescence on 4 August (Barwig, private comm.). VSNET (1998) records show that the system was in quiescence on 24 July and in outburst one day later and in quiescence again on 1 August. The outburst therefore started on 25 August, three days before our observations.
3 Interpretation of the Doppler maps
Doppler maps were computed from the phase-folded spectra of 28 July, using the IDL-based fast-maximum entropy package described by Spruit (1998)111available at http:www.mpa-garching.mpg.de/henk. For further details on Doppler tomography see Marsh & Horne (1988). The eclipsed part of the data (phases -0.12 to 0.12) has been excluded from the reconstruction process, and does not affect the maps produced. For information, however, these parts of the data are included in the spectra shown in Fig. 1. They were used separately to derive disk sizes in the lines and the continuum.
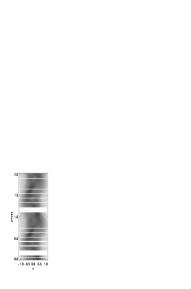
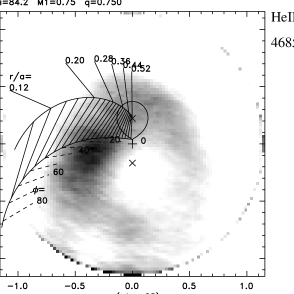
Fig. 1 shows the results for the four strongest lines in the spectra, Hα, Hβ, He i and He ii . The phase-folded spectra are shown in the left column, the corresponding Doppler maps in the right and in the middle the spectra reconstructed from the maps. The theoretical trajectory of the mass transfering stream has been plotted in the He ii image, together with the Keplerian velocity along the stream path (cp. Marsh & Horne 1988). Bars connecting the two arcs indicate correspondence in physical space, and are annotated with radius r/a and the azimuth relative to the primary. The system parameters and the ephemeris are from Fiedler et al. (1997).
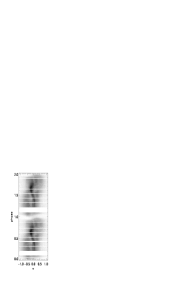

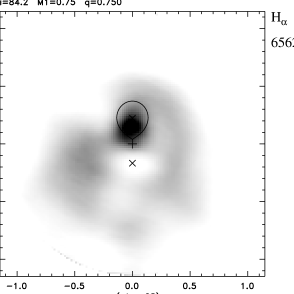


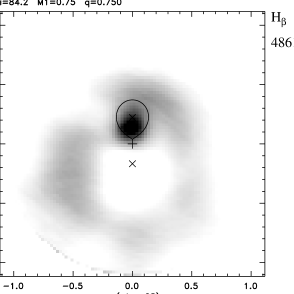

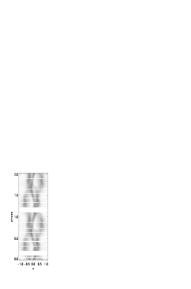
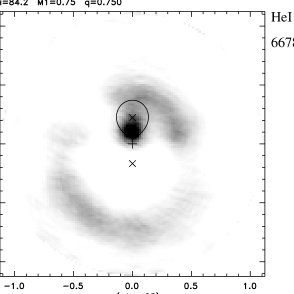

The He i image shows the spirals clearest: asymmetric disk emission is concentrated in two arms in the first and third quadrant. We interpret this deviation from a Keplerian disk as indication of the presence of spiral shock waves in the accretion disk. The image looks quite similar to the He i map of IP Peg published by Steeghs et al. (1997). As in the case of IP Peg, the arms do not follow a circle centered on the white dwarf, but are somewhat elongated along the Vy-axis. This is the pattern expected from spiral shocks (Steeghs & Stehle 1999). The asymmetry of the spirals in the EX Dra disk is smaller than in the IP Peg observations (Steeghs et al. 1997, Harlaftis et al. 1999, Morales-Rueda et al. 2000), perhaps indicating that the shocks are weaker. The spiral arm in the upper right is stronger in intensity as well as in asymmetry than that one in the lower left. This pattern is also seen in the Doppler maps of IP Peg. As in the case of IP Peg, the Balmer lines show similar, but less clearly defined structures.
The Doppler images, with the exception of He ii, show strong emission from the secondary star, also visible during the outburst in 1993 (Joergens et al. 2000). This indicates heating of the secondary by radiation from the inner disk. The temperatures are obviously not high enough to excite the He ii line. The He ii line also differs from the other lines by the presence of a prominent emission patch at the theoretical gas stream trajectory. The center of this hot spot emission is somewhat below the trajectory, consistent with quiescence observations of EX Dra (Billington et al. 1996, Joergens et al. 2000).
4 The disk radius
The large width of the He ii line is as expected for a high excitation line produced near the center of a disk in outburst. The eclipse of the He ii line is visible in the spectrum up to a velocity of about 1500 km/s. The orbital velocity at the disk edge is about 4.3 times lower than this. Assuming Keplerian rotation, the disk region eclipsed at 1500 km/s is about 20 times smaller in radius than the outer radius of the disk. At our phase resolution, the 1500 km/s emission is thus point-like, and can be used to measure the width of the secondary’s shadow on the orbital plane, . From the position of the hot spot in the He ii map, we can estimate a disk size of .
The eclipse of the Balmer and He i lines shows that the blue disk emission reappears (at Vkm/s) at the same phase as the last red emission disappears, within the measurement uncertainty. The size of the disk as seen in these lines is thus, by a coincidence, nearly as wide as the occulting shadow of the secondary. Hence the disk radius as seen in the Balmer lines is .
We can compare this with the disk size as measured from the eclipse in the continuum. The light curve in the continuum between 6400 and 6500Å, extracted from our spectra, is shown in Fig. 2. The width of the eclipse is orbits. With , this implies a disk radius .
Fiedler et al. (1997) find a value of 0.11 for the eclipse width of the white dwarf, from analysis of a mean blue light curve in quiescence. The disk as seen in the continuum thus appears to be larger in outburst than in quiescence, as expected. The eclipse width values of 0.17 in outburst and 0.11 in quiescence are also compatible with the eclipse light curves of Baptista & Catalan (1999). These authors measured the eclipses of EX Dra at various stages in the outburst cycle.

5 Discussion and conclusions
We find evidence for spiral structures in the outburst accretion disk of EX Dra similar to those found in IP Peg by Steeghs et al. (1997). The pattern of intensity and velocity perturbations agrees with that predicted from numerical simulations of spiral shock waves (Steeghs & Stehle 1999). It is best seen in the He i line, somewhat less clearly in the Balmer and He ii lines. In EX Dra the pattern appears somewhat less clearly and asymmetric than in IP Peg.
In particular, it is less clear in the He ii line, suggesting lower temperatures and shock strengths of the spirals of EX Dra. Possibly the observability of spirals in the He ii map is hampered by strong hot spot emission visible in this line.
We derive a disk radius of from the red continuum eclipse light curve. From numerical simulations, Steeghs & Stehle find that disk sizes are needed to excite spirals that are strong enough to generate an observable pattern in the spectra. (Transformation from to is given by R for q=0.75, cp. Plavec & Kratochvil 1964.) Since the tidal force is a very steep function of , the spirals rapidly become weak at smaller disk sizes. The disk size we find here in EX Dra is at the lower limit of the required size.
Further evidence for the size of the disk in EX Dra in outburst was obtained by Baptista & Catalan (1999). Radial intensity distributions presented there show disk radii of 0.30 in quiescence and 0.49 in outburst. The authors see hints of spirals in their eclipse maps, during the early outburst stages. This may be compared with the observations presented here, which show spirals and a disk size of 0.31 three days after the beginning of an outburst.
The eclipses of the Balmer lines in our spectra yield significantly smaller disks sizes than the continuum eclipse, . Since it is known that the line emission is produced primarily in the outer parts of the disk (e.g. Rutten et al. 1994), one might have expected the disk as seen in the lines to be larger, if anything, than in the continuum.
A possible resolution of this conflict may lie in the optical depth effects affecting the emission lines in systems seen at high inclination. The low central intensity of the Balmer lines in high-inclination CVs (often below the continuum) shows that such effects are strong. As shown by Horne & Marsh (1986), the effects are strongest for lines of sight parallel and perpendicular to the orbital motion, leading to reduced line emission from these directions compared to intermediate lines of sight (near to the orbit). The bias towards intermediate angles will give the appearance of a somewhat smaller disk size. It is still to be determined if this suggestion also works quantitatively.
Acknowledgements.
We thank Dr. Heinz Barwig for providing the photometric information on EX Dra. We thank the anonymous referee for the comments, which helped to improve the presentation of the data and to correct an error. This work was done in the context of the research network ‘Accretion onto black holes, compact objects and protostars’ (TMR Grant ERB-FMRX-CT98-0195). The Isaac Newton Telescope is operated on the island of La Palma by the Isaac Newton Group of Telescopes in the Spanish Observatorio del Roque de los Muchachos of the Instituto de Astrofisica de Canarias.References
- (1) Baptista R., Catalan M.S., 1999, astro-ph/9905096
- (2) Barwig H., Fiedler H., Reimers D., Bade N., 1993, in: Compact Stars in Binary Systems, eds. H. van Woerden, Abstracts of IAU Symp. 165, p. 89
- (3) Billington I., Marsh T.R., Dhillon V.S., 1996, MNRAS 278, 673
- (4) Bunk, W., Verbunt, F.; Livio, M., 1990, A&A 232, 371
- (5) Fiedler H., Barwig H., Mantel K.H., 1997 A&A, 327, 173
- (6) Godon P., 1997, ApJ 480, 329
- (7) Harlaftis E. T., Steeghs D., Horne K., Martin E., Magazzu A., 1999, MNRAS 306, 348
- (8) Horne K., Marsh T., 1986, MNRAS 218, 761
- (9) Joergens V., Mantel K.H., Barwig H., Bärnbantner O., Fiedler H., 2000 A&A, in press
- (10) Larson R.B., 1990, MNRAS 243, 588
- (11) Marsh T., Horne K., 1988, MNRAS 235, 269
- (12) Morales-Rueda L., Marsh T. R., Billington I., 2000, MNRAS, in press
- (13) Plavec M., Kratochvil P., 1964, Bulletin of the Astronomical Institute of Czechoslovakia 15, 165
- (14) Różyczka M., Spruit H.C.,1993, ApJ 417, 677
- (15) Rutten R.G.M, Dhillon V.S., Horne K., Kuulkers E., 1994, A&A 283, 441
- (16) Sawada, K., Matsuda, T., Hachisu, I., 1986, MNRAS 219, 75
- (17) Sawada, K., Matsuda, T., Inoue M., Hachisu, I., 1987, MNRAS, 224, 307
- (18) Spruit H.C., 1987, A&A 184, 173
- (19) Spruit H.C., 1998, astro-ph/9806141
- (20) Spruit H.C., Matsuda T., Inoue M. and Sawada K., 1987, MNRAS 229, 517
- (21) Steeghs D., Harlaftis E.T., Horne K., 1997 MNRAS 290, 28, erratum in 1998 MNRAS 296, 463
- (22) Steeghs D., Horne K., Stehle R., Harlaftis E.T., 1998, AAS 193, 520
- (23) Steeghs D., Stehle R., 1999, MNRAS 307, 99
- (24) Yukawa H., Boffin H. M. J., Matsuda T., 1997, MNRAS 292, 321
- (25) VSNET, 1998, http://www.kusastro.kyoto-u.ac.jp/vsnet