The hard X-ray properties of the Seyfert nucleus in NGC 1365
Abstract
We present BeppoSAX observations of the Seyfert 1.8 galaxy NGC1365 in the 0.1–100 keV range. The source was 6 times brighter than during an ASCA observation 3 years earlier. The 4–10 keV flux is highly variable during the BeppoSAX observation, while the soft (0.1-4 keV) emission is constant within the errors. Both a cold and a warm reflector and a cold absorber are required to explain the observed spectrum. The comparison between ASCA and BeppoSAX spectra strongly suggests that the circumnuclear material has a more complex structure than a simple homogeneous torus, with quite different absorbing gas columns along different lines of sight. A broad iron Kα line is also present in the spectrum, with the peak energy significantly redshifted. This can be explained by means of a relativistic disk line model. Alternatively, a warm absorption Fe line system with N cm-2 could account for the observed line profile.
Key Words.:
Galaxies: individual: NGC 1365 – Galaxies: active – Galaxies: Seyfert – X-rays: galaxies1 Introduction.
NGC 1365 is a barred spiral galaxy (Hubble type SB0) in the Fornax cluster that hosts an active nucleus whose optical spectrum shows weak broad Balmer lines (Seyfert 1.8, Alloin et al. 1981)
In this paper we present the analysis of the spectrum of NGC 1365 in the 0.1-100 keV spectral range obtained with the BeppoSAX satellite (Boella et al. 1997).
During the past ten years NGC 1365 has been observed several times in the X-rays by ASCA (Iyomoto et al. 1997, hereafter I97) ROSAT (Komossa & Schulz 1998) and Ginga (Awaki 1991). The 1-10 keV continuum spectrum observed by ASCA in August 1994 and January 1995 (I97) is well reproduced by a flat powerlaw (photon index =0.8) and a thermal soft component. A strong emission feature is present at E6.4–7 keV, which can be fitted by a single broad emission line with E=6.58 keV and equivalent width EW=2.1 keV or, alternatively, by two narrow lines with E=6.4 keV (neutral iron, EW=0.9 keV) and E=6.7 keV (highly ionized iron, EW=0.9 keV). Both these spectral features and the lack of (short term) variability suggested that the ASCA spectrum is dominated by a cold reflection component which is usually observed in most of the heavily absorbed, Compton thick sources (Maiolino et al. 1998, hereafter M98) and generally ascribed to the reflection from the molecular torus expected by the unified model of AGNs (Antonucci 1993).
The ASCA–SIS and ROSAT–HRI data, obtained in 1994 and 1995, reveal also the presence of a strong off-nuclear X-ray source characterized by a steep powerlaw spectrum (photon index =1.7 in the 1-10 keV band) and by a strong variability on time-scales of months; during the ASCA observation in 1995 this source was as bright as the Seyfert 2 nucleus with a flux of 0.9 erg cm -2 s-1. The spatial resolution of the BeppoSAX instruments does not allow to separate the contribution of this source from that of the nucleus. We will discuss the possible contamination from this off-nuclear source further in Sect. 2.
In the next section we present the results of the spectral and temporal analysis of our data. In Sect. 3 we discuss the BeppoSAX data and their differences with respect to the previous X-ray observations. We assume a distance of 18.4 Mpc for NGC 1365, as estimated by Fabbiano et al. (1992), and in agreement with more recent Cepheid measurement (Madore et al. 1998).
2 Data analysis
NGC 1365 was observed by SAX in August 1997. The effective on–source integration time was 8900 seconds for the LECS instrument (0.1-10 keV), 30000 seconds for the MECS (1.65-10.5 keV) and 14000 seconds for the PDS (15-200 keV). The spectrum and the light curve of the LECS and MECS were obtained from the “event files” provided by the BeppoSAX SDC, using the standard software for X-ray analysis FTOOLS 4.0. The PDS spectrum was obtained by the FOT files of the SAX observation, using the XAS code, a software developed specifically for the reduction and analysis of the SAX data.
We adopted the standard data reduction for the BeppoSAX spectra
as described, for instance, in M98.
The final spectrum was rebinned to contain at least 20 counts/bin, so that
a gaussian statistics can be used to fit
the models to the data.
2.1 Spectral analysis
The beam-size of the PDS ( FWHM) includes also the Seyfert 2 galaxy NGC1386, also observed by BeppoSAX (M98), that should contribute significantly to the 20–100 keV flux measured for NGC1365 (probably up to 50%). This problem, along with other effects observed in the light curve (Sect.2.2), prevent us from using the PDS data to constrain the spectral properties of the source.
The best fit to the LECS and MECS data is obtained by means of a multi-component model typical of Compton-thin sources (see M98 for details). The continuum emission is well reproduced by a powerlaw of photon index =1.93 (which is typical for Seyfert 1 spectra), a photoelectric cut-off, corresponding to a column density of cold absorbing material N cm-2, and a second powerlaw that fits the soft excess which may be due to extended components (starburst or hot gas in the Narrow Line Region) or to the X-ray source resolved by ASCA and ROSAT. The whole spectrum is also absorbed by a Galactic column density of cm-2. If the extended contribution is dominant, we would expect that a Raymond–Smith model also fits well the soft data. Unfortunately the statistics of our data in the soft band is not high enough to discriminate between a powerlaw and a thermal spectrum: a Raymond-Smith model with kT gives a slightly worse fit () than the powerlaw, but still in agreement at a 90% confidence level.
In addition to these continuum components, a narrow emission line with E=6.257 keV111E=6.29 keV rest frame. is strongly requested by the fit (=18). Note that the line width parameter was not frozen to zero, therefore the narrowness of the line is a result of the fit. The line equivalent width is EW=330 eV with respect to the observed continuum (EW=190 eV with respect to the unabsorbed powerlaw component). Finally, with a second line at E=6.95 keV222E=7.0 rest frame. (corresponding to H-like iron) the fit is better at a level of confidence higher than 90% ( =2.9). We note that the energy of the cold line is significantly lower than the value of the neutral iron Kα line, which is E=6.365 keV, when corrected for the redshift (the best fit with the line energy frozen at E=6.365 is worse by =3.5). This issue will be discussed further in Sect. 3.
The results of our fit are summarized in Table 1 and shown in Fig. 1.
The fit of the low–state spectrum is not statistically good (
for 38 degrees of freedom), but this is due to the lower
signal–to–noise of the data. As shown in Fig. 1, there
are no significant continuum features that are not well fitted, while
the high
is due to the large scatter of the points in the
2-4 keV and 8-10 keV bands.

Parameter Best-fit value Total Spectrum Powerlaw 1 1.93 Powerlaw 1 norm. 7.4 Ph. cm-2 s-1 keV-1 NH 4.0 cm-2 Powerlaw 2 2.46 Powerlaw 2 norm. 2 6.8 Ph. cm-2 s-1 keV-1 Gaussian 1 Energy 6.257 keV Gaussian 1 norm. 3.4 Ph. cm-2 s-1 keV-1 Gaussian 1 EW 330 eV Gaussian 2 Energy 6.95 keV (fixed) Gaussian 2 norm. 1.4 Ph. cm-2 s-1 keV-1 Gaussian 2 EW 120 eV Flux 2-10 keV 6.6 keV cm-2 s-1 /d.o.f. 67/67 Low state Normalization 1 5.8 Ph. cm-2 s-1 Flux 2-10 keV 5.0 keV cm-2 s-1 /d.o.f. 47/38 High state Normalization 1 1.0 Ph. cm-2 s-1 Flux 2-10 keV 8.2 keV cm-2 s-1 /d.o.f. 51.7/55

2.2 Timing analysis
The flux measured by BeppoSAX in the 2–10 keV band is 6.6 erg cm-2 s-1, about 6 times higher than the flux measured by ASCA in 1994–1995, but similar to the flux of 4.8 erg cm-2 s-1 measured by Ginga during manouvering operations prior to 1990 (Awaki 1991).
The light curve of NGC 1365, obtained from the MECS data (1.65-10.5 keV), is plotted in Fig. 2. The count rate varies by a factor of 2 during our observation. There is an indication of periodicity with period T 45000 s, but longer observations are required to test this hypothesis.
In Fig. 2 we also plot the low and high energy part of the light curve separately. These two curves clearly show that the observed variability is mostly due to the high energy part of the spectrum, while the emission in the soft part of the spectrum is roughly constant333 This is also supported by the timing analysis of the LECS data: in this case the statistics is lower than in the MECS data, however the light curve is constant within the errors, likewise to the low–energy light curve of the MECS.. Comparing these results with the spectral model in Table 1, we can conclude that the variability is due to the direct emission (above the photoelectric cutoff) from the central source, while the reflected or diffuse component (or the off-nuclear component) does not appear to vary.
We extracted two spectra from our MECS and PDS data, by selecting the time intervals in which the count rate in the 2-10 keV band is respectively higher and lower than the average. The measured fluxes in the 2-10 keV band are 8.2 erg cm-2 s-1 in the high state and 5.0 erg cm-2 s-1 in the low state. The LECS and MECS spectra ( 1-10 keV) of the high- and low-state spectra can be fitted by using the same model used for the total spectrum and by accounting for the variability with a variation of the normalization of the transmitted powerlaw (i.e. the one dominating above 4 keV), i.e. by ascribing the observed flux changes to intrinsic variability of the nuclear source. The results of these two fits are summarized in Table 1 and in Fig. 3.

The light curve of the PDS behaves differently. The variations in the 15–35 keV band are anticorrelated with the variations in the 4–10 keV (MECS) spectral band (Fig. 3). There are two possible explanations for this anti-correlation. The Compton, cold reflection is most effective at keV, therefore the anticorrelation could reflect a real delay between the innermost primary source and the cold reprocessing material. However, this scenario would require a 30 keV reflection efficiency of at least 60% that is very high, although not completely ruled out by models, depending on the geometry of the reflector (eg. Ghisellini et al. 1994). Alternatively, the observed variability at 30 keV could be ascribed to the other Sy2 (NGC1386) in the PDS beam. These two interpretations are also supported by an analysis of Fig. 3, in which the models are obtained by fitting the MECS data only. The extrapolation of these models at higher energies fall short to account for the PDS data, in agreement with the hypothesis of a contamination by an extra source or by a delayed, reflected component.
The fact that the softer part of the spectrum is almost constant indicates that the off-nuclear source does not contribute to the observed variability. Indeed, the spectrum of the latter source is an unabsorbed power law (Komossa & Schulz 1998) and, therefore, its contribution to the variability should be significant in the soft band (1.65-4 keV) too, in contrast to what observed. The strength of the variability (the luminosity varied by 1.3 erg s-1) also indicates that the contribution of the off–nuclear source is marginal. The highest known state of this source is that observed by ASCA in 1995, when the total luminosity in the 2-10 keV band was erg s-1, that was already an exceptional value for a non-nuclear galactic source. Moreover, the measured flux of the soft component is at the same level of that measured by ASCA. Therefore, from both the spectral and time analysis we can reasonably assume that the emission of the off-nuclear source during our observation was not significantly higher than during the ASCA observation.
3 Discussion
When comparing our BeppoSAX (1997) data with the past ASCA (1994-95) data there are differences that are not trivial to explain.
a) In 1994 the spectrum of NGC 1365 was dominated by a (cold) reflected component. The measured 2-10 keV flux was 1.1 erg cm-2 s-1. In 1997 we find a variable, direct component, absorbed by a column density N cm-2, whose 2-10 keV flux is 6.6 erg cm-2 s-1, i.e. 6 times higher than in 1994.
b) In the ASCA spectrum two iron emission lines are present, one at E=6.4 keV (cold) and one at E=6.7 keV (warm). In the SAX spectrum we also find evidence for a cold and a warm (E=7 keV) component of the iron line, but the flux of the cold component is three times higher than in 1994, while the warm component remains constant within the statistical errors.
c) The energy of the cold iron line in the SAX spectrum (6.29 keV rest frame)
is lower than the expected value (6.4 keV).
As a consequence, the energy of the cold line in the SAX spectrum
is also lower than the cold (fainter) line observed in 1994, that is
consistent with 6.4 keV.
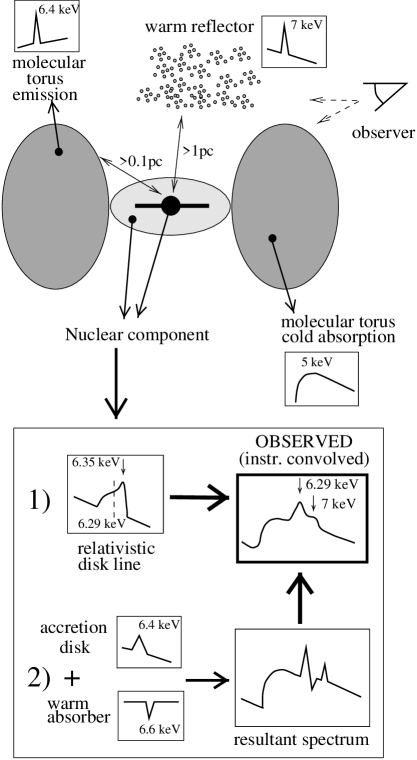
The model we propose to explain these data is based on a multi-component absorber/reflector, composed by a warm, ionized component in the sub-parsec scale, a cold molecular torus and another warm diffuse component outside the torus. Fig. 4 schematically shows the various components of the model along with their contribution to the observed spectrum. In the following we discuss in detail each of these components and spectral features.
3.1 The cold absorber
A cold absorbing medium is requested to explain the photoelectric cutoff in the SAX spectrum, that is commonly observed in most obscured Seyfert galaxies (Bassani et al. 1999). This medium is generally identified with the obscuring molecular torus expected by the unified model (Antonucci 1993).
3.2 The cold iron line
The cold iron line at 6.4 keV is thought to be emitted by the accretion disk and, in part, by the circumnuclear torus predicted by the unified model (see eg. Ghisellini et al. 1994 and Matt et al. 1991). There are two possible explanations for the observed redshift of the iron line to 6.29 keV in the BeppoSAX spectrum of NGC 1365: a relativistic redshift (if the line is produced in the inner part of an accretion disk) or a resonant absorption line at E6.6 keV that shifts the center of the 6.4 keV line. We discuss in some detail each of these two models in the following.
- Model 1.
-
We fitted the emission line with the standard DISKLINE model in the Xspec 10.0 code for spectral analysis. In this model the redshifted profile is due to the general relativistic effects and the Doppler broadening. All the parameters of the model (the inner and outer radius of the disk and the inclination angle) were left free, except for the line energy, which was frozen to E=6.365 keV (i.e. 6.4 keV rest frame). Details of the line fit are given in Table 2a. The other parameters of the model are the same as in Table 1, and their best fit values are equal, within the errors, to those in Table 1. The fit with the relativistic disk line is worse than the one shown in Table 1, though it is still acceptable ().
We note that the fit requires an angle between the disk axis and the line of sight lower than 30 degrees (at the 90% confidence level), i.e. a disk oriented face-on. This geometry is not favored by the unified schemes, since this object is characterized by an obscured nucleus (inferred both from the optical spectrum and from the X-ray absorption) and, therefore, the torus and the accretion disk are expected to be oriented edge-on. However, a warped disk could solve this inconsistency.
- Model 2.
-
We now discuss the alternative model of the warm absorption Fe line. A warm absorber in the central region of an AGN has been observed in several Seyfert 1 galaxies with a column density as high as several 1023 cm-2 (eg. Komossa & Greiner 1999). If this absorber is in an ionization state between Fe XXIV and Fe XIV then the resonant Kα transition can be both in emission and in absorption at E6.5–6.7 keV. Matt (1994) predicts a Fe Kα resonant absorption line of EW of 20-30 eV for an ionized absorber with N cm-2, temperature T K, and a non-isotropic spatial distribution around the central source. The equivalent width can be larger if the temperature is higher (T=107 K is an acceptable value for the region around the accretion disk) and if the velocity dispersion of the warm absorber is high, so that the broadening of the absorption line prevents its saturation. For example, following Matt (1994), if we assume T=107 K and a turbulence of 500 km s-1 the EW of the absorption line can be 100 eV. The combination of the cold emission line and the warm absorption line, convolved at the spectral resolution of BeppoSAX, could result in an emission line whose center is apparently redshifted (Fig. 4). A more quantitative description of this model is given in the Appendix and in Table 2b.
Parameter Best-fit value a) Relativistic line model Line energy 6.365 (fixed) Disk inner radius R Disk outer radius unconstrained Inclination angle 18.4 deg Line EW 400 eV /d.o.f. 69/67 b) Absorption line model Emission line Energy 6.365 keV (fixed) Emission line EW 400 eV Absorption line Energy 6.63 keV Absorption line EW 80 eV (fixed) /d.o.f. 66.3/68
3.3 The long term variability
As outlined above, the X-ray emission and spectrum of NGC 1365 is very different in the two observations performed by ASCA and BeppoSAX. This behavior is reminiscent of another well known case of similar long term variation, i.e. NGC 4051 (Guainazzi et al. 1998).
The differences between the ASCA (1994) and SAX (1997) spectra, and in particular the flux variation, can be explained in two scenarios: 1) a Compton thick cloud (i.e. with N cm-2) obscured the nucleus in 1994 by passing through our line of sight, thus making the 2–10 keV spectrum reflection dominated; alternatively 2) the intrinsic emission of the active nucleus might have been quiescent (or much reduced) in that period. The latter case would be indistinguishable from the pure-reflection scenario, because of the spectral similarity between a reflection spectrum and a Compton-thin spectrum with N cm-2 when the signal-to-noise is low (M98), as it is the case for the ASCA spectrum. Moreover, in case 2) the observed emission could be composed both by a direct and a reflected component. Also, it is unlikely that the direct emission dominates, because a) in this case some variability on short time scales would be expected, while the ASCA light curve is constant within the errors (I97); and b) the high equivalent width of the iron lines implies an highly efficient reflection.
We cannot easily distinguish between hypothesis 1) and 2), because both cases predict a reflection dominated spectrum, which depends only on the structure of the reflecting medium. However, a very interesting result, regardless of which of the two models applies, is that in both scenarios a high reflection efficiency is required: the ASCA 2-10 keV flux is 5.2% of the SAX NH–corrected flux, that is near to the maximum possible reflection efficiency, according to theoretical models (Ghisellini et al. 1994). According to these models the reflection efficiency is strongly dependent on the column density of the reflecting material, and is negligible for N cm-2. We therefore conclude that the reflection is not due to the same obscuring medium responsible for the photoelectric cutoff observed in the SAX spectrum that, according to our fits, has a column density (Ncm-2) much lower than what required to provide an efficient Compton reflection. There are two simple models that could explain this discrepancy:
-
•
the torus could be composed by a large number of thick clouds and diffuse gas with lower density and relatively low column density. Assuming this geometry the reflection efficiency could be high, and the SAX observation could have been performed when none of the thick clouds was intersecting our line of sight. However we note that in this scenario the covering factor of the clouds must be high, in order to make the reflection efficiency high enough. On the other hand, NGC 1365 was in a Compton thin state in two out of the three past observations (the Ginga and BeppoSAX ones), suggesting that the covering factor of the thick clouds cannot be too high.
-
•
Alternatively, the obscuring torus might be characterized by a stratified structure, with a column density in excess of cm-2 on the equatorial plane and much lower on the edge, the latter being along our line of sight. This possibility is in agreement with some models that ascribe the intermediate Seyfert classification to orientation effects.
Finally, we note that the presence of a warm absorber in the central region of the nucleus, speculated in Sect.3.2, could also provide an explanation to the low–flux spectrum measured by ASCA alternative to those discussed above: a change in ionization state of the warm absorber could introduce a much higher absorption that, henceforth, could be responsible for the lower flux observed in the ASCA data. Indeed, if the warm absorber is located close to the central source, as required by our model, a decrease of the intrinsic luminosity could be followed, with a short time delay, by a decrease of the ionization state of the absorber and, as a consequence, by an increase of the absorption. However, this effect is unlikely to provide all the additional column density required from the ASCA data, basically for two reasons: 1) the NH required ( cm-2) is much higher than any previous measurement of warm absorbers (as stated also in the Appendix, typical values of NH for warm absorbers are several 1022 cm-2, with a few cases of measured N cm-2); 2)if a warm absorber with N cm-2 is present, we expect to detect a deep iron absorption edge in the BeppoSAX spectrum, that is not observed. The maximum warm NH for which the iron edge is not detectable over the noise (in excess to the Fe edge due to the cold absorber) is a few 1023 cm-2.
3.4 The cold mirrors
Whatever is the reason of the lower flux during the ASCA observation, the comparison of the iron emission lines in the SAX and ASCA spectra provides interesting constraints on the geometry and on the efficiency of the reprocessing/ reflecting material. The flux of the cold iron line in 1997 (SAX) is three times higher than in 1994 (ASCA), confirming that the iron line is produced both by the obscuring torus and by the reflection on the accretion disk: when the nuclear source is active (or visible) both components are detected, while when the nucleus is inactive (or obscured) only the component reflected by the torus is detected. If we assume that in 1994 the nucleus was in a low state (that is the most likely scenario, as discussed above) then we can constrain the size of the torus that produces one-third of the cold iron line, by taking advantage of reverberation limits. We do not have information about the period when the nucleus first faded before the ASCA observation. However, the ASCA observation was obtained in two parts separated by 6 months and the two spectra are nearly identical, this constrains the size of the cold reflecting torus to be larger than 6 light-months, i.e. pc, in agreement with other independent estimates (Antonucci 1993, Gallimore et al. 1997, Greenhill & Gwinn 1997).
3.5 The warm mirror
The warm iron line in AGNs is thought to be emitted by the circumnuclear hot gas that is responsible for the reflection of the (polarized) broad lines, i.e. the so-called warm mirror (Matt et al. 1996). To check if the discrepancy between the warm line energies in the BeppoSAX and ASCA spectra is statistically significant, we retrieved and analized the ASCA data from the ASCA public archive. We found that the best fit energy of the warm line is E=6.85 keV (rest frame), and E=7 keV is still acceptable (). The line fluxes are also compatible within the errors. This analysis suggests that the warm ionized reflector that produces this line has not changed its state between tha ASCA (1994) and BeppoSAX (1997) observations, and therefore should be located at a distance larger than 3 light years from the nucleus.
Note that the warm reflector is physically distinct from the warm absorber responsible for the putative iron absorption system discussed in Sect. 3.1, both because of the different ionization properties and different size. As discussed in Sect. 3.1, the warm absorber must have a ionization state between FeXIV and FeXXIV, while the warm mirror emits a line at 7 keV that corresponds to FeXXV. Moreover, the ionized absorber must be located in the vicinity of the black hole (around the accretion disk?) so that turbulent velocity can broaden the absorption line preventing its saturation, while the warm reflector must be located on scales larger than 1 pc, as discussed above.
3.6 The short term variability
As discussed in Sect. 2.2, the emission observed by BeppoSAX is strongly variable in the 4-10 keV band. The light curve is very well fitted by a sinusoid with a period of seconds. Even though our observation is too short to justify any claim of periodicity, recent studies on the periodicity of the Seyfert nucleus in IRAS 18325-5926 (Iwasawa et al. 1998) make this subject very interesting. Anyway, no conclusion can be drawn without longer observations.
4 Conclusions
We presented new BeppoSAX data in the 0.1–100 keV range of the Seyfert 1.8 galaxy NGC1365. The spectrum is characterized by a continuum absorbed by a cold gaseous column density of cm-2 and an iron K emission complex that is well fitted by a cold component at 6.29 keV and a warm component at 7 keV (rest frame). At energies below the absorption cutoff (E 4 keV) a soft excess is present.
The cold absorption is probably due to the obscuring torus predicted by unified model of AGNs. The continuum is strongly variable during the BeppoSAX observation. The variability is mostly due to the hard component of the spectrum above the photoelectric cutoff (4–10 keV), while the soft component (1.65–4 keV) is essentially constant. The rapid variability very likely reflects variations of the central engine. Instead, the soft excess is probably due to an extended component, either associated to starburst activity or to hot gas in the Narrow Line Region.
The BeppoSAX spectrum is 6 times brighter than during two ASCA observations of NGC 1365 taken about 3 years earlier. The latter spectra were characterized by a flat continuum, indicative of cold Compton reflection, very likely from the circumnuclear torus.
The high reflection efficiency, deduced from the comparison of the ASCA and BeppoSAX spectra, requires a column density of the reflector much higher than that measured in absorption. We conclude that the circumnuclear medium is strongly inhomogeneous: the torus could contain Compton thick clouds or, alternatively, has a steep density gradient from the edge to the equatorial regions.
The fading of the direct emission during the ASCA observations can be explained in two ways: the central engine was hidden by a Compton thick cloud or, most probably, the nucleus was in an intrinsically low state. In the latter scenario, the temporal behavior of the cold and the warm iron lines indicate that the cold reflecting torus must be located at a distance larger than 0.15 pc, while the warm mirror must be located at a distance larger than 1 pc. Both the circumnuclear torus and the accretion disk contribute to the emission of the cold Fe line, in a proportion of about 1:2 respectively.
The cold iron line is significantly redshifted with respect to its nominal value. More specifically we measure a line peak (rest frame) of 6.29 keV, that is inconsistent with the nominal value of 6.4 keV at a significance level higher than 99%. A disk relativistic line can fit the observed profile, though the fit is worse than the analytical fit. Also, according to this fit the accretion disk must be oriented face on, that is an improbable geometry for an absorbed AGN like NGC 1365. Alternatively, we propose that the shift of the cold iron line is caused by a warm absorber, along the line of sight (with cm-2), that introduces an absorption Fe line at 6.5–6.7 keV: the combination of the cold emission line and the warm absorption line, convolved with the spectral resolution of BeppoSAX, results in an emission line whose center is apparently shifted at 6.29 keV. The spectral fit of the data with this second model is significantly better with respect to the relativistic disk line.
Acknowledgements.
We thank the anonymous referee for useful comments. G.R. and R.M. acknowledge the partial financial support from the Italian Space Agency (ASI) through the grant ARS–99–15 and from the Italian Ministry for University and Research (MURST) through the grant Cofin98-02-32.Appendix A Details on the warm absorber model for the iron line redshift
In this Appendix we discuss more in detail the spectral fit and the implications of the model of the warm iron absorption to explain the redshift of the cold iron line described in Sect. 3.3 (model 2).
We fit our BeppoSAX data with a model whose components are the same as in Table 1, except for the “cold” iron line at E=6.257 keV that was replaced with a narrow line with energy frozen at 6.365 keV (6.4 keV rest frame) and a narrow absorption line with EW=80 eV and E6.6 keV. Details of the fit are given in Table 2b. The best fit with this model is better than in the case of the relativistic line model at high statistical confidence (=2.7 with one additional degree of freedom). Unfortunately, the statistics is not high enough to study the low and the high state separately in the framework of this model and, in particular, variations of the absorption line between the low–state and the high–state: in both cases the best fit value for the iron emission line energy is lower than the canonical one, but the shift is significant only at a level and therefore the absorption line cannot be well constrained.
The redshift of the Fe line could be simply due to random fluctuations (the signal-to-noise in our spectrum is not very high). To check this possibility we performed a simulation by means of the XSPEC 10 code by using a very high integration time and with the same parameters as above (without absorption). After convolving with the response matrix of the MECS instrument, we fitted the simulated spectrum with a single gaussian (in emission). The best fit of the resulting spectrum is a gaussian at E=6.3 keV and EW=190 keV, in agreement with what observed in NGC 1365 (after correction for the continuum cold absorption), thus confirming that the combination of the emission and the absorption lines results in a redshifted observed lines and that the effect is not due to the limited signal-to-noise.
Summarizing, a possible scenario to explain the Fe line profile in the BeppoSAX spectrum is that a broad iron emission line is formed at the surface of the central accretion disk (similarly to what is observed in several Sy1s) and then it is partially absorbed by a warm circumnuclear gas that causes an apparent redshift of the cold line centroid.
As discussed above, for the absorption system to be effective in redshifting the centroid of the cold emission line the column density of the warm absorber must be cm-2 or higher. Although observed in some Sy1s, typically warm absorbers have column densities significantly lower (Reynolds 1997). Possibly, as illustrated in Fig. 4, the warm absorber is preferentially distributed in the equatorial plane of the torus/disk system and, as a consequence, the edge–on lines of sight (as it is probably the case for NGC1365) are characterized by higher column densities of the warm gas.
The warm absorption model is favored both because it fits better the observed data and because the relativistic line model requires a geometry that is improbable for this object. However, the relativistic line model cannot be rejected.
References
- (1) Alloin D., Edmunds M.G., Lindblad P.O., Pagel B.E.J., 1981, A&A 191, 377
- (2) Antonucci R.R.J., 1993, ARA&A 31, 473
- (3) Awaki H., Nagoya University, PH D thesis
- (4) Bassani L., Dadina M., Maiolino R., et al., 1999, ApJS, 121, 473
- (5) Boella G., Butler R. C., Perola G. C., et al., 1997, A&AS 122, 299
- (6) Fabbiano G., Kim D.W., Trincheri G., 1992, ApJS 80,531
- (7) Gallimore J.F., Baum S.A., O’Dea C.P., 1997, Nat 388, 852
- (8) Ghisellini G., Haardt F., Matt G., 1994, MNRAS 267, 743
- (9) Greenhill L.J., Gwinn C.R., 1997, Ap&SS 248, 261
- (10) Guainazzi M., Nicastro F., Fiore F., et al., 1998, MNRAS 301 L1
- (11) Iwasawa K., Fabian A. C., Brandt W. N., et al., 1998, MNRAS 295, L25
- (12) Iyomoto N., Makishima K., Fukazawa Y., et al., 1997, PASJ 48, 425 (I97)
- (13) Komossa S., Greiner J., 1999, Proceedings of “High Energy Processes in Accreting Black Holes”, J. Poutanen, R. Svensson (eds), ASP Conf. Ser., 228. (astro-ph 9810105)
- (14) Komossa S., Schulz H., 1998, A&A 339, 345.
- (15) Madore B. F., Freedman W. L., Silbermann N., et al., 1998, Nat 395, 47
- (16) Maiolino R., Salvati M., Bassani L., et al., 1998, A&A 338, 781 (M98)
- (17) Matt G., 1994, MNRAS 267, L17
- (18) Matt G., Perola G. C., Piro L., 1991, A&A 247, 25
- (19) Matt G., Brandt W. N., Fabian A.C. 1996, MNRAS 280, 823
- (20) Reynolds C.S., 1997, MNRAS, 286, 513
- (21)