A spatially resolved plerionic X-ray nebula around PSR B054069
Abstract
We present a high resolution Chandra X-ray observation of PSR B054069, the Crab-like 50 msec pulsar in the Large Magellanic Cloud. We use phase-resolved imaging to decompose the extended X-ray emission, as expected of a synchrotron nebula, from the point-like emission of the pulsar. The image of the pulsed X-ray emission shows a well-defined point-spread function of the observation, while the resolved nebula has a morphology and size remarkably similar to the Crab nebula, including evidence for a jet-like feature from PSR B054069. The patchy outer shell, which most likely represents the expanding blast-wave of the supernova, is reminiscent of that seen in radio. Based on morphology, size, and energetics there can be little doubt that SNR B054069 is an analogous system to the Crab but located in our neighboring galaxy.
Subject headings:
pulsars: general — pulsars: individual (PSR B054069) — X-rays: general — supernova remnant — stars: neutron1. Introduction
The X-ray-bright 50 ms pulsar PSR B054069 was discovered in the N158A nebula of the Large Magellanic Cloud (LMC) and has long been compared to the Crab pulsar (Seward, Harnden, & Helfand 1984). Based on its timing and spectral properties, the two rotation powered pulsars are very similar with a spin period of 50 vs. 33 ms and a spin-down rate of vs. s/s for PSR B054069 and the Crab, respectively. From these quantities, assuming the standard magnetic dipole pulsar model, one can infer a characteristic age (1.7 vs. 1.2 kyr), spin-down energy ( vs. ergs s-1), and surface magnetic field strength ( vs. G) for PSR B054069 and the Crab, respectively. This similarity suggests that PSR B054069 could be accompanied by a “plerion”, a pulsar driven wind nebula (Weiler & Sramek 1988), reminiscent of that seen for the Crab.
Indeed, there are several lines of evidence indicating the presence of a plerion in the vicinity of PSR B054069. Chanan, Helfand, & Reynolds (1984) detected a polarized optical nebula of half-power diameter around the pulsar. This apparent synchrotron nebula was also resolved (though barely) in a radio image presented by Manchester et al. (1993) and in a ROSAT high resolution imager observation by Seward & Harnden (1994). Furthermore, the overall X-ray spectrum of PSR B054069 and its remnant (SNR B054069) is well characterized by a power law, as expected if the emission is predominantly non-thermal (Clark et al. 1982; Wang & Gotthelf 1998a).
The ROSAT observation also revealed a faint X-ray emitting shell, pc in size surrounding the pulsar. This shell contributes less than to the total luminosity of in the ROSAT 0.1-2 keV band and is likely the SNR associated with the pulsar (Seward & Harden 1994). However, no evidence has yet been found for a similar X-ray-emitting shell or a shell-like SNR around the Crab (e.g. see discussion in Jones et al. 1998).
In this Letter, we report new results on SNR B054069 based on a recent observation acquired with the Chandra High Resolution Camera. This observation enables us for the first time to distinguish morphological details of the nebula around PSR B054069. We analyze phase dependent images and resolve the expected plerion-like nebula from the point-like pulsar emission. This allows us to identify features similar to those seen from the Crab nebula; we present morphological evidence for a torus of X-ray emission, which most likely represents shocked pulsar wind materials and a likely X-ray jet emanating from the pulsar. We discuss the implications of the results in the context of the pulsar-nebula system. Throughout the paper we adopt a distance of kpc for the LMC.
2. Observation
The Chandra observatory (Weisskopf et al. 1996) observed SNR B054069 on Aug 31 1999 as part of the initial calibration of the High Resolution Camera (HRC; Murray et al. 1997). A total of 19.4 ksec of data were collected during a portion of the orbit which avoided regions of high background contamination such as from bright Earth and radiation belt passages. The remnant was centered on the on-axis position of the HRC where the point-spread function (PSF) has a half power radius (the radius enclosing 50% of total source counts) of . Time-tagged photons were acquired with 15.6 s precision, and the arrival times were corrected to the solar system barycenter using a beta version of AXBARY available from the Chandra X-ray Center FTP site (A. Rots 1999, private communication). While the detector is sensitive to X-rays over a keV range, there is essentially no energy information available. We analyzed event data calibrated by the initial processing and dated 1999 September 12, which was made available through the Chandra public archive. In addition to the standard processing, the event data was further filtered to reduce the instrumental background and to remove “ghost image” artifacts using a beta version of HRC_SCREEN (S. Murray 2000, private communication). We extracted pixel images centered on the pulsar rebinned by a factor of two from the native HRC pixel size of 013175 per side.
3. Results
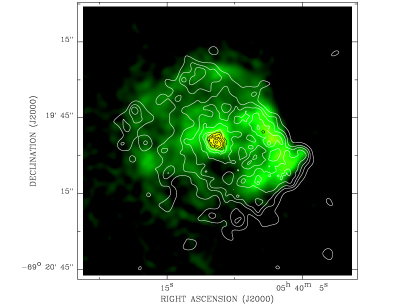
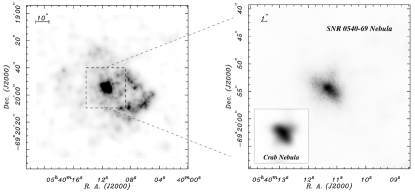
A global view of N158A and its environment as seen by the Chandra HRC is shown in Figure (contours) and Figure (greyscale). The large-scale X-ray enhancement on scales up to is the previously resolved shell-like emission (Seward & Harnden 1994). In fact, the X-ray and radio emission together outlines a nearly circular morphology around PSR B054069. Clearly, the shell represents the blastwave of SNR B054069. The X-ray intensity distribution within the remnant appears rather patchy. While the southwest X-ray enhancement is a good tracer of the radio and optical emission peaks, there is no general correlation between fainter radio and X-ray features.
The superb spatial resolution of the Chandra observation further allows for a close-up of the immediate vicinity of PSR B054069 (Fig. ). The presence of a diffuse plerion-like nebula around the pulsar is apparent. To decompose the nebula emission from the pulsar contribution, we conducted phase-resolved image analysis. This enables us to estimate the local PSF based on the pulsed, point-like emission from the pulsar and to quantify the extended, unpulsed nebula radiation.
First, we must determine the pulse period at the current epoch. We constructed a periodigram around a narrow range of periods centered on the expected period ms, sampled in increments of , were is the observation duration, and is the test period. For each trial period, we folded photons extracted from a 10 aperture centered on the bootstrapped pulsar position (see below) into 20 phase bins and computed the of the resultant profile. We find a highly significant signal () at ms at Epoch 51421.630741 MJD; the uncertainty is estimated according to the method of Leahy (1987). We have assumed a period derivative of for the data epoch (Deeter et al. 1999). In Figure we display the resultant light-curve folded at the peak period which, as expected, is roughly sinusoidal and modulated with a pulse fraction (defined as the amplitude divided by the mean).
Next, we defined two regions in the phase space, on- and off-pulse, by selecting eight adjacent phase bins corresponding to the peak and trough of the pulse profile. The on-pulse image with the off-pulse image subtracted is presented in Figure . This image reproduced the expected PSF with no evidence of asymmetric deviations, as might be caused by poor aspect reconstruction, like that typically found for ROSAT images. Figure presents average radial intensity distributions around the centroid of the point-like source.
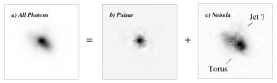
By subtracting the normalized pulsar image (Fig. ), we are able to construct an image of the nebula emission (Fig. ) alone. The subtracted image is scaled to compensated for both the relative phase coverage and for a 21% unpulsed emission contribution, estimated by minimize a pointlike contribution at the pulsar position of the nebula image. As shown in Figure , the extended emission is distinctly different from the pointlike image of the pulsed emission from the pulsar. The primarily feature is the NE-SW elongated feature, which is morphologically symmetric relative to the pulsar and extends about on both sides of the pulsar. However, the observed emission on the SW side appears twice as strong compared to the NE side, with an average intensity of . Because the central core of the distribution is significantly brighter than the extended features and the subtraction of the pulsar contribution is somewhat arbitrary, the exact intensity distribution is uncertain.
There is also marginal evidence for a jet-like feature emanating from the pulsar. This emission, most apparent in the NW and extending about , is nearly perpendicular to the NE-SW elongated nebula and is slightly bent toward North. The integrated emission of the jet-like feature is roughly . The configuration of the jet feature relative to the nebula is remarkably similar to that of the Crab nebula as seen by ROSAT and which is now clearly resolved with Chandra (see Chandra publicity photo).
In short, the X-ray emission can be decomposed into three major morphological components: a point-like source, the surrounding nebula which shows evidence for a jet feature, and a patchy supernova remnant shell.
| Componenta | Count Rateb | Size and Shape |
|---|---|---|
| Pulsarc | ||
| pulsed | 0.14 | point-like |
| unpulsed | 0.18 | ” |
| Nebula | 0.8 | NE-SW |
| Jet | 0.03 | long SE-NW |
| SNR Shell | 0.2 | diameter |
4. Discussions
A comparison between the X-ray-emitting nebula around PSR B054069 and the Crab nebula (see Chandra publicity photo111Available at http://xrtpub.harvard.edu/photo/0052/0052_hand.html) is very informative. The Crab nebula image shows a torus of X-ray-emitting loops, which most likely represents shocked pulsar wind materials consisting of magnetic waves and ultra-relativistic particles. Also clear are the two jets of X-ray-emitting material emanating from the Crab pulsar, in the direction perpendicular to the major axis of the torus. We speculate that the nebula around PSR B054069 has a similar structure. In fact, at the spatial resolution of Chandra at the LMC, the size, morphology, and surface intensity of the two nebulae are all remarkably similar (Fig. ).
Assuming a power law spectrum for the X-ray emission from the SNR B054069 nebula of photon index 2.0 and N (Finley et al. 1993, Wang & Gotthelf 1998a), the conversion between the count rate and the energy flux in the standard 1.0-10 keV band is . The corresponding total luminosity of the nebula is , which is 13% of the spin-down energy of PSR B054069. The fraction is again similar to that of the Crab.
N157B (PSR J05376910) is the only other LMC SNR with a detected pulsar (16 ms) and also shows both an extended (resolved by ROSAT HRI), non-thermal nebula and a partial X-ray-emitting shell (Wang & Gotthelf 1998a; 1998b). The upcoming Chandra observations will make a detailed comparison between these two young Crab-like SNRs possible.
References
- (1) Caraveo, P., Mignani, R., & Bignami, G. B. 1998, in Memorie della Societa Astronomia Italiana, Vol. 69, p.1061
- (2) Chanan, G. A., Helfand, D. J., & Reynolds, S. P. 1984 ApJ, 287, L23
- (3) Clark, D. H., Tuohy, I. R., Dopita, M. A., Mathewson, D. S., Long, K. S., Szymkowiak, A. E., Culhane, J. L. 1982, ApJ, 255, 440
- (4) Deeter, J. E., Nagase, F., Boynton, P. E. 1999, ApJ, 512, 300
- (5) Finley, J. P., Oegelman, H., Hasinger, G., Truemper, J. 1993 ApJ, 410, 323
- (6) Jones, T. W. et al. 1998, PASP, 110, 125
- (7) Leahy, D. A., 1987, A&A, 180, 275
- (8) Manchester, R. N., Staveley-Smith, & Kesteven, M. J. 1993, ApJ, 411, 756
- (9) Murray, S. S., et al., 1997, SPIE, 3114, 11
- (10) Seward, F., D., Harnden, Jr., F. R., & Helfand, D. J. 1984 ApJ, 287, L19
- (11) Seward, F. D., & Harnden, Jr., F. R. 1994, ApJ, 421, 581
- (12) Wang, Q. D. & Gotthelf, E. V. 1998a, ApJ, 494, 623.
- (13) Wang, Q. D. & Gotthelf, E. V. 1998b, ApJL, 509, 109
- (14) Weisskopf, M. C. O’Dell, S. L., van Speybroeck, L. P. 1996, Proc. SPIE 2805, Multilayer and Gazing Incidence X-ray/EUV Optics III, 2.
- (15) Weiler, K. W. & Sramek, R. A. 1988, ARAA, 25, 295
- (16)