The NASA Astrophysics Data System: Overview
Abstract
The NASA Astrophysics Data System Abstract Service has become a key component of astronomical research. It provides bibliographic information daily, or near daily, to a majority of astronomical researchers worldwide.
We describe the history of the development of the system and its current status. Urania (Boyce (1996)), and the ADS role in the emerging electronic astronomical data environment are discussed. Astronomy is unique in that it already has a fully functional data resource, where several of the most important data sources exist on-line and inter-operate nearly seamlessly. The ADS and the Strasbourg Data Center (CDS; Genova et al. (1998)) form the core of this resource.
We show several examples of how to use the ADS, and we show how ADS use has increased as a function of time. Currently it is still increasing exponentially, with a doubling time for number of queries of 17 months.
Using the ADS logs we make the first detailed model of how scientific journals are read as a function of time since publication. We find four distinct components. We directly compare the readership rate with the citation rate for scientific articles as a function of age. Citations generally follow reads, but there are some differences.
The main journals of astronomy have differences in the ways they are read and cited. We discuss these from a number of different aspects.
The impact of the ADS on astronomy can be calculated after making some simple assumptions. We find that the ADS increases the efficiency of astronomical research by 333 Full Time Equivalent (2000 hour) research years per year, and that the value of the early development of the ADS for astronomy, compared with waiting for mature technologies to be adopted, is 2332 FTE research years.
A full technical description of the ADS is in three companion articles: Eichhorn, et al. (1999), Accomazzi, et al., (1999), and Grant, et al. (1999). The ADS is available at http://adswww.harvard.edu/.
Key Words.:
methods: data analysis – databases: misc – publications: bibliography – sociology of astronomy1 Introduction
The NASA Astrophysics Data System Abstract Service (hereafter ADS, except in section 2) is now a central facility of bibliographic research in astronomy. In a typical month (March 1999) it is used by more than 20,000 individuals, who make 580,000 queries, retrieve 10,000,000 bibliographic entries, read 400,000 abstracts and 110,000 articles, consisting of 1,100,000 pages. The ADS is a key element in the emerging digital information resource for astronomy, which has been dubbed Urania (Boyce (1996)). The ADS is tightly interconnected with the major journals of astronomy, and the major data centers.
The present paper serves as an introduction to the system, a description of its history, current status, use, capabilities, and goals. Detailed descriptions of the ADS system are in the companion papers: The design and use of the search engine is in Eichhorn, et al. (1999); hereafter SEARCH. The architecture, indexing system, and mirror maintenance is in Accomazzi, et al., (1999); hereafter ARCHITECTURE. Finally the methods we use to maintain and update the data base, and to maintain communication with our collaborating data centers and journals (primarily via bibcodes, Schmitz et al. (1995)) is in Grant, et al. (1999); hereafter DATA.
In section 2 we discuss the history of the ADS, paying particular note of the persons and events which were most important to its development. Section 3 briefly discusses the current status of the system, the data it contains, and the hardware, software, and organizational methods we use to maintain and distribute these data. Urania, and especially the ADS role in it, is discussed in section 4. The current capabilities and use of the system are shown in section 5; with section 5.1 showing example queries, and section 5.2 showing how ADS use has changed over time. In section 6 we show how current use varies as a function of the age of an article and the journal it was published in; in 6.1 we develop a multi-component model which accurately describes the whole pattern of article use as a function of age; in 6.2 we compare the similarities and differences of readership information with citation histories; in 6.3 we examine several aspects of the readership pattern for the major journals. Finally, in 7, we estimate the impact of the ADS on astronomy.
2 Historical Introduction
The ADS Abstract Service had its beginnings at the conference Astronomy from Large Data-bases, held in Garching in 1987. There Adorf & Busch (1988) discussed the desirability of building a natural language interface to a set of astronomical abstracts (Astronomy and Astrophysics Abstracts (A&AA) was the model) using software from Information Access Systems, Inc. (IAS; E. Busch was the president of IAS). Watson (1988) discussed the existing abstract services. At this meeting G. Shaw (who was representing IAS) saw the paper by Kurtz (1988), and noticed that the vector space classification methods developed by M. J. Kurtz for the numerical classification of stellar spectra were very similar to those developed by P. G. Ossorio (1966) for the classification (and thus natural language indexing) of text. Ossorio’s methods were the basis of the proposal by Adorf & Busch (1988); Ossorio was the founder of IAS. Shaw suggested Ossorio and Kurtz meet. Also at this conference Squibb & Cheung (1988) presented the NASA plan for an astrophysics data system, and Shaw met G. Squibb.
This meeting of Kurtz and Ossorio took place in January 1988, in Boulder, CO. By the end of the meeting it was clear that the technical difficulties involved in creating an abstract service with a natural language index could be overcome, if the data could become available. A preliminary mathematical solution to the problem was developed, under the assumption that A&AA would be the source of the abstracts. This technique was later called the “statistical Factor Space”, factor analysis being one of the tools used to create the vector space.
Over the next year NASA moved to implement the Squibb & Cheung (1988) plan for the establishment of a network based, distributed system for access and management of NASA astrophysics data holdings, the Astrophysics Data System. Shaw and Ossorio founded a new company, Ellery Systems, Inc., which obtained the systems integration contract for the ADS. During this time Shaw, Ossorio, Kurtz, and S.S. Murray all spoke often about the abstract service as an integral part of the emerging ADS system, and the abstract service, and Factor Space, became nearly synonymous with the ADS project. No actual work was done to implement the abstract service during this time, Ossorio and Kurtz worked on applying their vector space classification techniques to galaxy morphologies (Ossorio & Kurtz (1989), Kurtz, Mussio & Ossorio (1990)), while Murray used the original, non-statistical, Factor Space methods of Ossorio (1966) to build a small (40 documents) natural language indexing system for demonstration purposes.
During the next three years the ADS was built (Good (1992)), but without a literature retrieval service, which was listed as a future development. No NASA funds were devoted to the abstract service during this time. Independently Kurtz and Watson set out to obtain the data necessary to build a prototype system; keyword data was received from the IAU (International Astronomical Union) Thesaurus project (Shobbrook & Shobbrook (1992), Shobbrook & Shobbrook (1993)), and from the NASA Scientific and Technical Information (STI) branch (Pinelli (1990)). A breakthrough occurred in mid 1990 when the Astronomische Rechen Institut graciously provided Watson with magnetic tape copies of the two 1989 volumes of Astronomy and Astrophysics Abstracts. By the end of 1990 Kurtz (1991, 1992) had built a prototype abstract retrieval system, based on the statistical Factor Space.
In April, 1991 F. Giovane and C. Pilachowski organized a meeting near Washington, D.C. on “On-Line Literature in Astronomy.” At this meeting Boyce (1991) discussed the desire of the American Astronomical Society (AAS) to publish on-line journals, Kurtz (1991) discussed the prototype system, and pointed out the types of queries which would be made possible if a natural language abstract system were combined with the Strasbourg Data Centers’s (CDS) SIMBAD (Egret & Wenger (1988)) database and with the Institute for Scientific Information’s Science Citation Index (Garfield (1979)), and van Steenberg (1991) discussed the desire of the National Space Science Data Center (NSSDC) to create a database of scanned bitmaps of journal articles. Also at this meeting were representatives of NASA’s STI branch, who indicated that they would be willing to provide the abstracts from the STI (often called NASA RECON) abstracts database (Wente (1990)).
Near the end of the meeting Murray (1991) outlined the possibilities inherent in the previous talks. He described a networked data system where a natural language query system for the STI abstracts would work jointly with the CDS/SIMBAD object name index to point astronomers to relevant abstracts, article bitmaps, and electronic journal articles. Save that the World Wide Web (Berners-Lee (1994)) has taken the place of the proprietary network software created for the ADS project by Ellery Systems Inc., and that the ADS has taken over responsibility for the bitmaps from the NSSDC, the current system is essentially identical to the one predicted by Murray (1991).
Following the meeting the NSSDC group (Warnock et al. (1993)) organized the STELAR project, which held a series of meetings where many of the issues involved in electronic journals were discussed, and a consensus was reached on allowed uses of copyrighted journal article bitmaps.
In the spring of 1992 Murray took over the direct management of the ADS project; G. Eichhorn was hired as project manager. The decision was made to proceed forthwith with the development of an abstract service based on the STI abstracts. Because the STI abstract system is differently structured than the A&AA system the statistical Factor Space was abandoned in favor of a more traditional entropy matching technique (Salton and McGill (1983), see SEARCH).
The new system was working with a static database by fall, and was shown at the Astronomical Data Analysis Software and Systems II meeting in Boston (Kurtz et al. (1993)). The production system was released in February 1993, as part of the package of ADS services, still part of the proprietary ADS network system. Abstract Service use quickly became more than half of all ADS use.
By summer 1993 a connection had been made between the ADS and SIMBAD, permitting users to combine natural language subject matter queries with astronomical object name queries (Grant, Kurtz & Eichhorn (1994)). This connection was enabled by the use of the bibcode (see DATA). We believe this is the first time an internet connection was made to permit the routine, simultaneous, real-time interrogation of transatlanticly separated scientific databases.
By early 1994 The World Wide Web (Berners-Lee (1994)) had matured to where it was possible to make the ADS Abstract Service available via a web forms interface; this was released in February. Within five weeks of the initial WWW release use of the Abstract Service quadrupled (from 400 to 1600 users per month).
By the end of 1994 the ADS project had again been restructured, leaving primarily the WWW based Abstract Service as its principle service. Also the STELAR project at NSSDC ended, and the ADS took over responsibility for creating the database of bitmaps.
The first full article bitmaps, which were of Astrophysical Journal Letters articles, were put on-line in December 1994 (Eichhorn et al. (1994)). By the summer of 1995 the bitmaps were current and complete going back ten years. At that time the Electronic ApJ Letters (Boyce (1995)) went on-line. ¿From the start the ADS indexed the EApJL, and pointed to the electronic version. Also from the beginning the reference section of the EApJL pointed (via WWW hyperlinks) to the ADS abstracts for articles referenced in the articles; again this was enabled by the use of the bibcode.
Also during this time the NASA STI branch became unable to provide abstracts of the journal articles in astronomy. In order to continue the abstract service cooperative arrangements were made with nearly every astronomical research journal, as well as a number of other sources of bibliographic information. DATA describes these arrangements in detail.
The next year (1996) saw nearly every astronomy journal which had not already joined into collaboration with ADS join. Also in 1996 the American Astronomical Society purchased the right to use a subset of the Science Citation Index, and gave these data to ADS (Kurtz et al. (1996)).
3 The Current System
Currently the ADS system consists of four semi-autonomous (to the user) abstract services covering Astronomy, Instrumentation, Physics, and Astronomy Preprints. Combined there are nearly 1.5 million abstracts and bibliographic references in the system. The Astronomy Service is by far the most advanced, and accounts for % of all ADS use; it ought be noted, however, that the Instrumentation Service contains more abstracts than Astronomy, and a subset of that service is used by the Society of Photo-Optical Industrial Engineers as the basis of the official SPIE publications web site.
All of what follows will refer only to the Astronomy service.
3.1 Data
Here is a brief overview of the data in the ADS system, a complete description is in DATA.
3.1.1 Abstracts
The ADS began with the abstracts from the NASA STI database, in printed form these abstracts were the union of the International Aerospace Abstracts and the NASA Scientific and Technical Abstracts and Reports (NASA STAR). While the STI branch has had to substantially cut back on their abstracting of the journal literature, we still get abstracts of NASA reports and other materials from them.
We now receive basic bibliographic information (title, author, page number) from essentially every journal of astronomy. Most also send us abstracts, and some cannot send abstracts, but allow us to scan their journals, and we build abstracts through optical character recognition. Finally we receive some abstracts from the editors of conference proceedings, and from individual authors.
The are 500,000 different astronomy articles indexed in the ADS, the database is nearly complete for the major journals articles beginning in 1975.
3.1.2 Bitmaps
The ADS has obtained permission to scan, and make freely available on-line, page images of the back issues of nearly all of the major journals of astronomy. In most cases the bitmaps of current articles are put on-line after a waiting period, to protect the financial integrity of the journal. DATA describes the current status of these efforts.
We plan to provide for each collaborating journal, in perpetuity, a database of page images (bitmaps) from volume 1 page 1 to the first issue which the journal considers to be fully on-line as published. This will provide (along with the indexing and the more recent archives held by the journals) a complete electronic digital library of the major literature in astronomy.
3.1.3 Links
ADS responds to a query with a list of references and a set of hyperlinks showing what data is available for each reference. There are 1.73 million hyperlinks in the ADS, of which 31% are to sources external to the ADS project.
The largest number of external links are to SIMBAD, NED, and the electronic journals. A rapidly growing number, although still small in comparison to the others, are to data tables created by the journals and maintained by the CDS and the ADC at Goddard. SEARCH describes the system of hyperlinks in detail.
3.1.4 Citations and References
The use of citation histories is a well known and effective tool for academic research (Garfield (1979)); their inclusion in the ADS has been planned since the conception of the service. In 1996 the AAS purchased a subset of the Science Citation Index from the Institute for Scientific Information, to be used in the ADS; this was updated in 1998. This subset only contains references which were already in the ADS, thus it is seriously incomplete in referring to articles in the non-astronomical literature. This citation information currently spans January 1982-September 1998.
The electronic journals all have machine readable, web accessible, reference pages. The ADS points to these with a hyperlink where possible. Several publishers allow us to use these to maintain citation histories; we do this using our reference resolver software (see ARCHITECTURE). The same software is also used by some publishers to check the validity of their references, pre-publication.
Additionally we use optical character recognition to create reference and citation lists for the historical literature, after it is scanned (Demleitner, et al. (1999)).
3.1.5 Collaboration with CDS/SIMBAD
The Strasbourg Data Center (CDS) has long maintained several of the most important data services for astronomy (e.g. Jung (1971); Jung, Bischoff, & Ochsenbein (1973); Genova et al. (1998)); access to parts of the CDS data via ADS is a key feature of the ADS.
ADS users are able to make joint queries of the ADS bibliographic database and the CDS/SIMBAD bibliographic data base. When SIMBAD contains information on a object which is referred to in a paper whose reference is returned by ADS then ADS also returns a pointer to the SIMBAD data. When a paper has a data table which is kept on-line at the CDS the ADS returns a pointer to it. The CDS-ADS collaboration is at the heart of Urania (section 4). More recently ADS has entered into a collaboration with the National Extragalactic Database (NED; Helou & Madore (1988), Madore et al. (1992)) which is similar to the SIMBAD portion of the CDS-ADS collaboration.
3.2 Search Engine
The basic design assumption behind the search engine, and other user interfaces, is that the user is an expert astronomer. This differs from the majority of information retrieval systems, which assume that the user is a librarian. The default behavior of the system is to return more relevant information, rather than just the most relevant information, assuming that the user can easily separate the wheat from the chaff. In the language of information retrieval this is favoring recall over precision. SEARCH describes the user interface in detail.
3.3 Hardware and Software Architecture
The goals of our hardware and software systems are speed of information delivery to the user, and ease of maintainability for the staff. We thus pre-compute many things during our long indexing process for later use by the search engine; we have highly optimized all code which is run by user processes; we have developed a worldwide network of mirror sites to speed up internet access. ARCHITECTURE describes these systems.
3.4 Data Ingest
The basic rule for what books and periodicals the ADS covers is: if it is in the Center for Astrophysics library it should be in the ADS. As a goal we are still some ways from realization. We have recently adopted a second rule for inclusion: if it is referenced by an article in a major scholarly journal of astronomy it should be in the ADS. DATA describes the ADS coverage, and ingest procedures.
4 Urania
The idea that the internet could be used to link sources of astronomical information into a unified environment is more than a decade old; it was fully expressed in the planning for the old ADS (Squibb & Cheung (1988)) and ESIS (Adorf, et al. (1988)) projects. These early attempts were highly data oriented, their initial goals were the interoperability of different distributed data archives, primarily of space mission data.
Astronomical data is highly heterogeneous and complex; essentially every instrument has its quirks, and these must be known and dealt with to reduce and analyze the data. This quirky nature of our data essentially prevented the establishment of standardized tools for data access across data archives.
The new, hyperlink connected network data system for astronomy is based on the highest level of data abstraction, object names and bibliographic articles, rather than the lowest, the actual observed data in archives. This change in the level of abstraction has permitted the creation of a system of extraordinary power. This new system, still unique amongst the sciences, has been dubbed Urania (Boyce (1996)), for the muse of astronomy.
Conceptually the core of Urania is a distributed cross-indexed list which maintains a concordance of data available at different sites. The ADS maintains a list of sites which provide data organized on an article basis for every bibliographic entry in the ADS database. The CDS maintains a list of articles and positions on the sky for every object in the SIMBAD database. The CDS also provides a name to object resolver. The possibility for synergy in combining these two data systems is obvious; they have functioned jointly since 1993.
Surrounding this core, and tightly integrated with it, are many of the most important data resources in astronomy, including the ADS Abstract Service, SIMBAD, the fully electronic journals (currently ApJL, ApJ, ApJS, A&A, A&AS, AJ, PASP, MNRAS, New Astronomy, Nature, and Science), NED, CDS-Vizier, Goddard-ADC, and the ADS Article Service. All these groups actively exchange information with the Urania core, they point their users to it via hyperlinks, and they are pointed to by it.
The astronomy journals which are not yet fully electronic, in that they do not support hyperlinked access to the Urania core, also interact with the system. Typically they provide access to page images of the journal, either through PDF files, or bitmaps from the ADS Article Service, or both. Bibliographic information is routinely supplied to the ADS, and the SIMBAD librarians routinely include the articles (along with those of the electronic journals) in the SIMBAD object-article concordance.
While most data archives are not closely connected to the Urania system there are some exceptions. For example the National Center for Supercomputing Application’s Astronomy Digital Image Library (Plante, Crutcher, & Sharpe (1996)) connects with the ADS bibliographical data via links which are papers written about the data in the archive. SIMBAD connects with the High Energy Astrophysics Science Archive Research Center (HEASARC) (White (1992)) archive using the position of an object as a search key, HEASARC has an interface which permits several archives to be simultaneously queried McGlynn & White (1998), and a new data mining initiative between CDS and the European Southern Observatory (ESO) (Ortiz, et al. (1999)) will connect the Vizier tables with the ESO archives. Several archives use the SIMBAD (and in some cases NED) name resolver to permit users to use object name as a proxy for position on the sky, the Space Telescope Science Institute (STScI) Digital Sky Survey (Postman (1996)) would be an example. The Space Telescope-European Coordinating Facility archive (Murtagh (1995)) allows ADS queries using the observing proposals as natural language queries, and the Principal Investigator names as authors.
The establishment and maintenance of the Urania core represents a substantial fraction of the ADS service. SEARCH discusses the user interface to the set of hyperlinks, ARCHITECTURE discusses the methods and procedures we use to implement and maintain the links, and DATA discusses the data sharing arrangements we have with other groups, and presents a complete listing of all our data sources.
5 Capabilities, Usage Patterns, and Statistics
5.1 Examples
The ADS answers about 5,000,000 queries per year, covering a wide range of possible query type, from the simplest (and most popular): “give me all the papers written by (some author),” to complex combinations of natural language described subject matter and bibliometric information. Each query is essentially the sum of simultaneous queries (e.g. an author query and a title query), where the evidence is combined to give a final relevance ranking (e.g. Belkin, et. al (1995)).
The ADS once supported index term (keyword) queries, but does not currently. This is due to the incompatibility of the old STI (NASA-STI (1988)) keyword system with the keywords assigned by the journals (Abt (1990); A&A (1992); MNRAS (1992)) . Work is underway to build a transformation between the two systems (Lee, Dubin & Kurtz (1999); Lee & Dubin (1999)).
Here we show four examples of simple, but sophisticated queries, to give an indication of what is possible using the system. A detailed description of available query options is in SEARCH. We encourage the reader to perform these queries now, to see how the passage of time has changed the results.
Figure 1 shows how to make the query “what papers are about the metallicity of M87 globular clusters?” This was the first joint query made after the SIMBAD-ADS connection was completed in 1993.
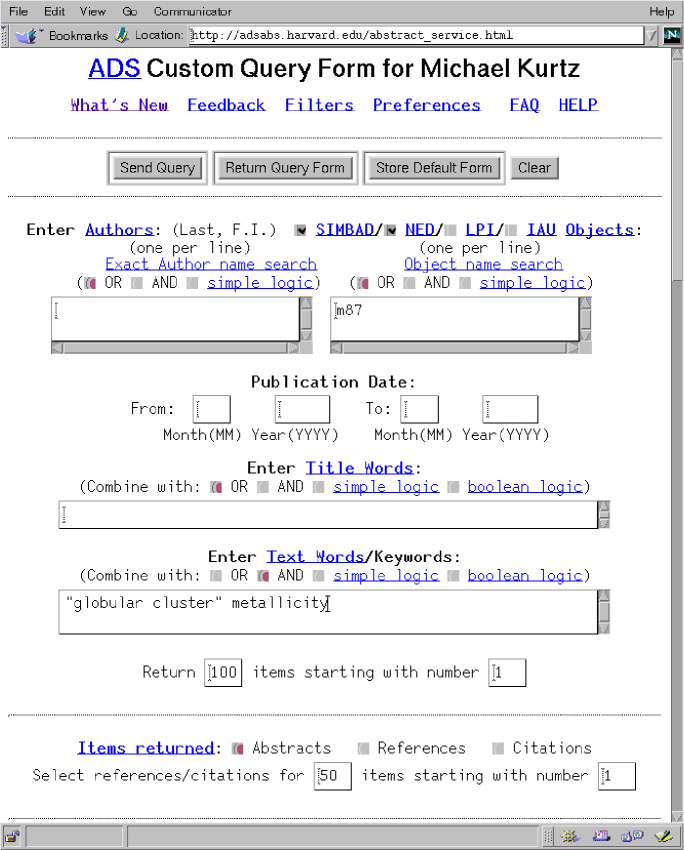
There are 1,765 papers on M87 in SIMBAD, NED, or both; there are 6,425 papers which contain the phrase “globular cluster” in ADS, and there are 25,599 papers in ADS containing “metallicity” or a synonym (abundance is an example of a synonym for metallicity). The result, which comes in a couple of seconds, is a list of just those 58 papers desired.
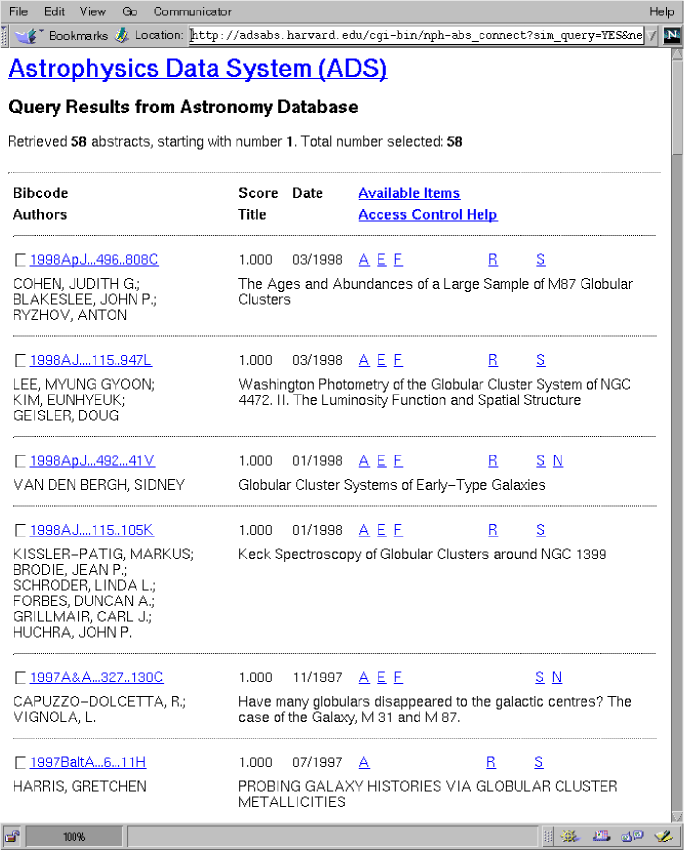
Five different indices are mixed in this query: the SIMBAD object—bibcode index query on M87 is logically OR’d with the NED object—refcode index query for M87. The ADS phrase index query for “globular cluster” is (following the user’s request) logically AND’d with the ADS word index query on metallicity, where metallicity is replaced by its group of synonyms from the ADS astronomy synonym list (this replacement is under user control). If the user requires a perfect match, then the combination of these simultaneous queries yields the list of 58 papers shown in figure 2. Before the establishment of the Urania core queries like this were nearly impossible.
Another simple, but very powerful method for making ADS queries is to use the “Find Similar Abstracts” feature. Essentially this is an extension of the ability to make natural language queries, whereby the user can choose one or more abstracts to become the natural language query. This can be especially useful when one wants to read in depth on a subject, but only knows one or two authors or papers in the field. This is a typical situation for many researchers, but especially for students.
As an example, suppose one is interested in Ben Bromley’s (1994) PhD thesis work. Making an author query on “Bromley” gets a list of his papers, including his thesis. Next one calls up the abstract of the thesis, goes to the bottom of the page, where the “Find Similar Abstracts” feature is found, and clicks the “Send” button. Figure 3 shows the top of the list returned as a result. These are papers listed in order of similarity to Bromley’s (1994) thesis; note that the thesis itself is on top, as it matches itself perfectly. This list is a detailed subject matter selected custom bibliography.
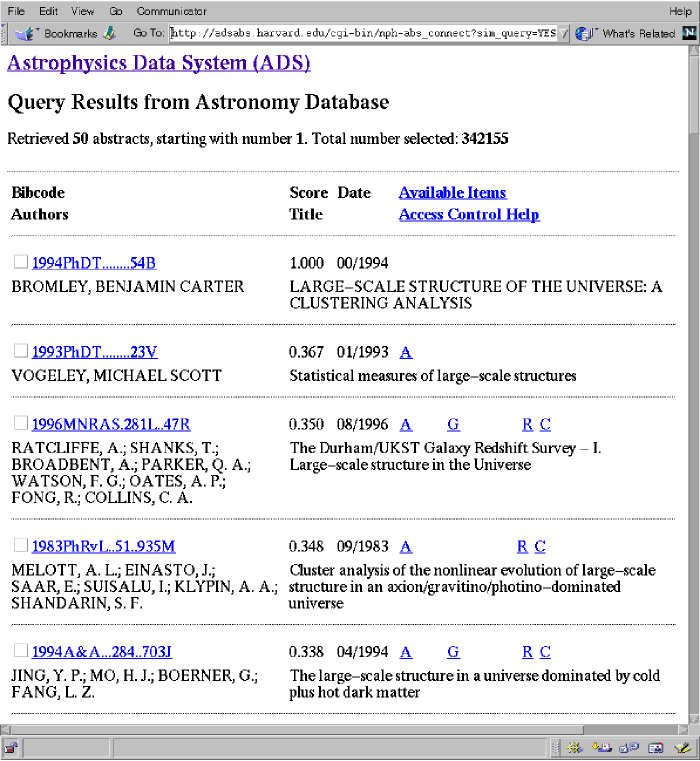
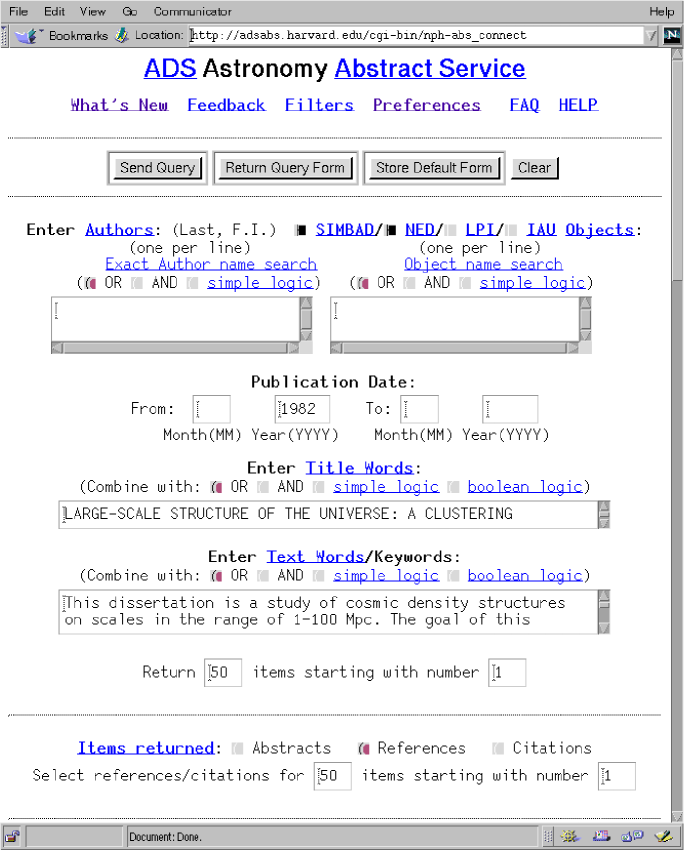
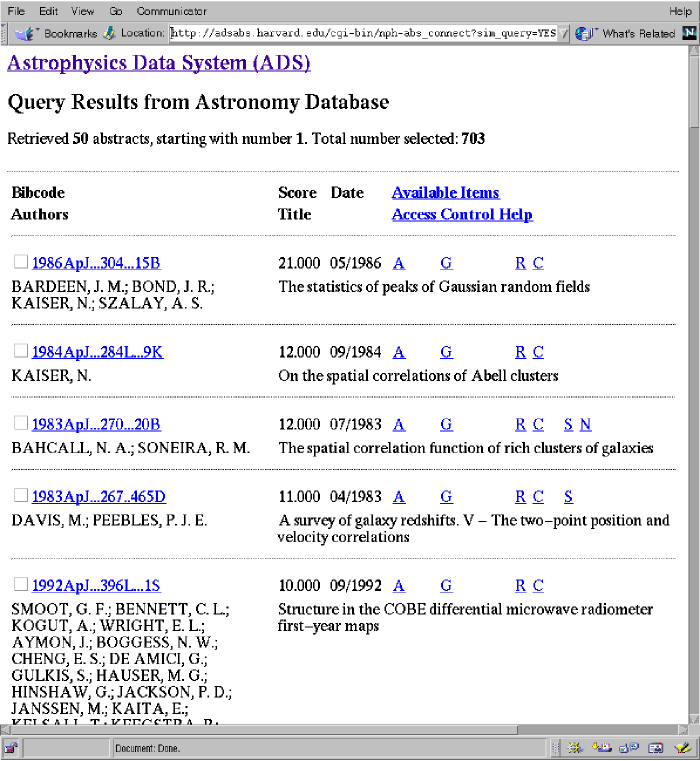
As a third example of ADS use figure 4 shows an intermediate step from the previous example (obtained by clicking on the “Return Query Form” button, replacing the default “Return Query Results” in the “Find Similar Abstracts” query. Here we make one change from the default setting: we change “Items returned” from the default “Abstracts” to “References.” The result, shown in figure 5 lists all the papers which are referenced in the 50 papers most like Bromley (1994), sorted by the number of times they appear in the 50 reference lists. Thus the paper by Bardeen et al. (1986) appears in 21 reference lists out of 50, the paper by Davis & Peebles (1983) appears in 11 lists out of 50, etc. By this means one has a list of the most cited papers within a very narrowly defined subfield specific to one’s personal interest. We are not aware of any other system which currently allows this capability.
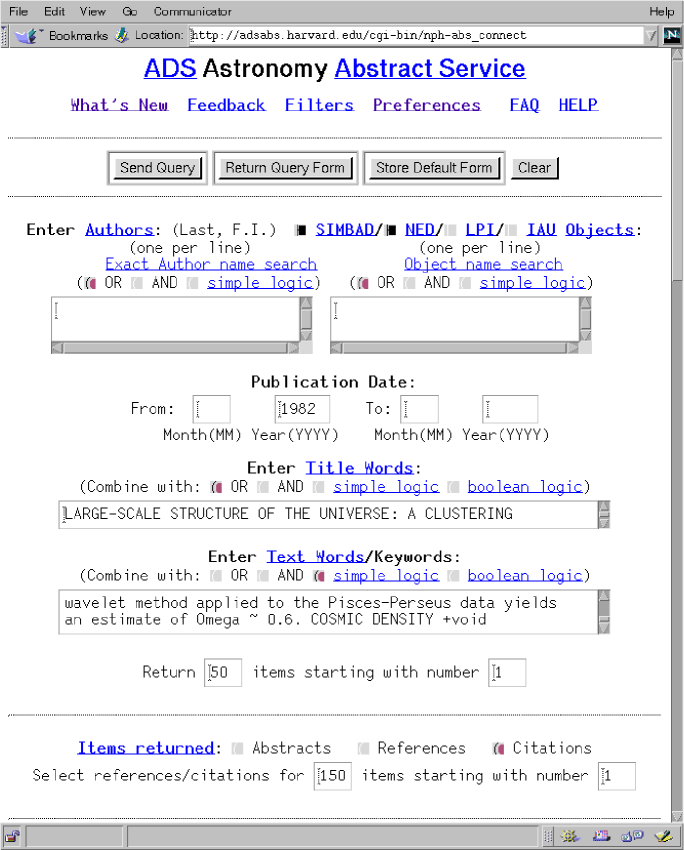
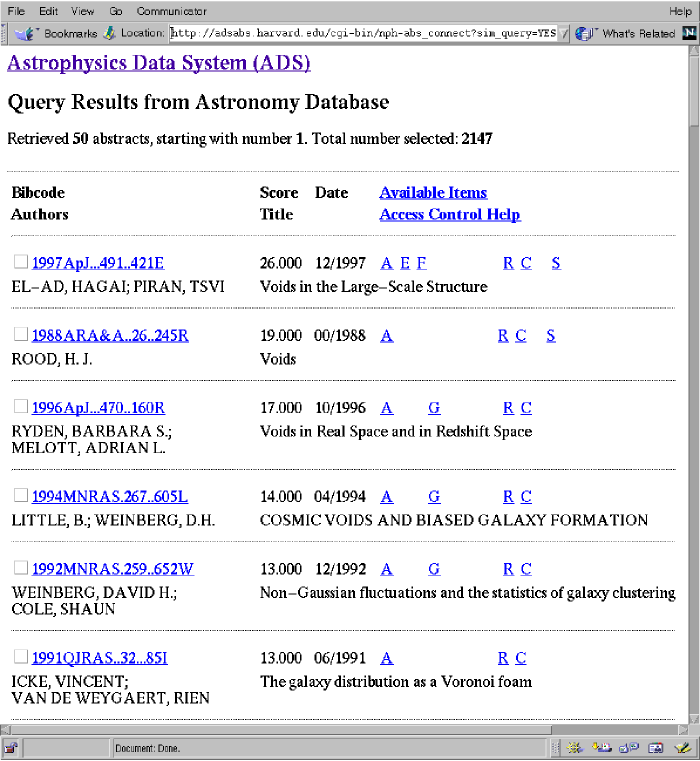
Finally we show a somewhat more complex query in figure 6. Here we modify the basic query (Bromley’s (1994) thesis) by requiring that the papers contain the word “void.” We do this by changing the logic on the text query to “simple logic” and adding “+void” to the query. The returned papers to this query would be very similar to those shown in figure 3, but with all papers which do not contain the word “void” removed. In addition we change “Items returned” to be “Citations,” and increase the number of papers to get the citations for to the top 150 closest matches to the query. The result, shown in figure 7, are those papers which most cite the 150 papers most like Bromley’s (1994) thesis, modified by the requirement that they contain the word “void.” Thus the paper by El-Ad & Piran (1997) cited 26 papers out of the 150, the paper by Rood (1988) cited 19, etc. These are the papers with the most extensive discussions of a user defined very narrow subfield. This feature also is unique to the ADS.
5.2 Use of the System
In September 1998 ADS users made 440,000 queries, and received 8,000,000 bibliographic references, 75,000 full-text articles, and 275,000 abstracts (130,000 were individually selected, the rest were obtained through a bulk retrieval process, which typically retrieves between one and fifty), as well as citation histories, links to data, and links to other data centers. Of the 75,000 full-text articles accessed through the ADS in September 1998, already 33% were via pointers to the electronic journals. This number increased to 52% in March 1999.
ADS users access and print (either to the screen, or to paper) more actual pages than are printed in the press runs of all but the very largest journals of astronomy. In September 1998, 472,621 page images were downloaded from the ADS archive of scanned bitmaps. About 75% of these were sent directly to a printer, 22% were viewed on the computer screen, and 2% were downloaded into files; FAXing and viewing thumbnail images make up the rest. If the electronic journals provide “pages” of information at the same rate as the ADS archive, per article accessed (slightly more than 10 pages/article accessed), then more than 750,000 “pages” were “printed,” on demand, in September 1998 by ADS users. This is about three times the number of physical pages published in September 1998 by the PASP.
Viewed as an electronic library the ADS, five years after its inception, provides bibliographic information and services similar to those provided by the sum of all the astronomy libraries in the world, combined. The Center for Astrophysics Library, an amalgamation of the libraries of the Harvard College Observatory and the Smithsonian Astrophysical Observatory, is one of the largest, most complete, and best managed astronomy libraries in the world. For several years the CfA Library has been keeping records of the number of volumes reshelved, as a proxy for the number of papers read (library users are requested not to reshelve anything themselves). This number has remained steady in recent years, and was 1117 in September 1998 (D.J. Coletti & E.M. Bashinka 1998, personal communication). If the CfA represents 2–3% of the use of astronomy libraries, worldwide (the CfA has slightly more than 350 PhDs, the AAS has about 6800 members, the IAU about 8500, CfA users made 2.4% of ADS queries in September 1998, 5.7% of articles in the ADS Astronomy database with 1998 publication dates had at least one CfA author), and if other astronomers use their libraries at the same rate as astronomers at the CfA, then worldwide there would have been 37,000–56,000 reshelves in September 1998. In September 1998 ADS provided access to 75,000 full text articles and 130,000 individually selected abstracts, as well as substantial other information; current use of ADS is clearly similar to the sum of all current traditional astronomy library use.
ADS use continues to increase. Figure 8 shows the number of queries made each month to the ADS Abstract Service from April 1993 to September 1998, the dotted straight line represents a yearly doubling, which represents the five year history reasonably well. Since 1996 use has been increasing at a 17 month doubling rate, shown by the dashed line in the figure.

It is difficult to determine the exact number of ADS users. We track usage by the number of unique “cookies”111A cookie is a unique identifier which WWW providers (in this case ADS) assign to each user, and store on the users computer using the browser. which access ADS, and by the number of unique IP222Each Machine on the internet has a unique IP (Internet Protocol) address. addresses. There are difficulties with each technique. In addition many non-astronomers find ADS through portal sites like Yahoo, which skews the statistics. In September 1998 10,000 unique cookies accessed the full-text articles, 17,000 made queries, and 30,000 visited the site. 91% of full-text users had cookies, but only 65% of site visitors.
Figure 9 shows the number of unique users who made a query using the ADS each month from April 1993 to September 1998. Before early 1994 users had user names and passwords in the old, proprietary system, and could be counted exactly; after the ADS became available on the WWW users were defined as unique IP addresses. Note the enormous effect the WWW had on ADS use, a factor of four in the first five weeks. The straight dashed line represents the 17 month doubling period seen recently in the number of queries; the dotted line, which better represents the recent growth, is for a 22 month doubling period. The difference between the two is due to a one third increase in the mean number of queries per month per user (from 19 to 25) since 1996.

¿From another perspective, the number of unique IP addresses from a single typical research site (STScI) which access the full-text data in a typical month (September 1998) is 107, the number of unique cookies associated with stsci.edu which access the full-text data is 104, the number of unique IP addresses from STScI which make a query to ADS is 148 and the number of cookies is 140. The number of AAS members listing an STScI address is 145 (J. Johnson, personal communication), and the number of different people listing an STScI address in the Astropersons e-mail compilation (Benn & Martin (1995)) is 195. Those who access the full-text average one article per day, those who make queries average two per day.
We believe nearly all active astronomy researchers, as well as students and affiliated professionals use the ADS on a regular basis. Most of the recent exponential growth of use of the ADS is due to an increased number of users; this growth cannot last much longer, the 17,000 who made queries in September 1998 are probably the majority of all those who could conceivably want to make a query of the technical astronomy literature.
6 How the Astronomical Literature is used
Electronic libraries, because they provide access to the literature on an article basis, can provide direct measures of the use of individual articles. Direct bibliometric studies of article use are rare, and tend to be based on small samples (e.g. Tsay (1998)); most bibliometric studies use indirect measures, particularly citation histories,(e.g. Garfield (1979); White & McCain (1989); Line (1993)), as proxies for use.
Astronomy is perhaps unique, in that it already has an integrated electronic information resource (ADS/Urania) which includes electronic access to nearly all the modern journal literature, and which is used by a large fraction of practitioners in the field, worldwide. The combined Urania logs, including the electronic journals and the ADS, probably represent a fair sample of total readership in the field, perhaps even a majority of the readership as well.
In this section we will investigate the use of the astronomy literature as shown by the ADS logs; for articles more than a few months past the publication date they probably represent accurately the use of the astronomy literature. For articles immediately after publication the logs of the electronic journals are the definitive source; this usage pattern is substantially different from the pattern shown in the ADS logs, for example, the half-life for article reads for the electronic Astrophysical Journal is measured in days (E. Owens, 1997, personal communication).
6.1 Readership as a Function of Age
The ADS logs provide a direct measure on the readership of individual articles. There are several different ADS logs, here we will use the “data” log. Entries in the data log correspond to individual data items selected from a list which is returned following a query, such as shown in figure 2. Each entry is the result of a user, who can see the authors and title of a paper, choosing to get more information. 61% of these requests are for the abstract, 34% are for the whole text, 2% are for the citation histories, as well as several other options; SEARCH lists all the options and their use. In what follows we will refer to any request for data as a “read.” By “age” we refer to the time since publication of an article, NOT the time since birth of the astronomer reading the article!
In this subsection we restrict the study to the January 1999 log, and only requests for information about articles published in the largest (in terms of ADS use) eight journals (ApJ, ApJL, ApJS, A&A, A&AS, MNRAS, AJ, PASP; hereafter the Big8). The Big8 represent 62% of the 270,000 entries in the January data log.
Figure 10 shows the number of ADS reads (solid line, left abscissa) during January 1999 for articles published in the Big8 from 1976 to 1998, and the number of Big8 articles for which at least one data item was requested (dotted line, right abscissa), on a log-linear plot, binned yearly. The ADS database is 100% complete in titles, and in links to the full text of articles (either to the ADS scans, or directly to the electronic journals), and is 99% complete in article abstracts for the Big8 journal articles published during this 22 year period.

The number of papers published in the Big8 has been increasing at about 4% per year during this 22 year period (Schulman et al. (1997); Abt (1998); figure 11), figure 12 shows the information in figure 10 divided by the number of papers published. The top line shows the mean number of reads per paper, and the bottom line shows the fraction (maximum 1) of papers published for which information was requested.


¿From 1976 to about 1994 the two lines are nearly parallel; this demonstrates that the change in readership with age is caused mainly by a change in the fraction of papers which are considered interesting enough to be read, not by a change in the number of times an interesting paper is read. Extrapolating the relation seen in the earliest 16 years of figure 12 we find that the fraction of articles interesting enough to be read is , where T is the age of the article in years, and is about 0.7. Similarly readership declines as , so the mean number of reads per relevant article is , with equal to 2.5 reads per month. For articles between 4 and 22 years old the readership pattern is well fit by .
For articles younger than 4 years old the extrapolation of the model substantially underestimates readership. While the fraction of read papers is only about 20% higher than the extrapolation (it could not be more than 30% after which all papers would be read), the mean reads per paper is 350% higher.
We postulate that there is another mode of readership, which dominates for articles between one month and four years old, we will call this “papers current enough to be read.” If we subtract the model from the data we get the residual of papers current enough to be read. This can be well represented by , where is equal to 5 reads per month. Now we have a two component model for readership (per article published), valid for papers between one month and 22 years old which is .
Figure 13 shows how well the model fits the actual readership data for January 1999. The solid line shows the difference between the log of the reads per paper published and the log of the model; the dotted lines show the errors, estimated using . Clearly the model fits the data well.

While the model accounts for the vast majority of ADS use, there are at least two other modes of readership, which we will call “historical”, and “new”. The historical mode describes the use of very old articles, and the new mode describes the readership of the current issue of a journal.
The ADS in January 1999 had only one journal which is complete to an early enough time to measure the historical mode, the Astronomical Journal, which is complete from volume 1 in 1849. The data currently available (shown in figure 14) suggest a constant low level use, independent of time, , where is 0.025 reads per month. With the database now being extended to include much of the literature of the past two centuries this parameterization should improve greatly in the next couple of years.

The new mode represents the readership of the latest issue of a journal. As soon as a journal is issued, either received in the mail, or posted electronically, a large number of astronomers scan the table of contents and read the articles of interest. Although ADS has a feature in the Table of Contents page which supports this type of readership, it does not represent a substantial fraction of ADS use. We believe most users do this either with the paper copy, or through the electronic journals directly. We can crudely estimate this mode in the ADS use by examining the daily usage logs following the release of new issues of the Astrophysical Journal, After subtracting the other modes already described we find , where is about 3.5 reads per month. For an accurate description of this mode one would need to analyze the logs of the electronic journals.
Finally we have a four component model for how the astronomical literature is read, as a function of the age of an article, , where the first three terms are exponentials with very different time constants, and the fourth is a low level constant. ADS use certainly underestimates the amplitude of the term, and may underestimate the amplitude of the term, as there are alternative electronic routes to some of these data.
6.2 Comparison of Readership with Citation History
Citation histories have long been used to study the long-term readership of scientific papers (e.g. Burton and Kebler (1960)) with the basic result that the number of citations that a paper receives declines exponentially with the age of the article. While it is often assumed that the pattern of use is similar to the pattern of citation this has not been conclusively demonstrated. Recently Tsay (1998) has found that the mean use half-life for a set of medical journals was 3.4 years, while the mean citation half-life for the same journals was 6.3 years.
We will compare the use of some of the Big8 journals with their citation histories using two datasets: the ADS data logs for the period from 1 May 1998 to 31 July 1998, and the citation information provided to ADS by the Institute for Scientific Information covering references in articles published during the first nine months of 1998, and only covering references from 1981 to date. ISI does not provide us with the full citation histories, rather they provide us with pairs of citing and cited journal articles where both are in the ADS database, so the results will systematically underrepresent the citation histories of articles with substantial influence in areas outside astronomy, or where the primary references come from conference proceedings.
Figure 15 compares the citation histories of the Big8 journals with their readership; the abscissa refers to the citation information (dotted lines), the readership data (solid lines) have been arbitrarily shifted for comparison. The lower dotted line represents the fraction of Big8 journal articles which were cited during the first nine months of 1998; the upper dotted line represents the mean number of cites per article. The lower solid line shows the mean number of reads per article during the three month period May-July 1998, shifted by a factor of 19; the upper solid line shows the fraction of Big8 articles read, times 1.8.

The number of cites has the same functional form as the fraction of reads, And the fraction of cites has the same form as the number of reads. This result is perhaps surprising.
Except for the most recent year (1997), where the number of cites declined from the year before the number of cites per article declines with age as or proportional to , the long term declining readership. The citation half-life for these articles, 7.7 years, is longer than the 4.9 years found by Gupta (1990) for the Physical Review, but is consistent with results of Abt (1981, 1996) of 20-30 year half-lives with no normalization, once one takes the increase in the number of astronomy papers/cites into account (Abt 1981, 1995).
The fraction of articles cited, on the other hand, appears to follow the same two component form as readership, . We postulate the following explanation for this behavior. The degree of citability we define as the degree to which a paper would be cited, were it possible. We postulate this is directly proportional to readership: . The large increase in the fraction of recent papers cited is thus due to the large increase in readership. We define the ability of a paper to be cited to be a steeply increasing function of age, simply because for one paper to cite another it must appear before the second paper is written, refereed, and published: . Our model for the mean number of citations a paper receives, , as a function of age is: or .
Figure 16 shows the the number of citations per paper as a function of age (thick solid line), the model using the actual number of reads per paper for (thin solid line), and the model using the model for (dotted line). The product of the constants is the number of citations per read, currently this is about 0.08.

The papers which are frequently cited tend also to be frequently read, although the correlation is not very strong. We rank the papers by number of cites/reads during the 1998 periods, and perform a Spearman rank correlation between the 26988 different Big8 papers cited and the 53755 papers read (57340 total), we obtain . This underestimates the correlation because it excludes papers which were neither cited nor read.
Of the 66392 Big8 papers published between 1982 and 1997 81% were read in the 3 month period using ADS, while 41% were cited during the 9 month period. The probability that a paper was not read declined sharply with the number of times it was cited. Figure 17 shows this; one paper each of the (324, 224, 126) papers which were cited (7, 8, 9) times went unread during the period; none of the 430 papers which were cited 10 or more times went unread.

The relations between the number of cites or reads of a paper and the rank that paper has when ranked by number of cites/reads are identical. If one takes papers published in a single year both cites and reads follow a Zipf (1949) power law ( is the number of reads or cites, and is the rank of the paper with that many reads/cites), where is , this is the same result Redner (1998) found for citation histories for the physics literature. If papers from all years are taken together and ranked the power law index flattens identically for both cites and reads to .
6.3 How the Journals are Used
6.3.1 The main journals
Figure 18 shows the fraction of articles published in the Big8 by each of the five main journals, leaving out the letters and supplements. We show the data only for articles published from 1983 to 1995. Before 1983 the data from ISI are less complete, and after 1995 the presence of the electronic journals, and the differing rules for the distribution of the ADS bitmaps, make the meaning of a “read” differ from journal to journal. The reads and cites data for figures 18, 19, and 20 comes from the same 1998 reporting periods described above.


Figure 19 shows the relative readership of papers as a function of journal and publication year. The abscissa is the ratio of the fraction of Big8 papers read and the fraction of Big8 papers published. Were all papers read equally frequently, independent on the journal in which they were published, figure 19 would show five straight lines at one; it does not. The papers from the AJ are read more on a per article basis than the other journals; the papers from A&A are read less. Recent PASP papers are read substantially more frequently than older ones, when compared with the readership patterns of the other journals.
Figure 20 shows the ratio of the fraction of citations an article received to the fraction of reads, as a function of journal and year. Were all articles cited in the same proportion to the number of times they were read (this is the constant in 6.2) then the figure would be five straight lines at one. The three bi- and tri-monthly journals do not show much deviation from straight lines at one, while the AJ appears to be systematically less cited than it is read. The PASP again shows an increase during the beginning of this decade.
Recall that the readership and citation information are from hundreds of thousands of individual decisions made by more than 10,000 astronomers during 1998. Taken together figures 18, 19, and 20 show the current opinion of astronomers as to the usefulness of articles as a function of journal and publication date. The growth of the AJ for example, from 6.5% of Big8 articles to 9.5% has not greatly affected the relative readership or citation rates for the journal.
The recent history of the PASP is perhaps the most interesting feature on figures 18, 19, and 20. From 1983 to 1995 the fraction of Big8 papers published by PASP declined from 6% to 3% . This decline is overstated, as PASP published some conference proceeding abstracts during the late 1980s, a practice which ended in 1991; the decline is nevertheless real: PASP published the same number of papers in 1995 as 19 years before, during which time the number of Big8 journal articles doubled.
Figure 19 shows two main features, fluctuations, and a slow rise. The large fluctuations during the late 80s and early 90s are due to two factors: fluctuations in the number of conference proceeding papers and abstracts; and the influence of Stetson (1987), which was read at twice the rate of the next most read paper from 1997, and four times the next most read PASP paper from that year. The rise in the readership measure during the 1990s is not caused by any known systematic; we believe it represents a real increase in the perceived usefulness of the journal.
Figure 20 also shows the influence of Stetson (1987), currently the third most cited article in the ADS database, although now without the addition of the fluctuations in article counts. It also shows the rise in the perceived usefulness per article (this time in the measure of cites per read). Noting that the number of cites per article is the product of figures 19 and 20 the rise in the number of cites per article, compared with the Big8 over the period 1989 to 1995 is a factor of three, so that now the journal is at full parity with the Big8. This demonstrates that the policy during this period was one of quality rather than quantity, a policy we dub “shaken, not stirred.”
6.3.2 Loss of relative currency
All Big8 astronomical journals lose currency, the current usefulness of an article, at a rate described by the readership and citation models of 6.1 and 6.2. Any changes in the loss of currency of one journal with respect to the rest of the Big8 should be seen in figure 19 in the form of a relative decrease in readership, as a function of age. Indeed the changes in the PASP which we have attributed to changes in editorial policy could simply be a substantial loss of relative currency.
One of the Big8 journals, the Astrophysical Journal Letters is intended to lose currency more rapidly than the other journals. Figure 21 shows the relative fraction of articles published (thin solid), articles read (thick solid), and articles cited (dotted) for the ApJL from 1981 to 1997. Except for the period from 1994 to 1997 the curves track each other reasonably well; older ApJL papers are not cited or read any more or less than the Big8 average. For the more recent papers the cites and reads increase above the fraction published, implying that the journal is in some sense more current than average.

In terms of readership this effect is strongly affected by a systematic. During the 3 month period in 1998, most of the 1996 and all of the 1997 issues of MNRAS were not available electronically due to copyright constraints. This dramatically lowered the relative readership of that journal, pushing all the others up. Also all five journals which were fully electronic during 1997 show increases compared with AJ and PASP which were only available as bitmaps. Thus the increase in readership of the ApJL, the pioneer electronic journal (Boyce (1995)), could be due to its superior delivery system, rather than its content.
6.3.3 Local differences in readership rates
Astronomers in different parts of the world read different journals at different rates than the average. Figure 22 shows three typical differences. The three curves show the ratio of readership fractions for a particular subset when compared with the rest of the world; a value of 1 means that there is no difference in relative readership. The thin solid line shows the MNRAS readership ratio for users who access the US site and have IP addresses ending in .uk; it shows that the British read Monthly Notices about 60% more than the world average.

The dotted line shows the A&A readership ratio for users of the Strasbourg mirror, and the thick solid line shows the AJ readership ratio for US users with an IP address ending in .edu. They show that Europeans/Americans read A&A/AJ about 20% more than the rest of the world. The ApJ also shows about a 20% increase in the US; the PASJ shows a 300% increase in Japan.
6.3.4 Use of historical literature
The ADS is in the process of putting a large fraction of the astronomical literature of the past two centuries on-line via bitmapped scans. The first nineteenth century journal to be fully on-line is the Astronomical Journal, which was first fully on-line on 1 January 1999. Figure 14 shows the raw readership figures for the first two months of 1999 (US logs only), this shows the current readership of 150 years of the journal.
Clearly the back issues are being read; the only year where the journal was published, but no paper was read in the two months, was 1909, where only 12 papers were published. Also there is a break in the exponential falloff with age for articles published between 1950 and 1960, where approximately twice the expected readership occurred. During this period 94 different users read 283 articles; the biggest user made 13 reads. We have no explanation for this increased use. The only other period where the use is not predicted by the model of 6.1 is the first decade of the journal’s existence, perhaps due to curiosity.
7 The Impact of the ADS on Astronomy
It is difficult to judge the impact of scientific work. For scientific programs citation histories, personal honors and awards, and the success of students can give a measure of impact. For support type programs these measures do not suffice; the impact of the 200-inch Hale Telescope (Anderson (1948), Rule (1948)) or the 4-meter Mayall Telescope (Crawford (1965)) clearly extends beyond the papers and honors of their respective developers. The impact of large software projects is, if anything, even harder to quantify; the large data reduction environments, like AIPS (Fomalont (1981), Greisen (1998)), MIDAS (Banse et al. (1983)), or IRAF (Tody (1986)) have transformed astronomy, but how much?
The ADS is perhaps unique among large support projects in that a reasonably accurate quantitative estimate of its impact can be made. This is because many of the services the ADS provides are just more efficient methods of doing things astronomers have long done, and found worth the time it took to do them.
We will assign to each of several ADS functions a time which is our estimate of the increase in research time which accrues to the researcher by virtue of using that function. Our fundamental measure will be the time saved in obtaining an article via the ADS, which we estimate from the time it takes to go to the library, find the volume, photocopy the article, and return to the office, as 15 minutes. We then estimate that reading an abstract, a reference list, or a citation history saves of the full article time, or 5 minutes, and we arbitrarily assign a one minute time savings to each query.
We can now estimate the impact of ADS, in terms of FTE (Full Time Equivalent, 2000 hour) research years, by examining the ADS usage logs. We note that about half of the full text articles currently retrieved via the ADS come from the on-line journals, which certainly deserve credit for their work. Also we are ignoring several important (but hard to quantify) aspects of the ADS service, such as links from other web sites (e.g. the HTML journals), the synergy of joint ADS/SIMBAD and ADS/NED queries (e.g. that in figure 1), the bulk retrieval of abstracts and LATEX formatted references (about 200,000 per month), and the more than 10,000,000 references returned each month. We think that what follows is a reasonable estimate of the impact of the ADS on astronomy, and that the impact of the full Urania collaboration is substantially more.
Using the March 1999 worldwide combined ADS logs there were 113,471 full text articles retrieved, 195,026 abstracts (individually selected), 10,663 citation histories, and 3,702 reference pages retrieved, and 582,836 queries made. Using the estimated time savings above we find that the impact of the ADS on astronomy is 333 FTE research years per year, approximately the same as the entire Harvard-Smithsonian Center for Astrophysics.
If we crudely estimate that there are 10,000 FTE research years in astronomy each year the ADS can be viewed as accounting for 3.33% of astronomy. Currently the ADS contains 27,712 (11,834) articles (refereed articles) in the astronomy database dated 1998, so one way of expressing the impact of the ADS would be 923 (394) articles (refereed articles) per year.
While the efficiencies brought about by the technologies inherent in the ADS and Urania are permanent, and will contribute (compounded) to the accelerating pace of discovery in astronomy, one can ask what was gained by being first. Risks were taken in funding the early development and adoption of technologies via the ADS and Urania. Also, had nothing been done, the “winning” technologies would eventually be adopted with very little risk.
To judge the payoff we adopt a simple model; we assume that the increase in research efficiency due to the ADS has increased linearly from zero in 1993 to 333 FTE research years in 1999, and that it will decrease linearly to zero over the next six years, after which there will be no difference in the technologies employed.
This yields a sum impact from the early creation of the ADS of 2,332 FTE research years, which is 23% of the astronomical research done in a single year, or 6463 (2760) papers (refereed papers). This is surely equal to the impact of the very largest and most successful projects. Doing this analysis for the entire Urania would yield a substantially increased amount.
8 Acknowledgments
Peter Ossorio is a pioneer in the field of automated text retrieval, he gave freely of his ideas in the early phase of the project. Geoff Shaw provided the enthusiasm to keep the Abstract Service project going during the long period of no funding.
Margaret Geller gave crucial encouragement at the time of the original prototype. Frank Giovane long believed in the possibilities of the Abstract Service, and acted as a friend in high places.
Todd Karakashian wrote much of the software at the time of the public release, he left in 1994. Markus Demleitner joined the ADS project in April 1999, he has already produced much of value.
There are about a dozen individuals at the Strasbourg Observatory, and the Strasbourg Data Center to thank, too many to thank individually. The data services provided by them are at the heart of the new astronomy; their collaboration with the ADS has been both very fruitful, and a great joy.
Peter Boyce, Evan Owens, and the electronic Astrophysical Journal project staff have had the vision necessary to do things first. Their collaboration has been important to the success of the ADS, and crucial to the success of Urania.
Without the long term support from NASA, and Günter Riegler in particular, the ADS would not now exist.
We are supported by NASA under Grant NCC5-189.
References
- Abt (1998) Abt, H. A. 1998, Is the Astronomical Literature Still Expanding Exponentially?, PASP, 110, 210
- Abt (1996) Abt, H. A. 1996, How Long Are Astronomical Papers Remembered?, PASP, 108, 1059
- Abt (1995) Abt, H. A. 1995, Changing Sources of Published Information, PASP, 107, 401
- Abt (1990) Abt, H. A. 1990. Editorial - style changes for most astronomical journals. ApJ, 357, 1
- Abt (1981) Abt, H. A. 1981, Long-Term Citation Histories of Astronomical Papers, PASP, 93, 207
- Accomazzi, et al., (1999) Accomazzi, A., Eichhorn, G., Grant, C.S., Kurtz, M.J., & Murray, S.S. 2000, A&AS, (this issue) ARCHITECTURE
- Adorf & Busch (1988) Adorf, H.-M. & Busch, E.K. 1988, Intelligent access to a bibliographic full text database, Astronomy from Large Databases, ESO Conf. Proc. 28, eds F. Murtagh and A. Heck, p. 143
- Adorf, et al. (1988) Adorf, H.-M., Albrecht, R., Johnson. M.D., & Rampazzo, R. 1988, Towards heterogeneous distributed very large Databases, ESO Conf. Proc. 28, eds F. Murtagh and A. Heck, p. Astronomy from Large Databases, ESO Conf. Proc. 28, eds F. Murtagh and A. Heck, p. 137
- Anderson (1948) Anderson, J. A. 1948 Optics of the 200-inch Hale Telescope, PASP, 60, 221
- A&A (1992) A&A 1992, List of Keywords Common to A&A, ApJ, and MNRAS, A&A, 253, A12
- Belkin, et. al (1995) Belkin, N.J., Kantor, P., Fox, E.A., and Shaw, J.A. 1995, Combining the Evidence of Multiple Query Representations for Information Retrieval, Information Processing and Management 31, 431.
- Banse et al. (1983) Banse, K., P. Crane, P. Grosbol, F. Middleburg, C. Ounnas, D. Ponz and H. Waldthausen 1983. MIDAS - ESO’s new image processing system. The Messenger 31, 26-28
- Bardeen et al. (1986) Bardeen, J. M., Bond, J. R., Kaiser, N., & Szalay, A. S. 1986, The statistics of peaks of Gaussian random fields, ApJ, 304, 15
- Benn & Martin (1995) Benn, C. & Martin, R. 1995, Electronic Mail Directory. World Astronomical Community, Greenwich, UK: Royal Greenwich Observatory
- Berners-Lee (1994) Berners-Lee, T. 1994, The World-Wide Web, Communications of the ACM, 37, 76
- Boyce (1991) Boyce, P.B. 1991 unpublished talk given at the meeting “On-Line Astronomy Documentation and Literature,” 20-21 March 1991
- Boyce (1995) Boyce, P. B. 1995, The Electronic ApJ Letters, American Astronomical Society Meeting, 187, 3801
- Boyce (1996) Boyce, P. 1996, Journals, Data and Abstracts Make an Integrated Electronic Resource, American Astronomical Society Meeting, 189, 0603
- Bromley (1994) Bromley, B. C. 1994, Large-scale structure of the universe: a clustering analysis, Ph.D. Thesis, Dartmouth College
- Burton and Kebler (1960) Burton, R.E. & Kebler, R.W. 1960, The “half-life” of some scientific and technical literatures, American Documentation, 11, 18
- Corbin & Coletti (1995) Corbin, B. G.& Coletti, D. J. 1995, Digitization of Historical Astronomical Literature, Vistas in Astronomy, 39, 161
- Crawford (1965) Crawford, D.L. 1965 The Kitt Peak 150-inch Telescope, Sky & Telescope, 29, 268
- Davis & Peebles (1983) Davis, M. & Peebles, P. J. E. 1983, A survey of galaxy redshifts. V - The two-point position and velocity correlations, ApJ, 267, 465
- Demleitner, et al. (1999) M. Demleitner, A. Accomazzi, G. Eichhorn, C.S. Grant, M.J. Kurtz,& S.S. Murray, 1999, Looking at 3,000,000 References Without Growing Grey Hair, American Astronomical Society Meeting, 195, 8209
- Egret & Wenger (1988) Egret, D. & Wenger, M. 1988, SIMBAD - present status and future, Astronomy from Large Databases, ESO Conf. Proc. 28, eds F. Murtagh and A. Heck, p. 323
- Eichhorn, et al. (1999) Eichhorn, G., Kurtz, M.J., Accomazzi, A., Grant, C.S., & Murray, S.S. 2000 A&AS (this issue) SEARCH
- Eichhorn et al. (1997) Eichhorn, G., Kurtz, M. J., Accomazzi, A.,& Grant, C. S. 1997, Historical Literature in the ADS, American Astronomical Society Meeting, 191, 3502
- Eichhorn et al. (1994) Eichhorn, G., Kurtz, M. J., Accomazzi, A., Grant, C. S.,& Murray, S. S. 1994, Full Journal Articles in the ADS Astrophysics Science Information and Abstract Service, American Astronomical Society Meeting, 185, 4104
- El-Ad & Piran (1997) El-Ad, H. & Piran, T. 1997, Voids in the Large-Scale Structure, ApJ, 491, 421
- Fomalont (1981) Fomalont, E. 1981. Astronomical Image Processing System / AIPS. NRAO Newsletter no. 3, p. 3, Charlottsville:NRAO
- Garfield (1979) Garfield, E., 1979, Citation Indexing: Its Theory and Application in Science, Technology, and Humanities. New York: John Wiley
- Genova et al. (1998) Genova, F., Bartlett, J. G., Bonnarel, F., Dubois, P., Egret, D., Fernique, P., Jasniewicz, G., Lesteven, S., Ochsenbein, F. & Wenger, M. 1998, The CDS Information Hub, ASP Conf. Ser. 145: Astronomical Data Analysis Software and Systems VII, 7, 470
- Good (1992) Good, J. C. 1992, Overview of the Astrophysics Data System (ADS), ASP Conf. Ser. 25: Astronomical Data Analysis Software and Systems I, 1, 35
- Grant, et al. (1999) Grant, C.S., Accomazzi, A., Eichhorn, G., Kurtz, M.J. & Murray, S.S. 2000 A&AS (this issue) DATA
- Grant, Kurtz & Eichhorn (1994) Grant, C. S., Kurtz, M. J.,& Eichhorn, G. 1994, The ADS Abstract Service: One Year Old, American Astronomical Society Meeting, 184, 2802
- Greisen (1998) Greisen, E.W. 1998, The Creation of AIPS, AIPS Memo no. 100, Charlottsville:NRAO
- Gupta (1990) Gupta, U. 1990, Obsolescence of Physics Literature: Exponential Decrease of the Density of Citations to Physical Review Articles with Age, Journal of the American Society for Information Science, 41, 283
- Helou & Madore (1988) Helou, G. & Madore, B. 1988, A new extragalactic database, Astronomy from Large Databases, ESO Conf. Proc. 28, eds F. Murtagh and A. Heck, p. 335
- Jung (1971) Jung, J. 1971 Report on the Strasbourg Stellar data Center, Bull. Info. Centre de Données Stellaires, 1, 2
- Jung, Bischoff, & Ochsenbein (1973) Jung, J., Bischoff, M., & Ochsenbein, F. 1973 The catalog of stellar identifications, Bull. Info. Centre de Données Stellaires, 4, 27
- Kurtz et al. (1996) Kurtz, M. J., Eichhorn, G., Accomazzi, A., Grant, C. S.,& Murray, S. S. 1996, Journal Citations: An ADS-AAS Collaboration, American Astronomical Society Meeting, 189, 0607
- Kurtz et al. (1993) Kurtz, M. J., Karakashian, T., Grant, C. S., Eichhorn, G., Murray, S. S., Watson, J. M., Ossorio, P. G., & Stoner, J. L. 1993, Intelligent Text Retrieval in the NASA Astrophysics Data System, ASP Conf. Ser. 52: Astronomical Data Analysis Software and Systems II, 132
- Kurtz (1992) Kurtz, M. J. 1992, Advice from the Oracle: Really Intelligent Information Retrieval, Invited paper in Adding Intelligence to Information Retrieval: The Case of Astronomy and Related Space Science, eds. F. Murtagh and A. Heck, Kluwer, p. 21
- Kurtz (1991) Kurtz, M.J. 1991 unpublished talk given at the meeting “On-Line Astronomy Documentation and Literature,” 20-21 March 1991
- Kurtz, Mussio & Ossorio (1990) Kurtz, M. J., Mussio, P.,& Ossorio, P. G. 1990, A cognitive system for astronomical image interpretation, Pattern Recognition Letters, 11, 507
- Kurtz (1988) Kurtz, M. J. 1988, The search for structure - Object classification in large data sets, Astronomy from Large Databases, ESO Conf. Proc. 28, eds F. Murtagh and A. Heck, p. 113
- Lee, Dubin & Kurtz (1999) Lee, J., D. S. Dubin and M. J. Kurtz 1999. Co-occurrence Evidence for Subject Vocabulary Reconciliation in ADS Databases. Astronomical Data Analysis Software and Systems VIII, ASP Conference Series, Vol. 172. Ed. David M. Mehringer, Raymond L. Plante, and Douglas A. Roberts. p. 287
- Lee & Dubin (1999) Lee, J,. & Dubin, D.S. Context-Sensitive Vocabulary Mapping with a Spreading Activation Network, in Proceedings of the 1999 ACM SIGIR Conference on Research and Development in Information Retrieval, eds. Hearst, M. and Gey, F. and Tong, R., Association for Computing Machinery:New York, pp. 198-205.
- Line (1993) Line, M.B., 1993, Changes in the use of the literature with time - obsolescence revisited, Library Trends, 49, 665
- Madore et al. (1992) Madore, B. F., Helou, G., Corwin, H. G., J.., Schmitz, M., Wu, X.,& Bennett, J. 1992, The NASA/IPAC extragalactic database, ASP Conf. Ser. 25: Astronomical Data Analysis Software and Systems I, 40
- McGlynn & White (1998) McGlynn, T. & White, N. 1998, Astrobrowse: A Multi-site, Multi-wavelength Service for Locating Astronomical Resources on the Web, ASP Conf. Ser. 145: Astronomical Data Analysis Software and Systems VII, 481
- MNRAS (1992) MNRAS 1992, List of Keywords Common to A&A, ApJ, and MNRAS, MNRAS, 259, end note
- Murray (1991) Murray, S.S. 1991 unpublished talk given at the meeting “On-Line Astronomy Documentation and Literature,” 20-21 March 1991
- Murtagh (1995) Murtagh, F. 1995, http://www.eso.org/hst-prop-abs-search.html
- NASA-STI (1988) NASA STI Branch 1988, NASA Thsaurus Astronomy Vocabulary, NASA Report SP-7069
- Ossorio & Kurtz (1989) Ossorio, P. G.& Kurtz, M. J. 1989, Automated classification of resolved galaxies, Data Analysis in Astronomy, 121
- Ossorio (1966) Ossorio, P.G. 1966, Classification space: a multivariate procedure for automatic document indexing and retrieval, Multivariate Behavioral Research, 1, 479
- Ortiz, et al. (1999) Ortiz, P.F., Ochsenbein, F., Wicenec, A., & Albrecht, M. 1999, ESO/CDS Data-mining Tool Development Project, ASP Conf. Ser. 172: Astronomical Data Analysis Software and Systems VIII, 379
- Pinelli (1990) Pinelli, T.E. 1990, National Aeronautics and Space Administration scientific and technical information programs, Special Issue of Government Information Quarterly, 7, 123
- Plante, Crutcher, & Sharpe (1996) Plante, R. L., Crutcher, R. M., & Sharpe, R. K. 1996, The NCSA Astronomy Digital Image Library, ASP Conf. Ser. 101: Astronomical Data Analysis Software and Systems V, 581
- Postman (1996) Postman, M. 1996, Distribution to the Astronomy Community of the Compressed Digitized Sky Survey, Space Telescope Science Inst Report
- Redner (1998) Redner, S. 1998, How Popular is your paper? An empirical study of the citation distribution, European Physics Journal B, 4, 131
- Rood (1988) Rood, H. J. 1988, Voids, ARA&A, 26, 245
- Rule (1948) Rule, B. 1948 Engineering Aspects of the 200-inch Hale Telescope, PASP, 60, 225
- Salton and McGill (1983) Salton, G., & McGill, M.J. 1983, “Introduction to modern information retrieval,” New York: McGraw-Hill
- Schmitz et al. (1995) Schmitz, M., G. Helou, P. Dubois, C. Lague, B. Madore, H. G. J. Corwin and S. Lesteven 1995. A Uniform Bibliographic Code. Vistas in Astronomy 39, 272
- Schulman et al. (1997) Schulman, E., French, J. C., Powell, A. L., Eichhorn, G., Kurtz, M. J. & Murray, S. S. 1997, The Relative Effectiveness of Astronomy Journals, PASP, 109, 1278
- Shobbrook & Shobbrook (1993) Shobbrook, R. M. & Shobbrook, R. R. 1993, The Astronomy Thesaurus, Version 1.1, edited by Shobbrook, Robyn M.; Shobbrook, Robert R., Epping: Anglo-American Observatory
- Shobbrook & Shobbrook (1992) Shobbrook, R. M. & Shobbrook, R. R. 1992, The I.A.U. thesaurus for improved on-line access to information, Proceedings of the Astronomical Society of Australia, 10, 134
- Squibb & Cheung (1988) Squibb, G.F., & Cheung, C.Y. 1988, NASA astrophysics data system (ADS) study, Astronomy from Large Databases, ESO Conf. Proc. 28, eds F. Murtagh and A. Heck, p. 489
- van Steenberg (1991) Van Steenberg, M. 1991 unpublished talk given at the meeting “On-Line Astronomy Documentation and Literature,”20-21 March 1991
- Stetson (1987) Stetson, P. B. 1987, DAOPHOT - A computer program for crowded-field stellar photometry, PASP, 99, 191
- Tody (1986) Tody, D. 1986, The IRAF Data Reduction and Analysis System, in Instrumentation in Astronomy VI, SPIE Conf. 627, 733
- Tsay (1998) Tsay, M.Y. 1998, Library journal use and citation half life in medical science, Journal of the American Society for Information Science, 49, 1283
- Warnock et al. (1993) Warnock, A., Van Steenberg, M. E., Brotzman, L. E., Gass, J. E., Kovalsky, D.,& Giovane, F. 1993, STELAR: An Experiment in the Electronic Distribution of Astronomical Literature , ASP Conf. Ser. 52: Astronomical Data Analysis Software and Systems II, 137
- Watson (1988) Watson, J.M., (J.M. Rey-Watson) 1988, Access to astronomical literature through commercial Databases, Astronomy from Large Databases, ESO Conf. Proc. 28, eds F. Murtagh and A. Heck, p. 453
- Wente (1990) Wente, V.A. 1990, Scientific and technical information management, Government Information Quarterly, 7, 149
- White & McCain (1989) White, H.D. & McCain, K.W. 1989, Bibliometrics, Annual Review of Information Science and Technology, 24, 119
- White (1992) White, N. E. 1992, A Multimission Database and Analysis Environment, ASP Conf. Ser. 25: Astronomical Data Analysis Software and Systems I, 52
- Zipf (1949) Zipf, G.K. 1949, Human Behavior and the Principle of Least Effort, Cambridge: Addison-Wesley