Nearby Gas-Rich Low Surface Brightness Galaxies
Abstract
We examine the Fisher–Tully km s-1 galaxy sample to determine whether it is a complete and representative sample of all galaxy types, including low surface brightness populations, as has been recently claimed. We find that the sample is progressively more incomplete for galaxies with (1) smaller physical diameters at a fixed isophote and (2) lower HI masses. This is likely to lead to a significant undercounting of nearby gas-rich low surface brightness galaxies. However, through comparisons to other samples we can understand how the nearby galaxy counts need to be corrected, and we see some indications of environmental effects that probably result from the local high density of galaxies.
1 Introduction
Two of the key questions in 20th century extragalactic studies have concerned the density and the composition of the galaxy population in the Universe. Our knowledge of galaxy types and their abundance depends critically on the issue of completeness of our galaxy catalogs. Since our current catalogs are constructed by various observational means, they are, by definition, limited by natural and technological selection effects.
Recently, Briggs (1997a) has argued that the Fisher & Tully (1981, F–T) catalog of nearby galaxies is complete to its redshift and sensitivity limits, even for low surface brightness (LSB) galaxies. F–T examined HI emission from a sample of 1787 angularly large galaxies accessible from the Green Bank radio telescopes. They believed the sample to be very complete for late-type galaxies within a redshift of km s-1, with angular diameters larger than 3′, located in regions at and . Briggs additionally found a sensitivity limit depending on the HI mass and defined the F–T “completeness zone” as extending out to:
| (1) |
The form of the limit for sources with masses smaller than 111We adopt km s-1 Mpc-1 for masses and distances quoted hereafter, and we use the heliocentric velocity corrected by 300 km s as in F–T and Briggs. was based on a semi-analytic, semi-empirical fit to the HI sensitivity.
Briggs pointed out that surveys of low surface brightness galaxies (Schneider et al. 1990; Schombert et al. 1992; Matthews & Gallagher 1996; Impey et al. 1996) have identified sources that are primarily at larger distances, but they have added very few within the F–T “completeness zone.” He concluded that LSB galaxies “must already be fairly represented by nearby, previously cataloged examples.”
This is an interesting idea, but the conclusion does not necessarily follow from the analysis for several reasons: (1) For sources with low HI masses is so small that redshift distances are very uncertain and Galactic HI emission creates strong confusion. A further objection to Briggs’ analysis is that (2) the F–T sources are themselves incomplete within Briggs’ “completeness zone” because of angular size selection effects. Lastly, (3) the km s-1 region around the Local Group has about twice the average galactic density and therefore is not a very representive sample of the Universe as a whole.
In a companion paper, Briggs (1997b) used the F–T and LSB samples to derive an HI mass function. He commented on the need for corrections for incompleteness and noted the usefulness of a test for establishing whether the LSB samples were complete, but he did not discuss the problems the F–T sample has in this regard. In this paper we explore the limitations of the F–T sample and discuss how it and more recent surveys may be properly used to understand the composition of galaxy populations. We show that the local samples of galaxies display morphological segregation characteristics associated with high density environments. Finally, we find that in all HI mass ranges the dominant class of galaxies are those with the smallest angular diameters at the isophotal limits of the original Palomar Sky Survey (PSS-I). These galaxies may be physically small or appear small because they are LSB systems; in either case, they are greatly under-represented in the F–T sample and most other optical surveys.
2 Completeness Tests of the F–T Sample
The incompleteness of the F–T sample can be demonstrated using a test. This test compares the distance of a detected source to the maximum distance at which it should be detectable. If the maximum distance is correctly estimated, a source is equally likely to fall anywhere within the volume delimited by . On average, then, sources will be found halfway into the maximum volume, and will average 0.5 (Schmidt 1968). For a sample of sources, the probability distribution of the mean value of has a nearly normal distribution with standard deviation .
We assume the distance is proportional to the redshift , so that . We exclude galaxies within of the center of the Virgo cluster or of the Fornax cluster from the km s-1 sample. This eliminates the worst distance estimates, although peculiar velocities clearly must affect the rest of the sample as well. We have tested how adjustments for peculiar velocity might alter our results using the model of Dekel, Bertschinger, and Faber (1990), and find no substantive changes from the results presented below, although the samples generally have somewhat lower values of . We use the redshift corrected for Local Group motion here to maintain consistency with F–T and Briggs.
With , the mean value of is . Values below 0.5 imply that galaxies were detected preferentially in the nearer portion of the survey volume, suggesting that the sample is not fully sensitive to sources out to .
A low value of can alternatively be caused by an actual clustering of galaxies nearby us. However, this tends to be counter-balanced by the effects of morphological segregation and gas depletion, which would favor HI detections in lower-density environments. In any case, the F–T sample is mostly confined to within the local supercluster, and it is not clear that there is an overall radial gradient within the sampled region. Moreover, these effects do not explain the dependence of on HI mass.
.3in All Sample 1. F–T in “completeness zone” 320 41 171 108 2. full sensitivity to 190 15 69 106 3. restricted to 141 1 43 97 4. restricted to 217 8 103 106 5. D+LSB in “completeness zone” 189 52 116 21 6. restricted to 161 36 104 21 7. F–T () and D+LSB combined 295 54 162 79 8. restricted to 172 6 88 78 9. restricted to 270 40 151 79
In Table 1 we list the results for various galaxy samples and divide each sample into three mass ranges.222While the upper and lower mass ranges are unbounded on one side, the range of detected masses is approximately one decade in both cases. Sample 1 shows that the F–T sample in the “completeness zone” exhibits worse and worse completeness for lower mass galaxies.
Using Briggs’ functional form (eqn. 1) for the completeness limit, we could increase the minimum mass for full-volume sensitivity from to to make close to 0.5 in all mass ranges (sample 2 in Table 1). This revised limit would set the completeness zone limit to km s-1 for so that distance uncertainty and confusion with Galactic HI would present significant problem for an even larger portion of the sample. In addition, within such small redshifts is probably biased upward, since the lowest redshift sources may be lost in Galactic emission and sources detected at redshifts below km s-1 were set to that value for the purpose of estimating their distances. These limitations make the F–T sample highly problematic for trying to understand properties of galaxies with HI masses .
3 Angular Size Limitations of Optical Samples
Another approach to understanding the completeness of the F–T sample is to examine the source selection criteria. F–T used a minimum angular size as their primary selection criterion—examining spirals with diameters and Sd–Im galaxies with as determined in the UGC (Nilson 1973). Because other sources of angular diameters were also used for parts of the sample, some smaller galaxies were also observed. To place all of the angular sizes on a common system, we use the formulas from F–T to convert to the UGC scale.
Based on the expected increase of counts with angular diameter as , the full sample of observed galaxies (whether or not they were detected in HI) begins to be incomplete for angular sizes (Fig. 1). At there are too few galaxies relative to the larger sources. This incompleteness at small angular sizes is partly intentional, since F–T excluded small angular diameter galaxies that they expected would be distant. Unfortunately, this also introduces a degree of subjectiveness to inclusion in the sample.
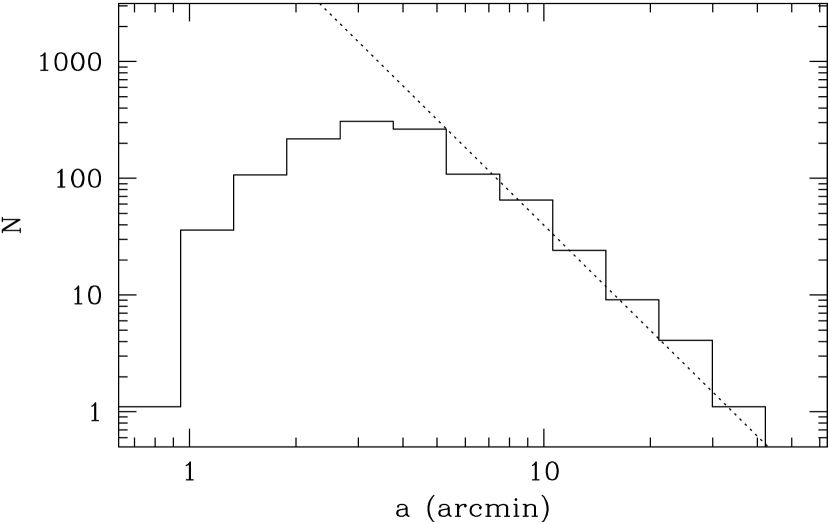
Even among the F–T galaxies in Briggs’ “completeness zone,” many of the galaxies have angular sizes so small that they would not have remained in the sample if they were at their maximum distance within the zone. The angular size a source would have at is . Of the 41 sources with , none has ; only one is , the stated completeness limit of F–T; and only 8 have . Even among the 171 intermediate mass sources, with , only 7%, 25%, and 60% galaxies have , , and respectively. Only the high mass sources are large enough that high fractions pass the requirement—74%, 90%, and 98% for , and . Clearly this will tend to push to lower values since some galaxies are included only in the near portion of the search volume.
To make a more uniform selection we can restrict the F–T sample to (sample 3), in the intermediate and high mass ranges is below 0.5 only marginally (1.3 and 1.0 ), but the low mass range cannot be tested since it has only one galaxy. Restricted to (sample 4) the F–T sample does not pass the test in either the low or intermediate mass ranges.
One way of addressing the omission of small galaxies is to look to samples of small galaxies. In particular the “dwarf and LSB” (D+LSB) sample of galaxies from Schneider et al. (1990, 1992) contains HI measurements for late-type, dwarf, and irregular galaxies down to a diameter. Since this sample is drawn from the UGC, it covers only the northern sky (), but when supplemented with HI measurements from the literature (Huchtmeier & Richter 1989) the HI detections are more than 85% complete.
The test results for the D+LSB sample within Briggs’ “completeness zone” are given in Table 1 (sample 5). The low-mass ranges still do not pass the test, but they fare considerably better than the F–T sample. By restricting the galaxies to , which eliminates galaxies that only meet the UGC size criterion because they are very nearby (sample 6), the test is passed to within in all mass ranges. This also shows that large scale structure is not causing low test results for the F–T sample.
We can combine the F–T and D+LSB samples in the hope of forming a complete sample of all types of galaxies as Briggs (1997b) did. In the northern sky we find 248 F–T galaxies and 47 additional D+LSB galaxies that satisfy the “completeness zone” criteria. This expanded sample fares only marginally better in the tests, yielding for the full sample, and in the separate mass ranges (Table 1, sample 7). Restricting does not generate samples that pass the test either.333Restricting the samples to high Galactic latitudes () made no appreciable difference to the results presented in Table 1.
We conclude that the F–T sources with high HI masses represent a relatively complete sample, but the sources with low HI masses are strongly biased to low redshifts. The problem with low mass galaxies may be caused in part by the F–T angular size criterion. However, even when the F–T sample is (1) restricted to minimum physical diameters to make the galaxies relatively uniform within the “completeness zone,” or (2) supplemented by galaxies from other surveys, the galaxies with HI masses still fail the test. This demonstrates that the F–T sample does not provide a good basis for forming a representative cross section of galaxy types.
4 High Mass LSB Galaxies
While galaxies with high HI masses () in the F–T sample pass the test, this is really only an internal check on the self-consistency of the database. To examine the broader question of how representative the F–T sample is, Briggs (1997a) asked whether surveys of LSB galaxies had found galaxies within the “completeness zone.” However, since these other surveys were also based on visual examination of photographic plates, they do not provide a genuinely independent check of the F–T sample. Moreover, since the local density of galaxies is higher than average, classes of galaxies that avoid high density may not be present.
The question we consider here is whether there are massive HI sources in deeper surveys that would have been excluded from the F–T sample because their isophotal diameters at the PSS-I surface brightness would be less than 3–4′ at the 1000 km s-1 redshift limit for high mass galaxies in the “completeness zone.” This is difficult to quantify precisely since diameters estimated from the PSS-I are somewhat variable in their effective depth, but we will adopt the mean isophotal level found by Cornell et al. (1987) of mag arcsec-2 at for UGC diameters.
The F–T subset of high-mass galaxies are almost all physically large at . Figure 2 shows the distribution of for this (solid-line histogram) and other samples of galaxies. Since all of the high mass galaxies are detectable to the 1000 km s-1 redshift limit, corresponds to 3.88 kpc. Thus 90% of the F–T high mass galaxies have sizes larger than 11.6 kpc. Note that we restrict the following analyses to galaxies at high Galactic latitudes where interstellar extinction should not much affect the galaxies’ optical sizes or number counts. 444Briggs (1997ab) specifies that his samples are restricted to high latitudes, but the numbers of galaxies he quotes in various subsamples indicate he was using the full sky coverage of F–T.
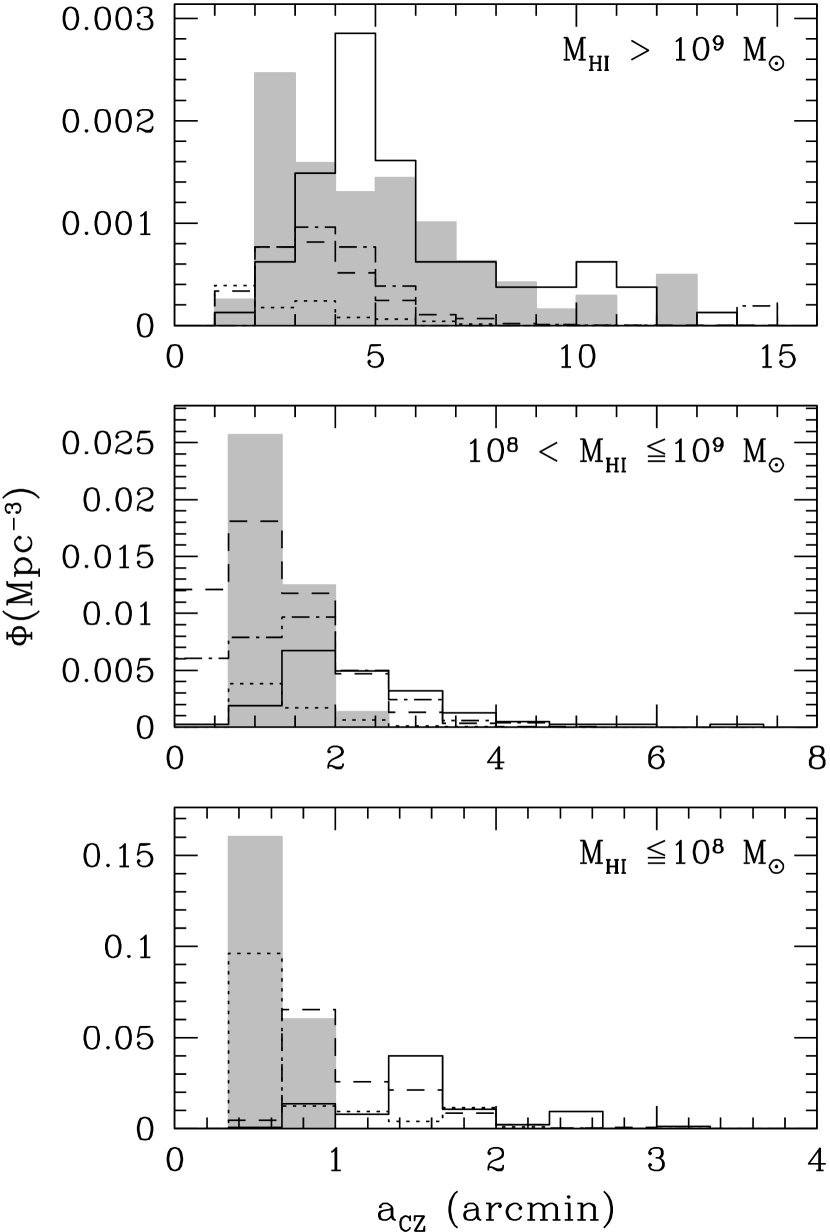
We give the estimated number density of each size of galaxy in the figure based on the areal coverage of the sample (5.1 sr for the high-latitude portion of the F–T sample). We also need to account for the local overdensity of galaxies when making comparisons to other samples. Briggs (1997b) estimates the region inside km s-1 has a density about a factor of 2 above average. This matches our results for the D+LSB sample, which has a density 2.1 times higher in the nearby portion. Densities in Fig. 2 that are based on the F–T sample and other samples restricted to the local region are divided by 2.
The “HI-Slice” sample of Spitzak & Schneider (1998) was found by systematically observing 55 sq deg of the sky at 21 cm from Arecibo, and is unbiased by optical sizes. This survey contains 62 sources with . We have determined the angular sizes at from the original -band photometric profile fits of Spitzak & Schneider. Compared to the F–T sample, these galaxies have lower percentages of optically large galaxies, and higher percentages of small galaxies, although there appear to be very few galaxies smaller than 7.8 kpc in either sample.
Using the sensitivity limit estimates from Schneider, Spitzak, & Rosenberg (1998), we can determine the volume within which each of the HI-Slice galaxies was detectable in order to estimate its number density in space. The results are shown in Fig. 2 by the solid-gray histogram. We estimate that 75% of the HI among these massive galaxies is associated with galaxies larger than . Assuming the F–T sample is complete for these largest galaxies, the smaller fraction of galaxies it finds at smaller sizes implies it is missing about 23% of high-mass galaxies and 12% of the total HI due to the angular size limitations.
Several differences between the samples may reflect environmental influences. The distribution of F–T galaxy sizes in Fig. 2 suggests that the population has been shifted to systematically larger sizes than the HI-Slice galaxies. In addition, the HI-selected sample has less -band luminosity relative to the HI mass on average, based on optical data from Spitzak & Schneider and the RC3 (de Vaucouleurs et al. 1991), and 40% of the HI-selected galaxies have (in solar units) compared to 11% of the F–T galaxies. Since the F–T sample is located in a region of high galaxy density, star formation induced by galaxy interactions may explain these differences.
By contrast, optically-selected samples, even of LSB galaxies, rarely identify high HI mass objects that would not have been identified in Briggs’ “completeness zone.” If we impose no HI-mass/redshift restrictions, the D+LSB sample (§3) contains 586 high-HI-mass sources with , and it has even higher fractions of large- galaxies than the F–T sample. This suggests that almost all UGC galaxies with large HI masses have large physical dimensions at .
However, the raw distribution of in an angular-diameter limited sample is not a good indicator of the population size distribution since galaxies with smaller physical diameters at remain larger than (the UGC limit) out to smaller distances. Dividing the counts by the volume in which each galaxy remains larger than , the distribution has a similar shape to the HI-selected sample (dashed-line histogram in Figure 2). These galaxies also appear to have distinctly different properties from galaxies in the F–T sample—their -band luminosities relative to their HI masses are similar to the HI-selected sample of sources.
The distribution of sizes of the subset of D+LSB galaxies within km s-1 is shown by a dot-dash line. The counts have been divided by 2 (like the F–T sample) and demonstrate that the density correction used earlier is reasonable. The nearby D+LSB galaxies show a slight shift toward larger sizes than the full sample. This indicates that the distribution of sizes in a sample of late-type galaxies alone is little-affected by the local density enhancement. By contrast, the F–T and HI-selected samples contain a wide range of morphological types. Since earlier-type galaxies tend to be larger at the same isophotal level, the shift in the size distribution to larger within the F–T sample may reflect the effects of morphological segregation, with a larger proportion of earlier types than an average sample.
Within the northern portion of the “completeness zone” the D+LSB sample adds only 1 high-mass galaxy to the F–T sample, so the size distribution of the combined sample is basically unchanged. The lack of additional small angular diameter galaxies supports the idea that the local population is different from samples drawn from a wider variety of environments.
The PSS-II survey of Eder & Schombert (1999) is a deeper probe for small diameter, very late-type galaxies. These objects were selected from 50 PSS-II plates (0.7 sr) to be larger than 20′′ and to have dwarf-like morphologies. We have determined the sizes on the PSS-I for each of these objects; our size estimates are consistent for galaxies in common with the UGC. The size distribution turns over below diameters of 0.4′ at , which we take to be the effective completeness limit.
While aimed primarily at identifying dwarf galaxies, the PSS-II sample includes 135 galaxies with . Their size distribution is shown by a dotted line in Fig. 2. Only 7 of these objects are smaller than , but based on their angular size distance limits, such small sources comprise about half of the population of high mass LSB objects with very late type morphologies.
Extremely high HI mass LSB systems like Malin 1 (Bothun et al. 1987) might have been missed in the nearby volume of space because their disks are so faint that even the central extrapolated surface brightness of the disk is fainter than . However, the bulge component of Malin 1 would reach at about at km s-1. We can speculate that a system like Malin 1 might have been identified as an E or S0 in the UGC, and therefore omitted from consideration for the F–T sample. It is worth noting that a number of early-type galaxies have been found with extended distributions of HI (Van Driel & Van Woerden 1991; DuPrie & Schneider 1996), and perhaps these are the more appropriate comparison to Malin 1. For other giant disk systems that have been compared to Malin 1, like F568-6 (Bothun et al. 1990) and 1226+0105 (Sprayberry et al. 1993), the disk surface brightness and size would make these objects easily exceed , and should thus have been included in the F–T sample if they were in the “completeness zone.”
In summary, high-HI-mass galaxies are relatively well-sampled by F–T, but they do miss an interesting fraction of galaxies that have small sizes at the PSS-I isophotal limit. Based on intrinsic differences in the optical-to-21 cm emission from the nearby F–T sample versus more-distant samples, we suggest that the high density of galaxies in the local environment may cause differences in the local population.
5 Low and Intermediate Mass Galaxies
Galaxies with less than of HI are highly incomplete in the F–T sample. Among the galaxies identified by F–T in this mass range, about half have , and only are larger than , so F–T’s adopted angular size constraints give rise to a fundamental limitation to the sample’s completeness. We illustrate here the degree of the incompleteness and attempt to extrapolate to the population of missing objects.
The distribution of sizes in the F–T sample among lower mass galaxies is shown in the bottom two panels of Fig. 2, divided into intermediate () and low () HI masses. Since declines for galaxies with HI masses (eqn. 1), the density is estimated from the corresponding volume. At , the distance limit and are 65% of their value for high-mass galaxies, and at they are 25% as big.
The HI-Slice sample of Spitzak & Schneider (1998) contains 3 low and 10 intermediate mass galaxies. Despite the small-number statistics, this sample clearly demonstrates that very small sizes are the norm among low-HI-mass galaxies as shown in Fig. 2. All of the sources are smaller than , and 5 of 6 sources with are smaller than . One relatively high mass source () has and is nearly invisible on the PSS-I.
The size-distribution of the HI-Slice galaxies is clearly different from the F–T sample, exhibiting a strong peak toward the smallest diameters. The lowest-mass source in the HI-Slice sample (#75 in Spitzak & Schneider) was not detected optically because of a foreground star, but it is certainly very small. Given its low potential detection volume, it would increase the estimated density of the smallest-size low-mass galaxies by more than a factor of six. Since its contribution is not included in the histogram, the density of very small low-mass galaxies may be substantially larger than shown.
The D+LSB sample contains 482 galaxies with . 22 of these galaxies have , ranging down to and physical diameters as small as 0.7 kpc at the UGC isophote. All 22 of these small galaxies fall within the F–T “completeness zone” but such galaxies would be overlooked even in the combined F–T and D+LSB samples if they were beyond the nearest portion of the zone.
Most of the D+LSB galaxies are larger than , but after adjusting for each source’s maximum detectable distance according to its angular size, we find the density distribution shown by the dashed-line histogram in Fig. 2. In the intermediate mass range this distribution is quite similar to the HI-Slice sample for galaxies with small diameters.
The portion of the D+LSB sample restricted to the “completeness zone” (24% of 394 galaxies) is again shown with a dot-dash histogram in Fig. 2. The size distribution of these galaxies begins to resemble that of the F–T sample even though small- galaxies would be easier to detect nearby. This suggests again that the nearby volume of space is atypical.
All three of the low-mass HI-Slice galaxies and 92% of the 88 low-mass D+LSB galaxies have redshifts below km s-1, although most are outside the “completeness zone” distance limit at these masses. We have divided the densities of the low-mass D+LSB galaxies by a factor of 2 as we did for the F–T sample since it mostly probes the same volume of space. The HI-Slice sample density estimates are already adjusted for the local large-scale structure in the direction of that survey (Schneider et al. 1998).
We estimate the space density of small, LSB galaxies based on 23 low-mass and 77 intermediate-mass galaxies that are larger than in the PSS-II sample of Eder & Schombert (1999). Most of the low-mass galaxies are within km s-1, so the densities should perhaps be divided by 2; however, the sample is partially incomplete for the smallest sizes, so the densities may be underestimated. The densities (dotted histogram in Fig. 2) assume that sources were detectable out to the distance where their angular diameter would reach .
The lowest-mass galaxy in the Eder & Schombert LSB sample (D634-3) was not included in the density estimates. For this galaxy km s-1, so its distance and mass are quite uncertain. Taken at face value this source would imply a density of 0.7 Mpc-3 of very low-mass objects, comparable to the large density implied by the lowest-mass source in the HI-Slice sample.
In summary, optically-selected samples of galaxies only begin to indicate the prevalance of small-diameter galaxies as measured at the limiting isophotal depth of the PSS-I. Photographic surveys of galaxies with late-type morphologies can recover the density of objects with intermediate HI masses if the selection criteria are well-understood, but low mass galaxies present a much bigger challenge. Detections of two very small, low mass galaxies in an HI survey and an LSB survey imply that there may be a very large population of sources with , but the statistical uncertainties are too great to draw firm conclusions on this point.
6 Discussion
Optically selected samples favor optically bright galaxies. This truism holds even for diameter-limited galaxy surveys because LSB galaxies appear small at the surface-brightness limit of the optical images (Disney 1976). The HI-Slice survey (Spitzak & Schneider 1998), which is unbiased by galaxy diameter, indicates that the optically smallest galaxies are the most common. Current searches on deep photographic plates for small angular diameter sources (Eder & Schombert 1999) are also uncovering indications of this population. Such LSB and 21 cm surveys are successfully probing sources with HI masses down to , but for lower mass objects HI flux and angular size limitations of existing surveys allow detections of these sources to only a few Mpc.
Because of the small distances at which low mass and LSB sources are accessible, we need to consider the possible impact of the local environment on them. Although the large scale distribution of LSB galaxies appears similar to that of other galaxies (Mo, McGaugh and Bothun 1994), on scales of less than 2 Mpc their numbers drop off sharply. The most likely explanations are that either LSB disks are fragile and easily disturbed by other galaxies, or tidal interactions induce star formation that converts LSB galaxies into normal Hubble type objects. Regardless of the underlying cause why LSB galaxies avoid high density regions, this fact produces an expectation that the local region of space will be deficient in the number of LSB disk galaxies due to the large number of high mass spirals and the proximity to the very dense Virgo Cluster.
Other influences of the local environment may also play a role in the distribution of galaxy types. In high density regions, galaxies are often gas deficient for their morphological type because of stripping or evaporation, and morphological segregation favors earlier-type, less gas rich galaxies. Both of these effects would tend to lower the percentage of gas-rich systems nearby.
Briggs (1997a) asked “Where are the nearby gas-rich low surface brightness galaxies?” The answer depends on the mass range of objects being studied. There appears to be a local deficit of high-mass LSB systems, which is probably an environmental effect. The story for low-mass systems is less settled, because of the difficulty in detecting them to any significant distance, but it is clear there is a much larger population of small-optical-diameter galaxies than optical surveys have previously revealed. And finally, since these low-mass objects have not yet been detected beyond the local high-density environment, it is possible that they are even more profuse than they appear locally.
References
- (1) Bothun, G. D., Impey, C. D., Malin, D. F., Mould, J. R. 1987, AJ, 94, 23
- (2) Bothun, G. D., Schombert, J. M., Impey, C. D., & Schneider, S. E. 1990, ApJ, 360, 427
- (3) Briggs, F. H. 1997a, ApJ, 484, L29
- (4) Briggs, F. H. 1997b, ApJ, 484, 618
- (5) Cornell, M. E., Aaronson, M., Bothun, G., & Mould, J. 1987, ApJS, 64, 507
- (6) Dekel, A., Bertschinger, E., & Faber, S. M. 1990, ApJ, 364, 349
- (7) de Vaucouleurs, G., de Vaucouleurs, A., Corwin, H. C., Buta, R. J., Paturel, G., & Fouque, P. 1991, Third Reference Catalog of Bright Galaxies (New York: Springer)
- (8) Disney, M. J. 1976, Nature, 263, 573
- (9) DuPrie, K., & Schneider, S. E. 1996, AJ, 112, 937
- (10) Eder, J. A., & Schombert, J. M. 1999, in preparation
- (11) Fisher, J. R., & Tully, R. B. 1981, ApJS, 47, 139
- (12) Huchtmeier, W. K., & Richter, O. G. 1989, A General Catalog of HI Observations of Galaxies (Berlin: Springer-Verlag)
- (13) Impey, C. D., Sprayberry, D., Irwin, M. J., & Bothun, G. D. 1996, ApJS, 105, 209
- (14) Matthews, L. D., & Gallagher, J. S. 1996, AJ, 111, 1098
- (15) Mo, H. J., McGaugh, S. S., & Bothun, G. D. 1994, MNRAS, 267, 129
- (16) Nilson, P. 1973, Uppsala Astron. Obs. Ann. 6 (UGC)
- (17) Schmidt, M. 1968, ApJ, 151, 393
- (18) Schneider, S. E., Spitzak, J. G., & Rosenberg, J. L. 1998, ApJ, 507, L9
- (19) Schneider, S. E., Thuan, T. X., Magri, C., & Wadiak, J. E. 1990, ApJS, 72, 245
- (20) Schneider, S. E., Thuan, T. X., Mangum, J. G., & Miller, J. 1992, ApJS, 81, 5
- (21) Schombert, J. M., Bothun, G. D., Schneider, S. E., McGaugh, S. S. 1992, AJ, 103, 1107
- (22) Sprayberry, D., Impey, C. D., Irwin, M. J., McMahon, R. G., & Bothun, G. D. 1993, ApJ, 417, 114
- (23) Spitzak, J. G., & Schneider, S. E. 1998, ApJS, 119, 159
- (24) Van Driel, W., & Van Woerden, H. 1991, A&A, 243, 71