Simultaneous Measurements of X-Ray Luminosity and Kilohertz Quasi-Periodic Oscillations in Low-Mass X-Ray Binaries
Abstract
We measure simultaneously the properties of the energy spectra and the frequencies of the kilohertz quasi-periodic oscillations (QPOs) in fifteen low mass X-ray binaries covering a wide range of X-ray luminosities. In each source the QPO frequencies cover the same range of approximately Hz to Hz, though the sources differ by two orders of magnitude in their X-ray luminosities (as measured from the unabsorbed 2–50 keV flux). So the X-ray luminosity does not uniquely determine the QPO frequency. This is difficult to understand since the evidence from individual sources indicates that the frequency and luminosity are very well correlated at least over short timescales. Perhaps beaming effects or bolometric corrections change the observed luminosities, or perhaps part of the energy in mass accretion is used to power outflows reducing the energy emitted in X-rays. It is also possible that the parameters of a QPO model are tuned in such a way that the same range of frequencies appears in all sources. Different modes of accretion may be involved for example (disk and radial) or multiple parameters may conspire to yield the same frequencies.
1 Introduction
Many low mass X-ray binaries exhibit quasi-periodic oscillations (QPOs) in their persistent X-ray flux in the kilohertz range as revealed by the Rossi X-ray Timing Explorer (RXTE). There are currently 18 such sources with published results. Generally two kilohertz QPOs are observed simultaneously from a given system. In all cases, the QPOs are separated in frequency by about 250 to 350 Hz. The QPOs vary over a wide range in frequency. In 4U 0614+09, for example, the higher frequency QPO has been measured at frequencies between Hz and Hz (van Straaten et al. 2000). For reviews and references see van der Klis (1998) and http://www.astro.uva.nl/∼ecford/qpos.html.
The low mass X-ray binaries (LMXBs) which exhibit QPOs come in a wide variety. Most are persistent sources, but some transients are known with kilohertz QPOs: 4U 1608-52 (Berger et al. 1996; Méndez et al. 1998), Aql X-1 (Zhang et al. 1998a), and XTE J2123-058 (Homan et al. 1999; Tomsick et al. 1999). The two traditional classes of LMXBs, Z and atoll sources (Hasinger & van der Klis 1989), have very similar QPOs, though the QPOs in Z-sources tend to have larger widths and smaller rms fractions. The X-ray dipper 4U 1915-05 (Boirin et al. 2000) also has shown kilohertz QPOs. In all these systems, the kilohertz QPO frequencies are very similar, even though the inferred mass accretion rates differ by orders of magnitude (van der Klis 1997a, b).
Here we quantify these comparisons by considering the ensemble of sources. The main tool is a measurement of the X-ray luminosity in each system simultaneous with a determination of its kilohertz QPO frequencies. This approach is inspired by the strong correlation of QPO frequency and count rate in individual sources. This correlation is very strict on short time scales (e.g. 4U 1728-34; Strohmayer et al. 1996), though on longer timescales of days to weeks in some sources a single correlation no longer holds (e.g. 4U 0614+09, Ford et al. 1997a; Méndez et al. 1999, 4U 1608-52,). The same correlations are present if one considers X-ray flux instead of count rate (Ford et al. 1997b; Zhang et al. 1998a). The QPO frequencies are clearly influenced to some extent by the X-ray luminosity.
Correlations of luminosity and kilohertz QPO frequency provide a rather direct connection to QPO models. In most current models, the frequency of one of the QPOs is set by the orbital frequency of matter in the inner disk (Miller et al. 1998; Lai 1998; Stella & Vietri 1999; Osherovich & Titarchuk 1999). Higher QPO frequencies are the result of faster orbital frequencies which are in turn coupled to higher mass accretion rates.
In the following we present simultaneous measurements of kilohertz QPOs and energy spectra in LMXBs. Section 2 details the analysis procedure and results with special notes on each source. Section 3 discusses these results in context with current QPO models.
2 Analysis & Results
In this analysis we use data from the RXTE Proportional Counter Array (PCA), (Zhang et al. 1993). We consider fifteen sources with kilohertz QPOs, which includes all sources reported to date except XTE J2123-058, 4U 1915-05 and GX 349+2. These latter three sources have relatively few observations with kilohertz QPOs. For timing analysis, we construct Fourier power spectra from the high-time resolution modes of the PCA with Nyquist frequencies of typically 4096 Hz. We fit these power spectra for QPO features in roughly the 200–2000 Hz range. For intervals where a QPO is detected, we perform spectral fitting using the 16 sec resolution ‘Standard 2’ mode PCA data.
In the sources where the QPOs are strong (e.g. 4U 1608-52), the QPO features are significantly detected in a time interval of 64 sec or less. In these cases we have chosen representative intervals and performed the spectral fitting on the identical time interval where the QPOs are detected. In other sources (e.g. 4U 1705-44) many power spectra from short time windows must be added before the signal to noise improves to the level where the QPOs are detected. In such cases the spectra are well measured on much shorter time scales and we select an interval (typically 64 sec duration) in the middle of the interval where the QPOs are detected. There are no large count rate or color variations within these intervals so this procedure is accurate. In the case of Z sources, the QPO frequencies have been measured as a function of , the position along a track in the X-ray color–color diagram or hardness–intensity diagram (e.g. GX 17+2, Wijnands et al. 1997). In these cases we perform spectral fitting on matching intervals of , using the same observations where the timing analysis was performed.
In spectral fitting we use only the top of the three xenon/methane layers of the proportional counter units (PCUs) to reduce systematic effects. We also do not include events in the uppermost anticoincidence propane layer. We use all of the five PCUs when available, though in a few cases one or more PCUs were off, and we performed spectral fitting on the subset of detectors that was on. We use the background estimation tool pcabackest v2.1b, response matrix generator pcarsp v2.38 and the standard XSPEC v10.0 fitting routines. Since the response is not well calibrated at low energy we ignore standard mode 2 PCA channels 1–3 ( keV for gain epoch three: 15 April 1996 to 22 March 1999). We also ignore channels above 55 ( keV, gain epoch three) since the background dominates there even in the brighter sources. We have ignored the HEXTE data, since this provides no constraints on the spectral fit for the short intervals we consider here.
We have chosen to describe the continuum spectra in terms of the following model components: a power law, a blackbody, and a Gaussian line at roughly 6.4 keV, all absorbed with an equivalent hydrogen column density. This model, which is purely phenomenological, is often used in the literature (e.g. Christian & Swank 1997; White et al. 1988) but is not intended as a physically self-consistent representation of the physical processes at work. All the parameters of the models are allowed to float (though in some cases the width of the Gaussian line is fixed). The reduced values are close to one in all cases. There is no evidence for a roll-over at high energies, indicating that a power law is a sufficient description at least up to our cutoff energy of keV.
From the model fits we calculate several parameters, the most important here being the total flux from 2 to 50 keV. We report the unabsorbed flux, which is corrected for the effect of absorption at low energies by the interstellar medium and represents the actual flux emitted by the source. We take the unabsorbed 2–50 keV flux as some indication of the bolometric flux of the source, though it is an obviously flawed indicator since the spectra are unmeasured below 2 keV and above keV. Observations with the Beppo-SAX instruments, however, have good statistics over a much wider energy range (0.1 to 200 keV). Beppo-SAX observations of 4U 0614+09 (Piraino et al. 1999) and X1724-308 (Guainazzi et al. 1998) indicate that the model we employ here provides an accurate description of the spectra. In the 4U 0614+09 observations, Piraino et al. (1999) find an accurate fit to the spectrum with a blackbody at keV, a powerlaw with photon index 2.33 and a line at 0.71 keV that carries 1% of the total flux, all absorbed by an equivalent neutral hydrogen column of cm-2. This spectral description is similar to the one used here.
In reporting here the unabsorbed 2-50 keV flux we tend to underestimate the actual flux because of the truncation in energy. By truncating at 2 keV we underestimate the flux that would have been in the blackbody by roughly 2% to 20% in these spectra. By stopping the integration at 50 keV we also underestimate the flux at high energy, which in principle can be a large amount because of the hard tails in some sources (c.f. Barret & Vedrenne 1994). The observations considered here, however, did not find any source in an extremely hard state. We estimate that we typically loose about 2% of the flux in the power law by stopping the integration at 50 keV. In the hardest spectra (4U 0614+09 at low flux) we miss about 15% of the flux. There is likely a break in the power law at high energy (not included here) which makes the missing flux somewhat less than that. In the Beppo-SAX spectrum mentioned above, the flux from 0.1 keV to 2 keV is 25% of the total flux and that above 50 keV is 7% of the total. Finally, the bolometric flux may be larger than our estimate if the power law extends to very low energies (though this is physically not so likely) or if different components are present in the extreme ultraviolet or soft X-ray band.
To calculate a luminosity, , from the total unabsorbed 2–50 keV flux, we need to know the source distances. The distances we use here are quoted in Table 1 along with references. Distances can be determined in a variety of ways (see van Paradijs & McClintock 1994, for a description). In the sources showing type-I X-ray bursts, the distance can be determined from radius expansion bursts where the luminosity is thought to reach the Eddington limit (Lewin et al. 1993). In some bursters, no radius expansion bursts have been observed, and one derives only an upper limit by assuming the flux is less than the Eddington limit. We use the upper limits as the actual distances (see Table 1) , so that the derived are upper limits in these cases. One source, 4U 1820-30, is in the globular cluster NGC 6624 and therefore has a relatively well determined distance. The distances to the Z-sources, most of which do not show bursts, are more uncertain. Most of these sources are likely near the galactic center (Penninx 1989). A VLBA parallax measurement of Sco X-1 puts it at kpc (Bradshaw et al. 1999). A radius expansion burst was recently observed from Cyg X-2, yielding a distance of kpc (Smale 1998), though results from optical lightcurves put it substantially closer (see Orosz & Kuulkers 1999). The Cyg X-2 fluxes we measure are consistent with the data from the Einstein Observatory (Christian & Swank 1997) and EXOSAT (Schulz 1999).
The spectral analysis of Sco X-1 requires a special treatment which deserves note. In this source, detector deadtime effects are important since its count rate exceeds 25000 c s-1 PCU-1. We apply a correction for nonparalyzable deadtime, which amounts to simply multiplying the effective exposure time by a factor of about 0.7 (Zhang et al. 1995). We calculate this factor from the measured rates, a 10 sec deadtime appropriate for ‘Good Xe Events’, and a 150 sec deadtime appropriate for events registered as ‘Very Large Events’ in the instrument modes used. This deadtime treatment is approximate and does not take into account for example gain shifts due to the high count rates. We compare the flux we derive for Sco X-1 to that from Einstein observations (Christian & Swank 1997). Relative to GX 17+2, these fluxes are the the same.
Given the distance, , and the flux, , we calculate the the luminosity as . Note that this assumes the emission is isotropic. In quoting luminosities we normalize to an Eddington luminosity of erg s-1. Misestimates of distance, like the misestimates of flux discussed above, contribute to a spread in among sources. However, the observed range of covers over two orders of magnitude and this large of a range cannot be explained by these effects alone.
| Source | Ref. | |
|---|---|---|
| (kpc) | ||
| Atoll sources | ||
| 4U 0614+09 | 3.0 a | Brandt et al. (1992) |
| Aql X-1 | 3.4 | Thorstensen et al. (1978); [1] |
| 4U 1702-42 | 6.7 a | Oosterbroek et al. (1991) |
| 4U 1608-52 | 3.6 | Nakamura et al. (1989); Ebisuzaki (1987) |
| 4U 1728-34 | 4.3 | Foster et al. (1986) |
| 4U 1636-53 | 5.5 | van Paradijs et al. (1986); [1] |
| 4U 1735-44 | 7.1 a | Ebisuzaki et al. (1984) |
| KS 1731-260 | 8.5 | Sunyaev (1990) |
| 4U 1820-30 | 7.5 | NGC 6624; Rich et al. (1993) |
| 4U 1705-44 | 11.0 a | Ebisuzaki et al. (1984); Christian & Swank (1997) |
| Z sources | ||
| Cyg X-2 | 11.6 | Smale (1998) |
| GX 17+2 | 7.5 | Ebisuzaki et al. (1984); Christian & Swank (1997) |
| GX 340+0 | 9.5 | [1] |
| GX 5-1 | 7.4 | [1] |
| Sco X-1 | 2.8 | Bradshaw et al. (1999) |
| aafootnotetext: This is an upper limit based on burst fluxes. We use it as the distance in calculating . |
Note. — The sources and their distances used in this paper. References for the distances are shown. [1] is (van Paradijs & White 1995).
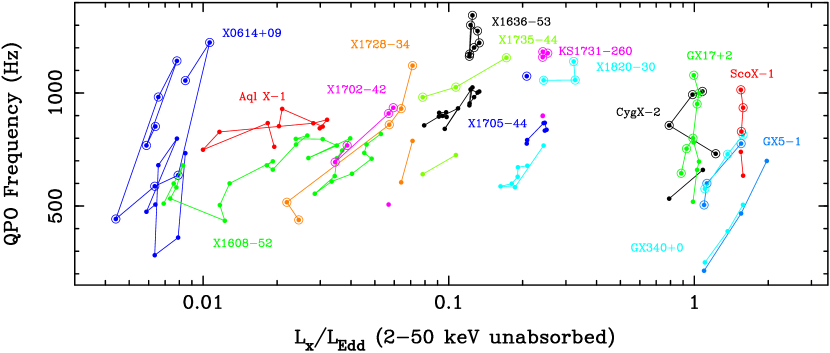
The results of the simultaneous spectral and timing measurements are shown in Figure 1 as a function of . Both of the double kilohertz QPOs are shown; circled symbols are used to indicate the higher frequency QPO. The lines connect points in time order, or in the case of Z-sources, in order along the Z track.
In each case we must identify which of the double QPOs is observed. In some observations only one QPO is detected. As reported in the current literature, all sources (except Aql X-1) are known to have two QPOs. Both QPOs, however, are not always present in a given observation. In 4U 1608-52 the lower frequency QPO peak is generally the stronger and narrower of the two (see Méndez et al. 1998) providing the identification. In 4U 0614+09 there is a robust correlation between the position in the X-ray color diagram and the frequency which allows us to determine which QPO is present (van Straaten et al. 2000). Similarly in other sources the relative properties of the energy spectra or rms values generally allow a firm identification of the peak.
The correlation of QPO frequency, , with can be parameterized as . Taking the data of the upper frequency QPO in Figure 1 for 4U 1735-44 and 4U 1702-42, we find and 0.5 respectively. We note however that these data on the upper frequency QPO come from observations widely separated in time. Over long timescales the – correlations shifts around and parallel lines are observed (see below). This data may therefore include several tracks of the parallel line correlations. In the data of 4U 1608-52 we can separate out the parallel lines (Méndez et al. 1999) and measure within each stretch of correlated data. We find values of between 0.5 and 1.6 with typical errors of 0.2, using the absorbed 2–10 keV flux instead of . Note that though these correlations are measured over a relatively small range in flux, this measurement does not mix up different tracks.
Of special note in Figure 1 are the LMXBs which do not appear because they do not exhibit kilohertz QPOs: the atoll-type sources GX3+1, GX9+9, GX9+1 and GX13+1. The upper limits to the rms fractions of QPOs in these sources are 1 to 3% (Strohmayer 1998; Wijnands et al. 1998b; Homan et al. 1998). The luminosities of these sources lie between the Z sources and other atoll sources (Christian & Swank 1997) and they are an important intermediate class of sources in some models (see Miller et al. 1998).
We note that only observations in which the LMXBs exhibit QPOs are reported here. The total range of that a source covers is generally larger than that in Figure 1 since kilohertz QPOs are present preferentially at intermediate fluxes (Méndez et al. 1999; Méndez 1999). The only known exceptions to this so far are 4U 0614+09 (van Straaten et al. 2000) and 4U 1728-34 (disalvo99).
Some selected parameters from the spectral fitting are shown in Figure 2. These parameters are similar to those previously measured for such sources and show that the Z-sources can be fit by roughly the same spectral model as the atoll sources (see Schulz 1999; Christian & Swank 1997; White et al. 1988). The ratio of powerlaw to blackbody flux is 2 to 3 in most cases, i.e. the blackbody is roughly 25% to 35% of the total flux (c.f. White et al. 1988). There is an overall trend towards harder spectra at lower luminosities, reflected in our fits. This same trend is seen in previous studies of atoll sources (e.g. van Paradijs & van der Klis 1994; Barret & Grindlay 1995) and occurs in the emission even up to 100 keV (Ford et al. 1996). It is also manifest in the patterns in X-ray color diagrams. The softening at higher fluxes is often attributed to the effects of thermal Comptonization.
3 Discussion
Within a given low-mass X-ray binary the frequency of the kilohertz QPOs, , is well correlated with the X-ray flux (Ford et al. 1997b; Zhang et al. 1998a) or count rate (Strohmayer et al. 1996; Wijnands et al. 1998a; Méndez et al. 1999; Méndez & van der Klis 1999; Méndez 1999), at least on the timescale of about a day. Considering all the binaries as a group, however, such a correlation does not hold. This is a very clear feature of Figure 1, where covers roughly the same range of frequencies for sources of widely different X-ray luminosities, . All sources have maximum frequencies at roughly 1000 to 1300 Hz, a fact that Zhang et al. (1997) have used to argue that the maximum is set by the orbital frequency at the marginally stable orbit. In addition to the similar maximum , all the sources have roughly the same minimum and slope of their – relation. This is the central mystery presented here. How is it that and are decoupled in the ensemble of systems?
This decoupling has an apparent analog within individual sources. In a given system, and (or flux, or count rate) are uniquely correlated within single observations spanning less than roughly a day. Between observations more widely separated in time, however, the correlation shifts and parallel lines appear in the vs diagram similar to those in Figure 1. Note, though, that these parallel lines in individual sources covers a much narrower range; flux shifts are a factor of a few at most in individual sources. 4U 0614+09 was first seen to have such parallel lines (Ford et al. 1997a, b), and the same effect is observed in Aql X-1 (Zhang et al. 1998a), 4U 1608-52 (Méndez et al. 1999), 4U 1728-34 (Méndez & van der Klis 1999), and 4U 1636-53 (Méndez 1999). There is a similar effect in Z-sources, where is correlated to the position on the instantaneous Z-track in the X-ray color diagram (e.g. Wijnands et al. 1998a; Jonker et al. 2000) while the tracks themselves shift around in intensity.
One possible solution to the mystery of decoupled and is that the parameters of the mechanism producing the QPOs are tuned in such a way that is the same in all systems. As an example consider the magnetospheric beat-frequency model. A simple version of the theory predicts that the QPO frequency is set by , where is the mass accretion rate and is the surface magnetic field strength (Alpar & Shaham 1985). The frequencies could then be the same if scaled in such a way that is constant in all systems (White & Zhang 1997). Such a connection between and was suggested previously on other grounds (Hasinger & van der Klis 1989; Psaltis & Lamb 1997). Other parameters, such as the neutron star spin, mass or temperature, might be involved as well, though it is not clear how these would fit into a detailed model.
The observational data do suggest that has a role in setting the QPO frequency. The correlations of and suggest this, in as much as and are related (see below). The timing properties point to a similar conclusion as well. The Fourier power spectra often show a noise component, whose power decreases with frequency above a break frequency of roughly 10 Hz. The break frequency is strongly correlated with (Ford & van der Klis 1998; van Straaten et al. 2000; Reig et al. 1999; DiSalvo et al. 2000). The fact that the break frequency is thought to be a good indicator of (van der Klis 1994), suggests that the frequency of the kilohertz QPO is also correlated with . Another timing signal is the QPO at 10–50 Hz (e.g. van der Klis et al. 1996; Ford & van der Klis 1998; Psaltis et al. 1999) which also correlates with . Thus there are several timing features, all correlated with one another (see also Wijnands & van der Klis 1999; Psaltis et al. 1999). In addition also depends strongly on the energy spectra, sometimes parameterized as the distance along a track in the X-ray color diagram (e.g. van der Klis et al. 1996; Wijnands et al. 1997; Zhang et al. 1998b; Méndez et al. 1999; Méndez 1999; Kaaret et al. 1999). The implication is that a single parameter underlies these correlations, and that parameter is likely .
If there is a connection between and , one might also expect a correlation of and , since is some measure of . Why then is the range of similar for very different in Figure 1? In the following we consider one logical possibility: that and do not track one another.
Perhaps is simply not a good indicator of the bolometric luminosity and in fact the bolometric luminosity is similar in all systems. In principle could misrepresent the bolometric luminosity just due to the limited 2–25 keV energy range of the RXTE/PCA. It is unlikely however that this is a large effect, since Beppo-SAX measurements from 0.1–200 keV indicate that not much energy is radiated outside the PCA band for these sources and our spectral models are applicable (Piraino et al. 1999). Of course there could also be strong emission in the unobserved extreme ultraviolet band.
If the emission is not isotropic, the measured will also be an inaccurate indicator of the total emission. Inclination effects are one possibility: the lower sources may be viewed at a higher (more edge-on) inclination making smaller. This effect is well known in the dipping X-ray systems where the inclination is extremely edge-on and is low (Parmar et al. 1986). An added attraction of this scenario is that it may explain the fact that Z-sources are strong radio emitters while the atoll-sources are not (Fender & Hendry 1999). In this scenario, the less inclined, higher , Z-sources show strong radio emission because the radio jet is beamed into the line of sight, while atoll-sources at higher inclination and lower , are usually not detected in the radio because the radio jet is more in the plane of the sky. This may not be the full story, however, since the beaming would have to be narrow and a search for effects of inclination in the X-ray spectra with EXOSAT uncovered no evidence that inclination is important (White et al. 1988).
A general problem with preserving the same in all the systems while changing the observed through anisotropy or bolometric corrections is that, if all the sources had the same , they should all show the same X-ray burst properties. They do not; the Z-sources, for example, hardly burst at all (Lewin et al. 1993). In the low- sources, is also likely low because the persistent emission is at least 10 times weaker than in the bursts, some of which are at the Eddington limit. Assuming the anisotropy is about the same in the burst and persistent emission, in these sources is then likely lower than in the sources near the Eddington limit, such as the Z sources.
Outflows are another way to decouple and , and are a well-known feature of X-ray binaries, as seen for example in the collimated radio jets (Hjellming & Han 1995; Fender 1999). One might expect that the outflows in the low- systems are stronger than those in the high- systems to preserve a similar accreted rate in the various systems. Radio observations, however, suggest that the opposite is true; the atoll sources are less luminous in radio than the Z-sources (Fender & Hendry 1999).
Another alternative is that part of the may be ineffective in determining while not being lost from the system. This could happen if the mass accretion rate occurs in a two component flow, radially and through a disk (e.g. Ghosh & Lamb 1979; Fortner et al. 1989; Wijnands et al. 1996). The accretion rate through the disk is primarily responsible for setting , while the radial flow does not affect but does change (see Kaaret et al. 1998). Miller et al. (1998) suggest that the disk accretion rate is similar in all sources. Matter is ‘scooped off’ into a radial flow at the magnetospheric radius, and this process is more efficient in the higher sources because the fields are stronger. Under this scenario, the QPOs at higher should have a much smaller rms fraction due to the addition of unmodulated flux. This represents a problem for this scenario since the rms fraction apparently does not decrease enough with (Ford et al. 2000).
All of the above effects may act to decouple and . As outlined above, though, no single effect can account for the decoupling and each has problems. If and are unrelated, can set the frequency of the QPOs while assumes any value, as observed.
References
- Alpar & Shaham (1985) Alpar, M. & Shaham, J. 1985, Nature, 316, 239
- Barret & Grindlay (1995) Barret, D. & Grindlay, J. E. 1995, ApJ, 440, 841+
- Barret & Vedrenne (1994) Barret, D. & Vedrenne, G. 1994, ApJS, 92, 505
- Berger et al. (1996) Berger, M., van der Klis, M., van Paradijs, J., Lewin, W. H. G., Lamb, F., Vaughan, B., Kuulkers, E., Augusteijn, T., Zhang, W., Marshall, F. E., Swank, J. H., Lapidus, I., Lochner, J. C., & Strohmayer, T. E. 1996, ApJ, 469, L13
- Boirin et al. (2000) Boirin, L. et al. 2000, ApJ
- Bradshaw et al. (1999) Bradshaw, C. F., Fomalont, E. B., & Geldzahler, B. J. 1999, ApJ, 512, L121
- Brandt et al. (1992) Brandt, S., Castro-Tirado, A. J., Lund, N., Dremin, V., Lapshov, I., & Syunyaev, R. 1992, A&A, 262, L15
- Christian & Swank (1997) Christian, D. J. & Swank, J. H. 1997, ApJS, 109, 177+
- DiSalvo et al. (2000) DiSalvo, T. et al. 2000, ApJ, submitted
- Ebisuzaki (1987) Ebisuzaki, T. 1987, PASJ, 39, 287
- Ebisuzaki et al. (1984) Ebisuzaki, T., Sugimoto, D., & Hanawa, T. 1984, PASJ, 36, 551
- Fender (1999) Fender, R. 1999, Relativistic Jets from X-ray binaries, astro-ph/9907050 (Springer Lecture Notes in Physics)
- Fender & Hendry (1999) Fender, R. & Hendry, M. 1999, MNRAS, accepted
- Ford et al. (1997a) Ford, E., Kaaret, P., Tavani, M., Barret, D., Bloser, P., Grindlay, J., Harmon, B. A., Paciesas, W. S., & Zhang, S. N. 1997a, ApJ, 475, L123
- Ford et al. (1996) Ford, E., Kaaret, P., Tavani, M., Harmon, B. A., Zhang, S. N., Barret, D., Grindlay, J., Bloser, P., & Remillard, R. A. 1996, ApJ, 469, L37
- Ford et al. (2000) Ford, E. et al. 2000, in preparation
- Ford et al. (1997b) Ford, E. C., Kaaret, P., Chen, K., Tavani, M., Barret, D., Bloser, P., Grindlay, J., Harmon, B. A., Paciesas, W. S., & Zhang, S. N. 1997b, ApJ, 486, L47
- Ford & van der Klis (1998) Ford, E. C. & van der Klis, M. 1998, ApJ, 506, L39
- Fortner et al. (1989) Fortner, B., Lamb, F. K., & Miller, G. S. 1989, Nature, 342, 775
- Foster et al. (1986) Foster, A. J., Fabian, A. C., & Ross, R. R. 1986, MNRAS, 221, 409
- Ghosh & Lamb (1979) Ghosh, P. & Lamb, F. K. 1979, ApJ, 234, 296
- Guainazzi et al. (1998) Guainazzi, M., Parmar, A. N., Segreto, A., Stella, L., Dal Fiume, D., & Oosterbroek, T. 1998, A&A, 339, 802
- Hasinger & van der Klis (1989) Hasinger, G. & van der Klis, M. 1989, A&A, 225, 79
- Hjellming & Han (1995) Hjellming, R. & Han, X. 1995 (Cambridge UP), 308+
- Homan et al. (1999) Homan, J., Méndez, M., Wijnands, R., van der Klis, M., & van Paradijs, J. 1999, ApJ, 513, L119
- Homan et al. (1998) Homan, J., van der Klis, M., Wijnands, R., Vaughan, B., & Kuulkers, E. 1998, ApJ, 499, L41
- Jonker et al. (2000) Jonker, P. et al. 2000, ApJ
- Kaaret et al. (1999) Kaaret, P., Piraino, S., Bloser, P. F., Ford, E. C., Grindlay, J. E., Santangelo, A., Smale, A. P., & Zhang, W. 1999, ApJ, 520, L37
- Kaaret et al. (1998) Kaaret, P., Yu, W., Ford, E. C., & Zhang, S. N. 1998, ApJ, 497, L93
- Lai (1998) Lai, D. 1998, ApJ, 502, 721
- Lewin et al. (1993) Lewin, W. H. G., van Paradijs, J., & Taam, R. E. 1993, Space Science Reviews, 62, 223+
- Méndez (1999) Méndez, M. 1999, in Proceedings of the 19th Texas Symposium in Paris, astro-ph/9903469
- Méndez & van der Klis (1999) Méndez, M. & van der Klis, M. 1999, ApJ, 517, L51
- Méndez et al. (1999) Méndez, M., van der Klis, M., Ford, E. C., Wijnands, R., & van Paradijs, J. 1999, ApJ, 511, L49
- Méndez et al. (1998) Méndez, M., van der Klis, M., van Paradijs, J., Lewin, W. H. G., Vaughan, B. A., Kuulkers, E., Zhang, W., Lamb, F. K., & Psaltis, D. 1998, ApJ, 494, L65
- Miller et al. (1998) Miller, M. C., Lamb, F. K., & Psaltis, D. 1998, ApJ, 508, 791
- Nakamura et al. (1989) Nakamura, N., Dotani, T., Inoue, H., Mitsuda, K., Tanaka, Y., & Matsuoka, M. 1989, PASJ, 41, 617
- Oosterbroek et al. (1991) Oosterbroek, T., Penninx, W., van der Klis, M., van Paradijs, J., & Lewin, W. H. G. 1991, A&A, 250, 389
- Orosz & Kuulkers (1999) Orosz, J. A. & Kuulkers, E. 1999, MNRAS, 305, 132
- Osherovich & Titarchuk (1999) Osherovich, V. & Titarchuk, L. 1999, ApJ, 523, L73
- Parmar et al. (1986) Parmar, A. N., White, N. E., Giommi, P., & Gottwald, M. 1986, ApJ, 308, 199
- Penninx (1989) Penninx, W. 1989, in 23rs ESLAB Symp. on Two Topics in X-ray Astronomy. Bologna, Italy, 13-20 September, 1989, Edited by Hunt, J. and Battrick, B. ESA SP-296, 185–196
- Piraino et al. (1999) Piraino, S., Santangelo, A., Ford, E. C., & Kaaret, P. 1999, A&A, 349, L77
- Psaltis et al. (1999) Psaltis, D., Belloni, T., & van der Klis, M. 1999, ApJ, 520, 262
- Psaltis & Lamb (1997) Psaltis, D. & Lamb, F. K. 1997, ApJ, 488, 881+
- Reig et al. (1999) Reig, P., Méndez, M., van der Klis, M., & Ford, E. 1999, ApJ, accepted
- Rich et al. (1993) Rich, R. M., Minniti, D., & Liebert, J. 1993, ApJ, 406, 489
- Schulz (1999) Schulz, N. S. 1999, ApJ, 511, 304
- Smale (1998) Smale, A. P. 1998, ApJ, 498, L141
- Stella & Vietri (1999) Stella, L. & Vietri, M. 1999, Phys. Rev. Lett., 82, 17
- Strohmayer (1998) Strohmayer, T. E. 1998, in Accretion Processes in Astrophysical Systems: Some Like it Hot! Eighth Astrophysics Conference, College Park, MD, October 1997. Edited by Stephen S. Holt and Timothy R. Kallman, AIP Conference Proceedings 431., p.397, 397
- Strohmayer et al. (1996) Strohmayer, T. E., Zhang, W., Swank, J. H., Smale, A., Titarchuk, L., Day, C., & Lee, U. 1996, ApJ, 469, L9
- Sunyaev (1990) Sunyaev, R. 1990, IAU Circ., 5104, 1+
- Thorstensen et al. (1978) Thorstensen, J., Charles, P., & Bowyer, S. 1978, ApJ, 220, L131
- Tomsick et al. (1999) Tomsick, J. A., Halpern, J. P., Kemp, J., & Kaaret, P. 1999, ApJ, 521, 341
- van der Klis (1994) van der Klis, M. 1994, ApJS, 92, 511
- van der Klis (1997a) van der Klis, M. 1997a, in Proceedings of the Wise Observatory 25th Anniversary Symposium, astro-ph/9704272
- van der Klis (1997b) van der Klis, M. 1997b, in The many faces of Neutron Stars, astro-ph/9710016, Vol. 515 (Kluwer Academic Publishers), 337–368
- van der Klis (1998) van der Klis, M. 1998, in The Active X-ray Sky: Results from BeppoSAX and RXTE. Proceedings of the Active X-ray Sky symposium, October 21-24, 1997, Rome, Italy, Edited by L. Scarsi, H. Bradt, P. Giommi, and F. Fiore. Publisher: Amsterdam: Elsevier, 1998. Reprinted from: Nuclear Physics B, (Proc. Suppl.), vol. 69/1-3. ISBN: 0444829903., p.103, 103
- van der Klis et al. (1996) van der Klis, M., Swank, J. H., Zhang, W., Jahoda, K., Morgan, E. H., Lewin, W. H. G., Vaughan, B., & van Paradijs, J. 1996, ApJ, 469, L1
- van Paradijs & McClintock (1994) van Paradijs, J. & McClintock, J. E. 1994, A&A, 290, 133
- van Paradijs et al. (1986) van Paradijs, J., Sztajno, M., Lewin, W. H. G., Trumper, J., Vacca, W. D., & van der Klis, M. 1986, MNRAS, 221, 617
- van Paradijs & van der Klis (1994) van Paradijs, J. & van der Klis, M. 1994, A&A, 281, L17
- van Paradijs & White (1995) van Paradijs, J. & White, N. 1995, ApJ, 447, L33
- van Straaten et al. (2000) van Straaten, S., Ford, E., van der Klis, M., Méndez, M., & Kaaret, P. 2000, ApJ, submitted
- White et al. (1988) White, N. E., Stella, L., & Parmar, A. N. 1988, ApJ, 324, 363
- White & Zhang (1997) White, N. E. & Zhang, W. 1997, ApJ, 490, L87
- Wijnands et al. (1997) Wijnands, R., Homan, J., van der Klis, M., Mendez, M., Kuulkers, E., van Paradijs, J., Lewin, W. H. G., Lamb, F. K., Psaltis, D., & Vaughan, B. 1997, ApJ, 490, L157
- Wijnands et al. (1998a) Wijnands, R., Méndez, M., van der Klis, M., Psaltis, D., Kuulkers, E., & Lamb, F. K. 1998a, ApJ, 504, L35
- Wijnands & van der Klis (1999) Wijnands, R. & van der Klis, M. 1999, ApJ, 514, 939
- Wijnands et al. (1998b) Wijnands, R., van der Klis, M., & van Paradijs, J. 1998b, in IAU Symposia, Vol. 188, 370
- Wijnands et al. (1996) Wijnands, R. A. D., van Der Klis, M., Psaltis, D., Lamb, F. K., Kuulkers, E., Dieters, S., van Paradijs, J., & Lewin, W. H. G. 1996, ApJ, 469, L5
- Zhang et al. (1998a) Zhang, W., Jahoda, K., Kelley, R. L., Strohmayer, T. E., Swank, J. H., & Zhang, S. N. 1998a, ApJ, 495, L9
- Zhang et al. (1995) Zhang, W., Jahoda, K., Swank, J. H., Morgan, E. H., & Giles, A. B. 1995, ApJ, 449, 930+
- Zhang et al. (1998b) Zhang, W., Smale, A. P., Strohmayer, T. E., & Swank, J. H. 1998b, ApJ, 500, L171
- Zhang et al. (1997) Zhang, W., Strohmayer, T. E., & Swank, J. H. 1997, ApJ, 482, L167
- Zhang et al. (1993) Zhang, W. et al. 1993, SPIE, 2006, 324