Kinematics of Molecular Hydrogen Emission from Planetary and Pre-planetary Nebulae
Abstract
We report results from a program of high-resolution spectral mapping of rotational H2 emission from bipolar planetary and pre-planetary nebulae. Long-slit spectra obtained with the NOAO Phoenix near-infrared spectrometer allow us to probe the molecular kinematics of these nebulae at moderate spatial resolution. We find strong evidence of a component of rotation in the equatorial H2 emission from the Egg nebula (RAFGL 2688). In this nebula and in the pre-planetary nebula RAFGL 618, the H2 kinematics point to the recent emergence of high-velocity polar flows, which likely mark the fairly sudden terminations of the red giant phases of their central stars. The classical bipolar planetary NGC 2346 displays distinct kinematic components, which we interpret as arising in the morphologically distinct equatorial and polar regions of the nebula. The H2 rings observed in the Phoenix position-velocity maps of this nebula support the hypothesis that ring-like planetaries that display H2 emission possess bipolar structure.
Chester F. Carlson Center for Imaging Science, Rochester Institute of Technology, 54 Lomb Memorial Dr., Rochester, NY 14623
Dept. of Physics & Astronomy, Vanderbilt University, Nashville, TN
1. Introduction
The presence of molecular hydrogen emission is now recognized as a reliable indicator of bipolar structure in planetary nebulae (Zuckerman & Gatley 1988; Kastner et al. 1994, 1996). While the polar lobes often display H2, the molecular emission is, with few exceptions, brightest toward the waists of bipolar planetaries. These molecule-rich regions of planetary nebulae (PNs) appear to be the remnants of circumstellar disks or tori formed during previous, asymptotic giant branch (AGB) or post-AGB phases of the central stars. Furthermore, the available evidence suggests that the onset of H2 emission postdates the AGB stage but precedes the formation of the PN (Weintraub et al. 1998). This onset likely signals the beginning of a high-velocity, collimated, post-AGB wind, which shocks the previously ejected, “slow,” AGB wind and thereby produces the observed H2 emission (Kastner et al. 1999).
These observations make clear that further investigations of H2 emission are important to our understanding of the origin of bipolarity in PNs. It is of particular interest to establish whether the spatially distinct waist and lobe H2 emission regions are kinematically distinct as well and, furthermore, whether the kinematics bear evidence of the presence of circumstellar disks and/or high-velocity polar flows. To this end, we have undertaken a program of spectroscopic mapping of near-infrared H2 emission from planetary and pre-planetary nebulae at high spectral resolution. First results from this program were presented in Weintraub et al. (1998), in which H2 emission was detected from a pair of bipolar pre-planetary nebulae (PPNs), and in Kastner et al. (1999), where we described preliminary results for the seminal PPN RAFGL 2688. Here we present further analysis and interpretation of H2 velocity mapping of RAFGL 2688, as well as H2 velocity mapping results for the PPN RAFGL 618 and the bipolar planetary nebula NGC 2346 (see also Arias & Rosado, in this volume).
2. Observations
Data presented here were obtained with the NOAO111National Optical Astronomy Observatories is operated by Associated Universities for Research in Astronomy, Inc., for the National Science Foundation. Phoenix spectrometer on the 2.1 m telescope at Kitt Peak, AZ, in 1997 June (RAFGL 2688) and 1997 December (RAFGL 618, NGC 2346). Phoenix illuminates a section of an Aladdin InSb detector array. The spectrograph slit was oriented approximately east-west. The velocity resolution was km s-1 and the spatial resolution at the time these spectra were obtained. A spectral image centered near the 2.121831 m , transition of H2 was obtained at each of 12 spatial positions as the slit was stepped from south to north across RAFGL 2688. The step size, , provided coverage of the entire H2 emitting region with spatial sampling approximating the slit height. For RAFGL 618, whose bright H2 emission regions are oriented almost perfectly east-west (Latter et al. 1995), parallel to the Phoenix slit, we obtained a single spectral image centered on the object. For NGC 2346 we obtained spectral images at selected positions near the waist of the nebula. Spectral images were reduced and wavelength calibrated as described in Weintraub et al. (1998). For the RAFGL 2688 data, the reduced spectral images were stacked in declination according to the commanded telescope offsets, to produce a (RA, dec, velocity) data cube of H2 emission.
3. Results and Discussion
3.1. RAFGL 2688
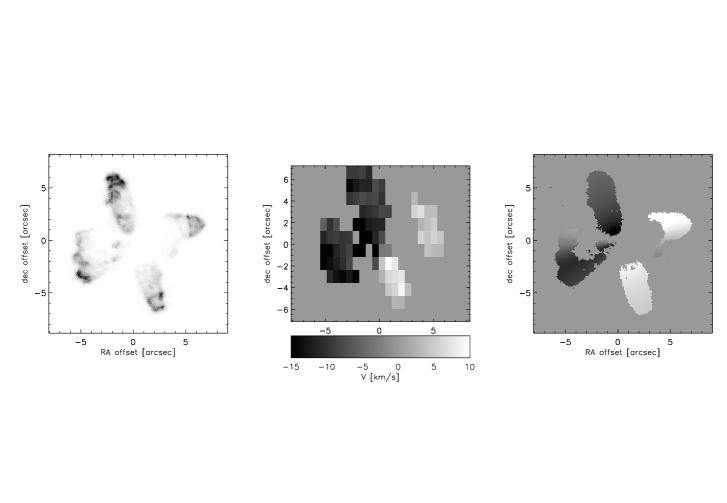
Kastner et al. (1999) presented selected velocity planes from the RAFGL 2688 Phoenix data cube. The four principal “lobes” of H2 emission seen in direct H2 images (e.g., Sahai et al. 1998) are also apparent in these Phoenix data, with one pair oriented parallel to the polar axis (roughly N-S) and one perpendicular (roughly E-W). Each of these H2 lobe pairs displays a velocity gradient, with the N and E lobes blueshifted by up to km s-1 and the S and W lobes similarly redshifted. However, the N-S and E-W H2 lobe pairs differ in their detailed kinematic signatures (Kastner et al.).
The H2 kinematic data for RAFGL 2688, like velocity maps obtained from radio molecular line emission, can be described in terms of a multipolar system of purely radially directed jets (Cox et al. 1997; Lucas et al., these proceedings). Given the constraints imposed by Phoenix and Hubble Space Telescope data, however, this model would require that the “equatorial” components located east and west of the central star are in fact directed well above and below the equatorial plane, respectively (Kastner et al. 1999). If one postulates instead that the E-W H2 emission lobes are confined to the equatorial plane of the system — a hypothesis that appears to be dictated by certain details of the H2 surface brightness distribution, as well as by simple symmetry arguments — then one must invoke a model combining radial expansion with a component of azimuthal (rotational) velocity along the equatorial plane (Kastner et al.). In a forthcoming paper we will compare these two alternative models in more detail. Here, we describe a specific formulation of the latter (expansion rotation) model that reproduces many of the salient features of the Phoenix data.
To construct this empirical model of the H2 kinematics of RAFGL 2688, we are guided by the basic results described above. That is, the polar lobes are characterized by velocity gradients in which the fastest moving material is found closest to the star, and the slowest moving material is found at the tips of the H2 emission regions. For simplicity, we assume this behavior can be described by an inverse power law relationship between velocity and radius. For the equatorial plane H2 emission, meanwhile, we assume a combination of azimuthal (rotation) and radial (expansion) velocity components, whose magnitudes we denote by and , respectively.
To constrain these model parameters, we compared model velocity field images with a velocity centroid image which we obtained from the Phoenix data cube. For the polar lobes, we find that the exponent of the inverse power law velocity-distance relationship is roughly and that the outflow velocities at the tips of the N and S lobes are km s-1. For the equatorial regions, good agreement between model and data is obtained for values of and that lie in the range km s-1, with the additional constraint km s-1. An example of the results for a representative model (with km s-1 and km s-1) is displayed in Fig. 1. There is clear qualitative agreement between the model and observed velocity images for these parameter values, in the sense that the overall distribution of redshifted and blueshifted emission is captured by the model. Furthermore, this model reproduces specific details of the observed H2 velocity distribution, such as the approximate magnitudes and positions of the velocity extrema in the four H2 lobes. While this model is by no means unique, the comparison of calculated and observed velocity fields provides further support for a component of azimuthal velocity along the equatorial plane of RAFGL 2688, and offers an indication of the magnitude of this “rotational” component relative to the components of radial expansion both parallel and perpendicular to the polar axis of the system.
3.2. RAFGL 618
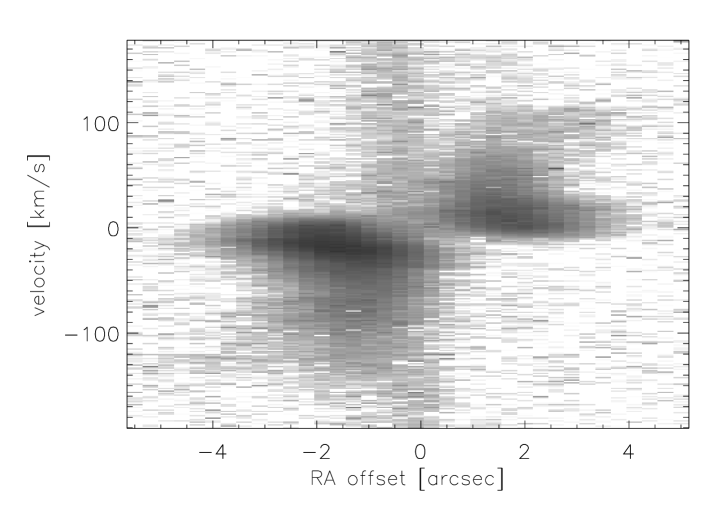
The Phoenix spectral image obtained for RAFGL 618 is displayed in Fig. 2. Bright H2 emission is detected along the entire polar axis of RAFGL 618. These data demonstrate further that very high velocity H2 emission is present in this bipolar outflow. The highest velocity molecular material is found closest to the central star of RAFGL 618. We conclude that the velocity gradients along the polar axes of both RAFGL 2688 and RAFGL 618 trace rapid transitions from the “slow,” spherically symmetric winds of their AGB progenitors to faster, collimated, post-AGB winds (Kastner et al. 1999).
3.3. NGC 2346
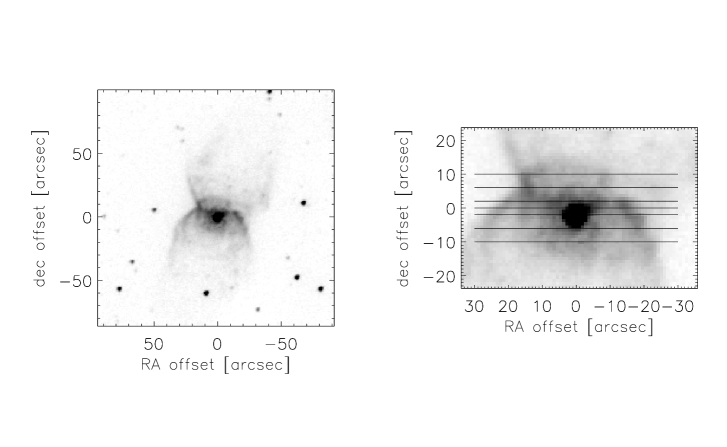
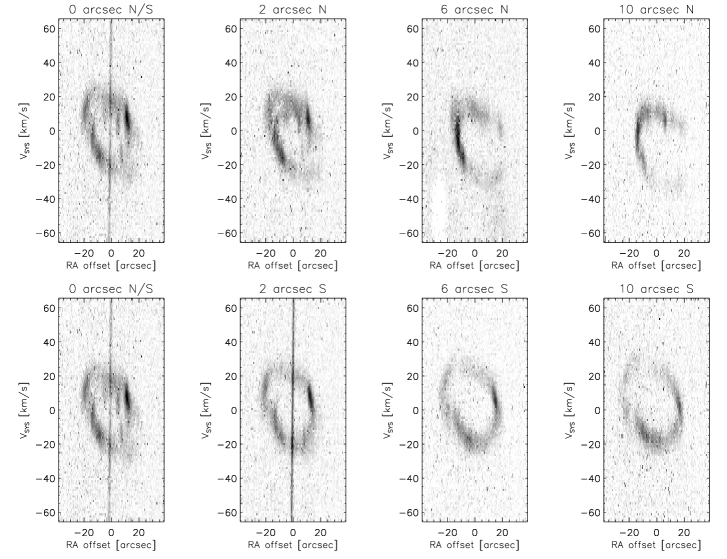
In Fig. 3 we display an H2 image of NGC 2346 obtained with the NOAO Cryogenic Optical Bench (Kastner et al. 1996) and we illustrate the slit positions used for Phoenix spectroscopic observations. Phoenix spectral images of NGC 2346 obtained at these positions are presented in Fig. 4. These images demonstrate that the H2 emission from the bipolar NGC 2346 forms rings or ellipses in position-velocity space, an observation that reinforces our prior conclusion that ring-like planetaries which display H2 are bipolar in structure (Kastner et al. 1994, 1996).
The position-velocity ellipse represented in the spectral image obtained with the slit at offset (leftmost panels) is noticably tilted, with the largest redshifts found to the east and the largest blueshifts to the west of the central star. It is apparent from Fig. 3 that this tilt is due to the orientation of the Phoenix slit with respect to the object. That is, to the east of the star the slit takes in portions of the rearward-facing (redshifted) south polar lobe of the nebula, whereas to the west the slit samples portions of the forward-facing (blueshifted) north polar lobe.
Furthermore, the position-velocity ellipses in Fig. 4 contain two distinct kinematic components: a central ring associated with lower velocity material in the nebular waist and a pair of rings associated with higher velocity material in the bipolar outflow lobes. The central ring is centered at the systemic velocity of the nebula and is most apparent in the spectral images obtained near the position of the central star (i.e., in the four lefthand panels). The southern ring is primarily redshifted (righthand bottom panels) while the northern ring (righthand top panels) is primarily blueshifted. All three rings are present in the images obtained nearest the position of the central star (lefthand panels), whereas the images obtained further from the central star display emission from only a portion of the central ring and one of the outer rings. Hence Figs. 3 and 4 indicate that the H2 emission from the nebula’s waist produces the inner position-velocity ring, while the outer rings arise from H2 emission from the polar lobes. Because of the tilt of the slit with respect to the waist of the nebula, a given slit position samples both the waist region and one or both polar lobes, resulting in a superposition of these kinematic features in a given spectral image.
In summary, the Phoenix spectral images of NGC 2346 provide strong evidence for distinct kinematic components in this nebula. These components consist of an equatorial ring or disk which is expanding at relatively low velocity ( km s-1 projected along our line of sight; Fig. 4, leftmost panels) and polar lobes that are expanding at larger velocities (Fig. 4, rightmost panels). Put differently, the equatorial confinement that is apparent in the morphology of this classical bipolar PN has a direct kinematic counterpart. It is tempting, therefore, to conclude that the pinched waist of NGC 2346 has its roots in processes which we are now beginning to explore in objects such as RAFGL 2688.
Acknowledgments.
J.H.K. acknowledges support from a JPL Infrared Space Observatory grant to RIT. LeeAnn Henn (MIT) reduced many of the Phoenix spectral images used in this study.
References
Cox, P., et al. 1997, A&A, 321, 907
Kastner, J.H., Gatley, I., Merrill, K.M., Probst, R.P., & Weintraub, D.A. 1994, ApJ, 421, 600
Kastner, J.H., Weintraub, D.A., Gatley, I., Merrill, K.M., & Probst, R.P. 1996, ApJ, 462, 777
Kastner, J.H., Henn, L., Weintraub, D.A., & Gatley, I. 1999, in IAU Symp. 191, “Asymptotic Giant Branch Stars,” eds. T. LeBertre, A. Lebre, & C. Waelkens, p. 431
Latter, W. B., Kelly, D. M., Hora, J. L., & Deutsch, L. K. 1995, ApJS, 100, 159
Sahai, R., Hines, D., Kastner, J.H., Weintraub, D.A., Trauger, J.T., Rieke, M.J., Thompson, R.I., & Schneider, G. 1998, ApJ, 492, 163L
Weintraub, D.A., Huard, T., Kastner, J.H., & Gatley, I. 1998, ApJ, 509, 728
Zuckerman, B., & Gatley, I. 1988, ApJ, 324, 501