X–ray/optical observations of XTE J0421+560/CI Cam in quiescence
Abstract
We report on a BeppoSAX observation of the transient X–ray source XTE J0421+560 during quiescence performed 150 days after the 1998 April outburst. The source had an unabsorbed 0.5–10 keV flux of erg cm-2 s-1 and was still remarkably soft with most of the emission below 2 keV. The X–ray spectrum can be fit with the same two-temperature model as the outburst observations. There is evidence for the presence of an Iron emission feature at 7 keV. We report also on a series of optical observations performed using the 72 cm Teramo-Normale Telescope (TNT) of the Teramo Observatory, and the 1.5 m Loiano Telescope of the Bologna Observatory. The optical spectrum includes very strong Balmer emission lines, He I, [Fe II], and [O I] features. From the observed the quiescent optical emission cannot be due to re-processing of the X–rays, but has to be generated in the optical companion or the circumstellar material. Moreover, the quiescent X–ray luminosity cannot be due to the optical star if it is of spectral type OB. Although the nature of the compact object present in the XTE J0421+560/CI Cam system cannot be firmly established, we speculate that it is most probably a white dwarf.
Key Words.:
Stars: binaries: symbiotic – Stars: individual (XTE J0421+560) – Stars: novae – X–ray: general – X–rays: stars1 Introduction
The soft X–ray transient (SXT) XTE J0421+560 was the target of a series of observations by CGRO (Harmon et al. (1998)), RXTE (Marshall et al. (1998)), ASCA (Ueda et al. (1998)) and BeppoSAX (Orlandini et al. (1998)) soon after an outburst discovered by the All-Sky Monitor (ASM) on-board RXTE in 1998 April (Smith et al. (1998)). Radio observations of XTE J0421+560 revealed the presence of radio jets (Hjellming and Mioduszewski (1998)), similar to those observed from SS433. The jet motion was estimated to be 26 mas/day, corresponding to a velocity of assuming a source distance of 1 kpc (Chkhikvadze (1970)). Subsequent radio observations have revealed a slow (1000 Km s-1), shell-like motion (Hjellming et al. (1998)), confirmed by optical observations (Robinson et al. (2000)).
The optical counterpart of XTE J0421+560 is the peculiar star CI Cam (aka MWC 84) which, on the basis of the new classification criteria proposed by Lamers et al. (1998), is classified as a B[e] star. This classification includes supergiants, pre-main sequence stars, compact planetary nebulae, symbiotic stars and unclassified stars. Lamers et al. (1998) include CI Cam among the unclassified stars, while Zorec (1998) includes it among the proto-planetary nebulae with dusty circumstellar envelopes. The binary nature of CI Cam has been deduced from the extremely large ratio between IRAS 84 m and 12 m fluxes, which is close to that of binary systems that contain both a hot and a cool star (Miroshnichenko (1995)).
We have already reported on the two Target of Opportunity (TOO) observations performed by BeppoSAX during the 1998 April outburst (Frontera et al. (1998); Orr et al. (1998)). The energy spectra cannot be fit by any simple model, and displayed a dramatic change from TOO1 (performed on 1998 April 3) to TOO2 (1998 April 9), namely the onset of a soft (E2 keV) component (Orr et al. (1998)). A two-temperature bremsstrahlung model was used to describe the spectra of both TOOs, with temperatures (, )(1.27, 6.81) keV for TOO1, and (0.20, 2.78) keV for TOO2 (Orr et al. (1998)). The spectra for both TOOs included line features, identified with O, Ne/Fe-L, Si, S, Ca and Fe-K. During TOO2 the O and Ne/Fe-L line energies decreased smoothly by 9%, while the other lines did not show any shifts. Because of the peculiar temporal variability of the source, Frontera et al. (1998) associated the soft component to the relativistic jets, and the hard component to processes occurring in circumstellar matter.
The nature of the compact object responsible for the X–ray emission is still unknown and controversial. The low energetics involved in the outburst and the absence of erratic time variability are unlike outbursts from neutron star or black hole X–ray novae (Frontera et al. (1998)). However the presence of X–ray, optical and radio emission, together with relativistic jets, is typical of neutron star and black hole systems.
In order to try to elucidate the nature of the compact object by studying the source spectral evolution during its quiescent phase, we performed a third TOO observation of XTE J0421+560 as soon as the source was once again observable by BeppoSAX. In the next section we detail the data analysis performed on the X–ray data, while in Sect. 3 we present results from optical observations performed at the Teramo and Bologna astronomical observatories. Finally, in Sect. 4 we discuss the implications of these observations.
2 X–ray Observation and data analysis
The BeppoSAX satellite (Boella et al. 1997a ) is equipped with four narrow field instruments (NFIs) able to cover the unprecedented wide 0.1–200 keV energy band. Two NFIs are imaging instruments, namely the LECS (Parmar et al. (1997)) and MECS (Boella et al. 1997b ), operating in the 0.1–10 keV and 1.5–10 keV energy bands, respectively. The other two NFIs are mechanical collimated instruments: the HPGSPC (Manzo et al. (1997)) and PDS (Frontera et al. (1997)). The former operates in the 3–180 keV band, while the latter operates in the 15–200 keV band. The background for the non-imaging NFIs is monitored by rocking the collimators off-source by (one-side rocking) for the HPGSPC, and 35 (two-side rocking) for the PDS.
The third BeppoSAX observation of XTE J0421+560 was performed between 1998 September 3 14:19 UT and September 4 13:47. This is 157 days after the XTE J0421+560 burst peak of 1998 April 1 (the long delay between TOO2 and TOO3 is due to unobservability of the source with BeppoSAX because of viewing constraints). All four NFIs worked nominally during the observation. Data were collected in direct mode, providing information on time, energy and position (for the imaging instruments), and were processed using the saxdas 2.0 package (Lammers (1997)) except for PDS data, where xas 2.1 (Chiappetti and Dal Fiume (1997)) was used. Good data were selected using default criteria. For the imaging instruments, data were extracted from circular regions centered on the source position, with a radius for the LECS, and for the MECS (the smaller MECS extraction region is due to S/N optimization above 4 keV).
Because of the low galactic latitude of the source, we did not use the standard background LECS blank field measurement, but instead the background was estimated from two semi-annuli near the outside of the field of view (Parmar et al. (1999)). The 3 uncertainty obtained using this new method is 2.2 c s-1 (0.1–10 keV), or 3.7 c s-1 (0.1–2 keV). To estimate the MECS background we used both a standard file and a background estimated from an annular region centered on the source position with inner and outer radii of and , respectively. The results do not depend significantly on which MECS background was used. For the collimated instruments, we evaluated the background from the offset fields, using a standard background subtraction procedure. The offset fields were also checked for the presence of contaminating sources.
A faint source at a position consistent with XTE J0421+560 was detected in both imaging instruments (see Fig. 1). The 0.1–10 keV LECS net count rate is c s-1, while the 1.5–10 keV MECS count rate is c s-1. The exposure times for the LECS and MECS are 19 ks and 45 ks, respectively. This difference is due to the constraint that the LECS can only be operated in spacecraft night time. The 2 PDS upper limit is 0.5 mCrab (15–30 keV).
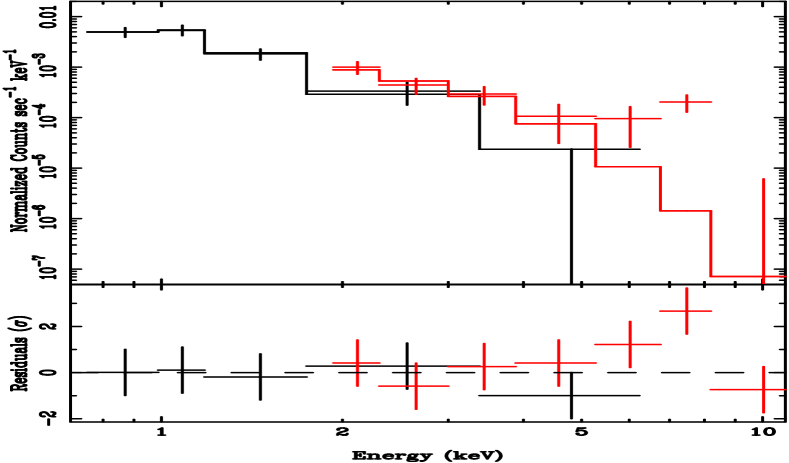
The combined LECS and MECS spectrum can be fit with the same continuum model as used for TOO1 and TOO2, namely a two-temperature bremsstrahlung (2BREMS) model. A factor was included in the spectral fitting to allow for known normalization differences between the two instruments (Fiore et al. (1999)). The fit yields a of 10.9 for 6 degrees of freedom (dof). The inclusion of a narrow Gaussian emission line at 7 keV improved the fit, yielding a /dof of 2.5/4. The inclusion of this line is marginally significant, the probability of chance improvement (PCI) of the , computed by means of an F-test, being equal to 5.3%. In Fig. 2 the 2BREMS plus Iron line fit to the LECS and MECS spectra is shown, together with the fit residuals. The line normalization has been set to zero in the lower panel to display its profile. In Table 1 the best fit parameters for the 2BREMS model, together with other continuum models used to fit the data: a simple power-law and a one-temperature bremsstrahlung are presented. A simple black-body spectrum does not fit our data, with a /dof of 17.6/7. The amount of photo-electric absorption was not well constrained with any of the models, and it was therefore fixed at the galactic value (Daltabuit and Meyer (1972)). The unacceptable fit using the 1BREMS model is due to the need for a second component above 5 keV. The PCI of the from the PL to the 2BREMS model is 56%. We also tried to fit the spectrum using a two-temperature equilibrium plasma emission model (Raymond and Smith (1977)), as performed with ASCA data (Ueda et al. (1998)). The fit yields a /dof of 9.6/7, with large positive residuals near 7 keV.
| Parameter | Value | ||
|---|---|---|---|
| PL | 1BREMS | 2BREMS | |
| LECS/MECS | |||
| NH ( cm-2) | |||
| kT1 (keV) | |||
| kT2 (keV) | |||
| EFe (keV) | |||
| (keV) | 0.1b | 0.1b | 0.1b |
| I | |||
| /dof | 5.48/7 | 14.24/7 | 2.80/5 |
| PCI | 0.0512 | 0.22 | 0.0126 |
| a Fixed at the galactic value (Daltabuit and Meyer (1972)) | |||
| b Fixed at the MECS resolution | |||
| c In units of 10-6 Photons cm-2 s-1 | |||
The observed 0.5–2 keV and 2–10 keV fluxes computed from the 2BREMS model are and erg cm-2 s-1, respectively. The unabsorbed fluxes (computed by setting NH0) in the 0.5–2 keV and 2–10 keV energy ranges are and erg cm-2 s-1, respectively. Using these values, we obtain X–ray luminosities of (0.5–2 keV) and (2–10 keV) d erg s-1, where dkpc is the distance to XTE J0421+560 in kpc. These estimates are strongly affected by the uncertainty in the NH value: a 50% increase in NH corresponds to a 60% increase in the 0.5–2 keV luminosity. On the other hand is insensitive to NH, with only a 18% decrease in the best fit temperature with respect to a 50% increase in NH.
3 Optical observations and data analysis
The field of CI Cam was imaged on 1998 September 3, simultaneously with the BeppoSAX observation, with the 72 cm Teramo-Normale Telescope (TNT) of the Teramo Observatory. A total of 15 frames in the , , and bands were acquired between September 3.980 and September 4.048, with exposure times between 1 and 15 minutes. The frames were corrected for bias and flat fielded in the standard fashion and then reduced with the daophot ii package (Stetson (1987)) and the PSF-fitting algorithm allstar inside midas. The star, during these observations, had , –, – and –, with no substantial luminosity variations amongst the frames acquired in each single filter.
Spectroscopy on this object was then performed on 1998 December 14 and 1999 January 23 with the 1.5 m telescope of the Bologna Astronomical Observatory. Spectra with grisms #3 (3000–6500 Å), #4 (4000–9000 Å) and #5 (5000–10000 Å) were acquired with a slit width of , which gave dispersions of 2.1, 3.0 and 2.8 Å/pixel, respectively. The exposure times ranged from 2 to 30 minutes. Table 2 is a log of the spectrophotometric observations.

| Date | Start time | Filter or | Exposure |
| (UT) | passband | (minutes) | |
| Imaging | |||
| 1998 Sep 3 | 23:30:33 | 1 | |
| 1998 Sep 3 | 23:35:01 | 1 | |
| 1998 Sep 3 | 23:37:41 | 1 | |
| 1998 Sep 3 | 23:39:19 | 1 | |
| 1998 Sep 3 | 23:40:51 | 2 | |
| 1998 Sep 3 | 23:43:27 | 2 | |
| 1998 Sep 3 | 23:45:40 | 2 | |
| 1998 Sep 3 | 23:48:40 | 3 | |
| 1998 Sep 3 | 23:52:30 | 4 | |
| 1998 Sep 3 | 23:56:45 | 4 | |
| 1998 Sep 4 | 00:01:24 | 4 | |
| 1998 Sep 4 | 00:06:13 | 10 | |
| 1998 Sep 4 | 00:17:42 | 10 | |
| 1998 Sep 4 | 00:28:38 | 15 | |
| 1998 Sep 4 | 00:45:58 | 15 | |
| 1998 Sep 4 | 01:03:16 | 15 | |
| Spectra | |||
| 1998 Dec 14 | 22:07:35 | Grism #4 | 30 |
| 1998 Dec 14 | 22:41:05 | Grism #4 | 10 |
| 1998 Dec 14 | 22:54:07 | Grism #4 | 3 |
| 1998 Jan 23 | 19:17:31 | Grism #3 | 30 |
| 1998 Jan 23 | 19:52:46 | Grism #3 | 30 |
| 1998 Jan 23 | 20:25:49 | Grism #4 | 2 |
| 1998 Jan 23 | 20:30:58 | Grism #4 | 8 |
| 1998 Jan 23 | 20:42:01 | Grism #4 | 8 |
| 1998 Jan 23 | 20:54:11 | Grism #5 | 8 |
| 1998 Jan 23 | 21:04:49 | Grism #5 | 8 |
| 1998 Jan 23 | 21:16:10 | Grism #5 | 2 |
Spectra were debiased and flat-fielded in the standard way and then extracted and reduced with iraf. Wavelength calibration was made using He–Ar lamps. Flux calibration was performed only for the December 14 spectra using the spectroscopic standard HD 60778. The January 23 spectra were not flux calibrated because of poor atmospheric conditions. Due to the constancy, within the uncertainties, of the band magnitude between the two observations as shown by the VSOLJ data (Nogami (1999)), and because of non variability of the main emission line ratios in the two data sets, we assumed that the flux level of the continuum remained constant during the two runs, and so we calibrated the January 23 spectra with the same standard as December 14.
The summed (3500–10000 Å) optical spectrum of CI Cam for the night of January 23 is shown in Fig. 3. It reveals very strong emission lines of the Balmer series of Hydrogen, plus He I, [Fe II], [O I] and weak He II (see Table 3). A quick-look comparison with the spectrum of Downes (1984) acquired 15 years before shows that all the main emission lines identified by that author are still present; moreover, in the red branch — which was not covered by Downes — a strong O I line at and the Paschen series in emission are seen. We note that the strength of the He I lines is strongly reduced. The He II emission lines at and 5411 are marginally detected. In Table 3 we detail some of the lines detected in the CI Cam spectrum, together with their equivalent widths and line fluxes.
We de-reddened the optical data using the NH column value computed in the direction of CI Cam (N cm-2; Daltabuit & Meyer 1972). We then fit the 4000–10000 Å optical spectrum with a power-law (), yielding a power-law index of . The total optical unabsorbed flux is erg cm-2 s-1, corresponding to an optical luminosity d erg s-1.
The mean values reported in Table 3 for the EWs of the [Fe II] 4414 and [O I] 6364 forbidden emission lines were computed using only the January spectra. This is due to the low S/N ratio for these features in the December observations. Since the EWs of [Fe II] 5527 and 5746 lines, as well as those of the permitted emission lines, did not vary substantially between the two spectroscopic runs, it is likely that also the EWs of [Fe II] 4414 and [O I] 6364 remained constant within the errors.
It is noteworthy that, for at least the [Fe II] 5527 and 5746, a shift of about 8 Å is observed with respect to the main permitted emission lines such as the Balmer series, the He I, O I and Fe II lines. A similar shift cannot be verified for [Fe II] 4414 and [O I] 6364, because of their poorer S/N ratio and the insufficient spectral resolution, especially for the [O I] line. This suggests different origins and dynamics for the permitted and at least some of the forbidden lines. We also note the presence of weak interstellar absorption bands at 5780 (EW ) and 6284 (EW ).
| Line | EW (Å) | Line Fluxa | b | ||
| Hα | 414.2 | 49.5 | 34.44 | ||
| Hβ | 48.0 | 5.4 | 33.96 | ||
| Hγ | 10.4 | 1.2 | 33.49 | ||
| He I | 4471 | 3.6 | 0.8 | 32.93 | |
| 5875 | 46.1 | 4.4 | 33.52 | ||
| 6678 | 29.8 | 3.2 | 33.22 | ||
| 7165 | 69.5 | 7.8 | 33.52 | ||
| 7281 | 15.9 | 1.7 | 32.83 | ||
| He II | 4686 | 0.25 | 0.1 | 31.76 | |
| 5411 | 0.8 | 0.2 | 31.90 | ||
| O I | 8446 | 49.4 | 5.2 | 33.33 | |
| Fe II | 4414 | 1.6 | 0.4 | 32.58 | |
| Fe II | 5527 | 4.2 | 0.5 | 32.62 | |
| Fe II | 5746 | 8.8 | 1.0 | 32.87 | |
| O I | 6364 | 1.6 | 0.3 | 32.01 | |
| a In units of erg cm2 s-1 | |||||
| b In units of d erg s-1 | |||||
Using the ratios of some He I emission lines, particularly 4471, 5875 and 6678, it is possible to evaluate the – color excess (see Della Valle & Dürbeck (1993) and references therein). Comparing the theoretical and observed ratios of 5876/4471 and 6678/4471 we derive – and 1.60, respectively. This gives a mean –. Alternatively, the Hα/Hβ line ratio yields the lower value –; we anyway caution that in some cases the Balmer decrement may not be attributed only to the reddening effect (Whitney and Clayton (1989)). Nevertheless, using the mean of the values derived from the H and He line ratios we obtain –. This corresponds to a band absorption and, using the empirical formula of Predehl & Schmitt (1995), to an hydrogen column density cm-2. This value is about 40% higher than the Galactic hydrogen column density in the direction of CI Cam (Daltabuit and Meyer (1972)). This suggests that intrinsic absorption plays an important role. Indeed, from our measured value of NH, consistent with that measured during TOO2, we derive a 90% confidence interval of 4.13– cm-2 which translates to . Belloni et al. (1999) obtained a value of A by fitting the optical/IR spectrum of CI Cam with a combined Kurucz plus optical thin dust model (Waters et al. (1988)). Alternatively, Zorec (1998) derived for this source the higher value of A, which he interpreted as partly (2.88) due to the interstellar medium and partly (2.40) due to a dusty circumstellar envelope.
Doppler analysis of the most prominent emission lines of the two sets of spectral data shows that no substantial line shifts are detectable within the same night, i.e. the centroid line variations fall inside the measurement uncertainty of 0.1 Å. The same result is found when the December and January data sets are compared. Because it is quite likely that most of the observed lines originate in the ionized shell shrouding the system, the absence of line shifts cannot be used to establish a firm upper limit on the projected orbital velocity.
4 Discussion
The major problem in understanding the XTE J0421+560/CI Cam system is the fact that the nature of the components in the system is not well established. Miroshnichenko (1995), by fitting the optical continuum, derived a spectral type for the two CI Cam components as B0 V and K0 II, and an interstellar extinction AV of 1.1. The derived spectral type implies a distance of 6 kpc to reconcile with the observed magnitude. Miroshnichenko (1995) also fitted the optical continuum with a single star model, obtaining the same spectral type for the hot star, but a higher extinction (A). In the latter case, a distance of 2.4 kpc was estimated. With the value of estimated by Zorec (1998) a distance of 1.75 kpc was instead derived. From an observation of the H I absorption profile at 21 cm, Hjellming (private communication) inferred a distance of CI Cam of kpc, that is smaller than that inferred from the Zorec calculations, but not inconsistent with the measured magnitude, if an extinction AV of the order of 4 is assumed. It is therefore likely that the normal object is a hot star showing the B[e] phenomenon, with a dusty envelope responsible for the IR emission. This is confirmed by optical observations showing a spherical-symmetric shell expanding at 32 Km s-1 and present before the X–ray outburst, and an asymmetric shell, moving at 2000 Km s-1, which emerged from the low-velocity shell soon after the outburst (Robinson et al. (2000)). From the observed the quiescent optical emission cannot be due to re-processing of the X–rays, but has to be generated in the optical companion or the circumstellar material.
The nature of the compact object present in XTE J0421+560 is not revealed by the observation of X–ray phenomena typical of black hole (BH), neutron star (NS), or white dwarf (WD) systems, therefore their presence can only be inferred indirectly by comparison with the phenomenology observed in other systems in which the compact object is known. The weakness of this approach is the peculiarity of the XTE J0421+560 phenomenology, that makes it a unique system amongst the class of SXTs.
In the presence of a BH system an X–ray outburst can occur either via an accretion disc instability or through a mass transfer instability (see e.g. Osaki (1996)). The latter instability is unlikely to work in XTE J0421+560 because of the lack of hard (7 keV) X–ray photons in the quiescent spectrum. Indeed, if the transient event is due to mass loss instability that arises in the secondary star as a result of X–ray illumination of the atmosphere, then hard X–ray photons are required in order to start the instability and therefore produce the outburst (Hameury et al. (1986)). The observed quiescent X–ray luminosity is not sufficient to trigger this mass-overflow instability (see e.g. Mineshige et al. (1992)). Indeed, for this instability to work it is necessary that the X–ray flux (E7 keV) at the inner Lagrangian point and the stellar flux at be comparable (Hameury et al. (1986)). The X–ray flux at (assuming isotropic emission) is , where is the distance between and the compact object. The stellar flux at is , where is the orbital separation. Therefore the mass-transfer instability will work if , where and are the compact object and the companion masses, respectively. From our observed value 7 kev)/ we conclude that it is quite unlikely for the mass-overflow instability to take place in the XTE J0421+560/CI Cam system. The presence of an accretion disc would produce a strong temporal variability, and double peaked emission lines in the optical spectrum of SXTs, expecially Hα and Hβ (Robinson et al. (1994); Horne and Marsh (1986)). While temporal variability was observed in XTE J0421+560 only in the soft (E1 keV) energy range soon after the burst and attributed to the relativistic jets (Frontera et al. (1998)), the optical lines did not show the presence of double peaks. From our data we are not able to distinguish if this is due to the presence of circumstellar matter that smears the double peaked lines into single peaked ones, or due to the real absence of an accretion disc. It is worth noting at this point that there is a class of binaries, namely the SW Sex cataclysmic variables, in which the presence of an accretion disc does not correspond to the presence of double peaked emission lines (see e.g. Dhillon et al. (1997)). Finally, the short outburst duration and the temporal evolution of the X–ray spectrum from the outburst to quiescence is not typical of a BH system, which is characterized by a two-component spectrum (see e.g. White et al. (1984)): a thermal-like (1 keV) and a high energy power-law tail that becomes comparatively stronger as the source weakens, leading to spectral changes not observed in XTE J0421+560 (however GS 2023+338 and GRO J0422+32 do not show the soft component; see Barret et al. (1996)). Also the observed very high power-law index (see Table 1) is in contrast with a typical BH system (Barret et al. (1996). An exception is A0620–00; Coe et al. (1976)). Although we cannot firmly exclude the presence of a BH in XTE J0421+560, for these reasons we consider it unlikely.
Next the NS case: the presence of an accretion disc is unlikely because of the same considerations given for the BH case. Also the presence of a hot, optically thin corona around the NS is excluded by the lack of hard X–ray emission in quiescence (Breedon et al. (1986)). While the majority of X–rays from a BH system probably comes from an accretion disc, in the case of a NS system the surface of the compact object can also be a source of X–rays. The eV temperature observed in XTE J0421+560 and its X–ray luminosity would correspond to an emitting area of 1 Km2, too small to be produced at the surface of a NS unless funnelling of the accretion by the magnetic field onto a small area is introduced. This emitting area estimate is however based on the assumption of blackbody emission from the NS surface. It has been shown that because of cooling and back warming effects at the surface the spectrum differs significantly from that of a blackbody (London et al. (1986)), with the effect that the emitting area can be understimated by as much as 2 orders of magnitudes. Fits with Hydrogen atmosphere spectral models to three type I bursting NS systems have shown the consistency of the emitting area with a 10 Km radius NS (Rutledge et al. (1999)). Because our is quite similar to that observed in these three systems, we are not able to exclude that XTE J0421+560 contains a NS, although this is not supported by direct evidence, such as type I X–ray bursts or coherent pulsation (that could have been smeared out by the circumstellar matter).
We finally discuss the possibility that XTE J0421+560/ CI Cam is a binary system containing a WD. Thermal emission from the WD surface is not able to explain the observed quiescent X–ray luminosity unless only a very small fraction of the WD is responsible of the X–ray emission. Indeed a typical photon energy of eV, where is the fraction of the WD surface that emits X–rays, is implied. Therefore the most likely process is direct accretion from the companion star. For a 1 M⊙, = cm WD, the accretion rate is 10-12 d M⊙ yr-1. For such a low rate we expect that the main cooling mechanism is not free-free (bremsstrahlung) emission but thermal cyclotron emission (Lamb and Master (1979)), with the consequence that a two-temperature thermal spectrum is expected. Indeed, ROSAT observations of AM Her systems in low-state show two-temperature spectra, with in qualitative agreement with that observed in XTE J0421+560 (Ramsay et al. (1995)). Anyway, a more detailed analysis, beyond the scope of this work, is needed to quantitatively describe the quiescence XTE J0421+560 X–ray spectrum.
In the framework of a WD system scenario, the outburst experienced by XTE J0421+560 would be associated to a thermonuclear runaway on the surface of a M⊙ hot WD. The calculations performed by Iben (1982; Section V, page 254) show that a peak duration of about one week or less, depending on the accretion rate, can be achieved, with a burst recurrence time 500 yr. Furthermore, if the WD is young enough to suffer its first thermonuclear instability then it could be thermally unsettled (Sion and Ready (1992)), and therefore have not yet achieved the long term equilibrium between accretion rate and nuclear burning, with the possible consequence of a short post-burst phase. Of course, for a quantitative description of the outburst a detailed application of the Iben’s calculations, beyond the scope of this paper, must be carried out. From a qualitatively point of view, the onset of the soft (moving) component observed during TOO2 (Orr et al. (1998)) would be explained in terms of ejection of the H- and He-rich layers. This would also explain the reduction of the He I intensity observed in the quiescent optical spectrum. The outburst radio emission would be due to relativistic electrons accelerated in the outward-moving shock (see e.g. Hjellming and Han (1995)), while the quiescent (shell-like) radio emission would be due to the slower motion of the layers.
The low ionization state lines such as Fe II observed from the optical spectrum could then arise on the surface of the cool component because of irradiation by the hot star (see Hoffmaister et al. (1985) and references therein), while the high-excitation emission lines such as Fe XXIV could be due either to an extended nebular shell shrouding the system, or to the reflection of the X–rays on the optically thick cold matter on the companion’s surface.
Finally, we can exclude that the X–rays observed from XTE J0421+560 during quiescence come directly from the optical star if it is of spectral type OB. Indeed, surveys with the Einstein Observatory showed that OB stars are emitters of soft (4 keV) X–ray photons (Long and White (1980)). Pallavicini et al. (1981) have shown that for OB stars a relation between X–ray and bolometric luminosity holds: . From a typical effective temperature for a B star of ∘K we infer erg s-1. With our value of we obtain , at least two orders of magnitude greater that that expected from OB stars. Therefore we conclude that the observed quiescent X–ray emission cannot be due to a B star.
5 Summary and conclusions
We have shown that the quiescent X–ray spectrum observed from XTE J0421+560 can be fit with the same model used soon after its outburst, namely a two temperature bremsstrahlung. While the lower temperature, of the order of few hundreds eV, did not change between TOO2 and this observation, the higher temperature decreased considerably. The optical spectrum is very complex, and it is not possible to determine a spectral class for the system components. We discussed the nature of the compact object present in the system, and taking into account the peculiarity of the source, and the difficulty to compare its properties with those of typical systems, we conclude that it is unlikely for the XTE J0421+560/CI Cam system to contain a BH. Both a NS and a WD are possible, but the WD hypothesis is more appealing because it better fits the observational scenario: a two-temperature thermal spectrum for the X–ray emission, the lack of any temporal variability, and the presence of shell like motion observed in radio, that can be explained in terms of ejection of H- and He-rich layers during the outburst due to a thermonuclear runaway. This also fits nicely with the observed reduction of the He I line strengths when compared to observations performed before the outburst.
Finally, we can exclude that the X–ray luminosity observed in quiescence is due to the optical star if it is of spectral type OB. Moreover, the optical emission cannot be due to re-processing of the X–rays because .
Acknowledgements.
We wish to thank Bob Hjellming for letting us know prior publication the XTE J0421+560 distance as obtained from his radio observations. We thank the anonymous referee for helpful comments that greatly improved the paper. BeppoSAX is a joint Italian and Dutch programme. This research was supported in part by the Italian Space Agency.References
- Barret et al. (1996) Barret D., McClintock J.E., and Grindlay J.E., 1996, ApJ 473, 963
- Belloni et al. (1999) Belloni T., Dieters S., van den Ancker M.E., Fender R.P., Fox D.W., Harmon B.A., van der Klis M., Kommers J.M., Lewin W.H.G., and van Paradijs J., 1999, ApJ 527, 345
- (3) Boella G., Butler R.C., Perola G.C., Piro L., Scarsi L., and Bleeker J., 1997a, A&AS 122, 299
- (4) Boella G., Chiappetti L., Conti G., Cusumano G., Del Sordo S., La Rosa G., Maccarone M.C., Mineo T., Molendi S., Re S., Sacco B., and Tripiciano M., 1997b, A&AS 122, 327
- Breedon et al. (1986) Breedon L.M., Turner M.J.L., King A.R., and Courvoisier T.J.L., 1986, MNRAS 218, 487
- Chiappetti and Dal Fiume (1997) Chiappetti L. and Dal Fiume D., 1997, in di Gesú V., Duff M.J.B., Heck A., Maccarone M.C., Scarsi L., and Zimmermann H.U. (eds.), Proceedings of the 5th International Workshop on Data Analysis in Astronomy, p. 101, World Scientific Publ. Co., held at CCSEM Center, Erice, Italy on October 1996
- Chkhikvadze (1970) Chkhikvadze Y.N., 1970, Astrofiz. 6, 65
- Coe et al. (1976) Coe M.J., Engel A.R., and Quenby J.J., 1976, Nat 259, 544
- Daltabuit and Meyer (1972) Daltabuit E. and Meyer S., 1972, A&A 20, 415
- Della Valle and Dürbeck (1993) Della Valle M. and Dürbeck H.W., 1993, A&A 275, 239
- Dhillon et al. (1997) Dhillon V.S., Marsh T.R., and Jones D.H.P., 1997, MNRAS 291, 694
- Downes (1984) Downes R.A., 1984, PASP 96, 807
- Fiore et al. (1999) Fiore F., Guainazzi M., and Grandi P., 1999, Cookbook for BeppoSAX NFI spectral analysis, Technical Report 1.2, BeppoSAX Scientific Data Center, available online at ftp://www.sdc.asi.it/pub/sax/doc/software_docs/saxabc_v1.2.ps
- Frontera et al. (1997) Frontera F., Costa E., Dal Fiume D., Feroci M., Nicastro L., Orlandini M., Palazzi E., and Zavattini G., 1997, A&AS 122, 357
- Frontera et al. (1998) Frontera F., Orlandini M., Amati L., Dal Fiume D., Masetti N., Orr A., Parmar A.N., Brocato E., Raimondo G., Piersimoni A., Tavani M., and Remillard R.A., 1998, A&A 339, L69
- Hameury et al. (1986) Hameury J.M., King A.R., and Lasota J.P., 1986, A&A 162, 71
- Harmon et al. (1998) Harmon B.A., Fishman G.J., and Paciesas W.S., 1998, IAU Circ. 6874
- Hjellming and Han (1995) Hjellming R.M. and Han X., 1995, in Lewin W.H.G. and van den Heuvel E.P.J. (eds.), X–ray binaries, p. 308, Cambridge University Press
- Hjellming and Mioduszewski (1998) Hjellming R.M. and Mioduszewski A.J., 1998, IAU Circ. 6872
- Hjellming et al. (1998) Hjellming R.M., Mioduszewski A.J., Ghigo F., Rupen M.P., and Waltman E.B., 1998, BAAS 192, 78.05
- Hoffmeister et al. (1985) Hoffmeister C., Richter G., and Wenzel W., 1985, Variable Stars, Springer-Velarg
- Horne and Marsh (1986) Horne K. and Marsh T.R., 1986, MNRAS 218, 761
- Iben (1982) Iben I., 1982, ApJ 259, 244
- Lamb and Master (1979) Lamb D.Q. and Master A.R., 1979, ApJ 234, L117
- Lamers et al. (1999) Lamers H.J.G.L.M., Zickgraf F., de Winter D., Houziaux L., and Zorec J., 1999, A&A 340, 117
- Lammers (1997) Lammers U., 1997, The SAX/LECS Data Analysis System User Manual, SAX/LEDA/0010
- London et al. (1986) London R.A., Taam R.E., and Howard W.M., 1986, ApJ 306, 170
- Long and White (1980) Long K.S. and White R.L., 1980, ApJ 239, L65
- Manzo et al. (1997) Manzo G., Giarrusso S., Santangelo A., Ciralli F., Fazio G., Piraino S., and Segreto A., 1997, A&AS 122, 341
- Marshall et al. (1998) Marshall F., Strohmayer T.E., and Lewin W.H.G., 1998, IAU Circ. 6857
- Mineshige et al. (1992) Mineshige S., Ebisawa K., Takizawa M., Tanaka Y., Hayashida K., Kitamoto S., Miyamoto S., and Terada K., 1992, PASJ 44, 117
- Miroshnichenko (1995) Miroshnichenko A.S., 1995, A&AT 6, 251
- Nogami (1999) Nogami D., 1999, available online at http://www.kusastro.kyoto-u.ac.jp/vsnet/Xray/cicam.html
- Orlandini et al. (1998) Orlandini M., Dal Fiume D., Frontera F., Antonelli L.A., Piro L., and Parmar A.N., 1998, IAU Circ. 6868
- Orr et al. (1998) Orr A., Parmar A.N., Orlandini M., Frontera F., Dal Fiume D., Segreto A., Santangelo A., and Tavani M., 1998, A&A 340, L19
- Osaki (1996) Osaki Y., 1996, PASP 108, 39
- Pallavicini et al. (1981) Pallavicini R., Golub L., Rosner R., Vaiana G.S., Ayres T., and Linsky J.L., 1981, ApJ 248, 279
- Parmar et al. (1997) Parmar A.N., Martin D.D.E., Bavdaz M., Favata F., Kuulkers E., Vacanti G., Lammers U., Peacock A., and Taylor B.G., 1997, A&AS 122, 309
- Parmar et al. (1999) Parmar A.N., Oosterbroek T., Orr A., Guainazzi M., Shane N., Freyberg M.J., Ricci D., and Malizia A., 1999, A&AS 136, 407
- Predehl and Schmitt (1995) Predehl P. and Schmitt J.H.M.M., 1995, A&A 293, 889
- Ramsay et al. (1995) Ramsay G., Cropper M., and Mason K.O., 1995, MNRAS 276, 1382
- Raymond and Smith (1977) Raymond J.C. and Smith B.W., 1977, ApJS 35, 419
- Robinson et al. (2000) Robinson E.L., Ivans I.I., and Welsh W.F., 2000, Astrophys. Lett. Comm., Proceedings of the X–ray Astronomy ’99 Conference. Abstract available on-line from http://www.tesre.bo.cnr.it/bo99/bo999_report.html
- Robinson et al. (1994) Robinson K., Bode M.F., Skopal A., Ivison R.J., and Meaburn J., 1994, MNRAS 269, 1
- Rutledge et al. (1999) Rutledge R.E., Bildstein L., Brown E.F., Pavlov G.G., and Zavlin V.E., 1999, ApJ 514, 945
- Sion and Ready (1992) Sion E.M. and Ready C.J., 1992, PASP 104, 87
- Smith et al. (1998) Smith D., Remillard R., Swank J., Takeshima T., and Smith E., 1998, IAU Circ. 6855
- Stetson (1987) Stetson P.B., 1987, PASP 99, 191
- Ueda et al. (1998) Ueda Y., Ishida M., Inoue H., Dotani T., Greiner J., and Lewin W.H.G., 1998, ApJ 508, L167
- Waters et al. (1988) Waters L.B.F.M., Cotè J., and Geballe T.R., 1988, A&A 203, 348
- White et al. (1984) White N.E., Kaluzienski J.L., and Swank J.H., 1984, in Woosley S. (ed.), High Energy Transients in Astrophysics, p. 31, AIP Conf. Proc. 115
- Whitney and Clayton (1989) Whitney B.A. and Clayton G.C., 1989, AJ 98, 297
- Zorec (1998) Zorec J., 1998, in Huberl M. and Jaschek C. (eds.), B[e] Stars, p. 27, Kluwer Academic Publishers