A broad-band X-ray view of NGC 4945
Abstract
We present the results of a BeppoSAX observation of the nearby spiral galaxy NGC 4945 in the 0.1–200 keV energy band. The nuclear X-ray emission emerges above 7 keV, through an absorber with column density a few cm-2. Its remarkable variability (doubling/halving timescale 104 s) is not associated with any appreciable spectral changes, ruling out variations of the interposed absorber or changes in the primary continuum shape. The intense iron Kα fluorescent emission line is likely to be produced by the same nuclear absorbing matte. Our estimate of the intrinsic nuclear power suggests that the active nucleus dominates the bolometric energy output ofNGC 4945, if its nucleus has a typical quasar ratio. This supports the idea that X-rays are the best energy band to search for absorbed AGN. The 0.1–5 keV emission is extended along the plane of the galaxy, and most likely due to a population of unresolved binaries, as believed to happen in several early-type galaxies. Alternatively, hot gas associated with a starburst-driven superwind outflow could substantially contribute to the extended emission above 1 keV.
Key Words.:
Galaxies: active – Galaxies: individual: NGC 4945 – Galaxies: nuclei – Galaxies: Seyfert – X-rays: galaxies1 Introduction
NGC 4945 is a nearby (z=0.0019 or 3.7 Mpc; Mauersberger et al. 1996), almost edge-on (inclination angle ) spiral galaxy, which exhibits a prominent dust lane crossing its plane. It is the third brightest extragalactic source in the IRAS point source catalog, and most of its infrared emission is concentrated in a compact nuclear region (Rice et al. 1988; Brock et al. 1988). It shows both starburst emission (Heckman et al. 1990; Koornneff 1993) and an H2O megamaser (Dos Santos & Lepine 1979). A region of extended optical-line emitting gas protrudes from the nucleus along the galaxy minor axis (Nakai 1989; Heckman et al. 1990). It is associated with a cavity open by a starburst superwind (Moorwood et al. 1996). X-ray observations with Ginga (Iwasawa et al. 1993) and ASCA (Iwasawa 1997) unveiled a highly obscured, strongly variable X-ray source. Actually NGC 4945 turned out to be the brightest Seyfert 2 and the second brightest radio-quiet Active Galactic Nucleus (AGN) after NGC 4151 of the 100 keV sky (Done et al. 1996).
NGC 4945 is one of the best examples of an active galaxy with a composite nature (starburst plus AGN). At wavelengths shorter than 1 keV, all its observational properties can be accounted for by starburst activity alone, despite its classification as a Seyfert in the Véron-Cetty and Véron (1989) catalog. For instance, a mass-to-light ratio of 0.18 is consistent with the parameter space solely occupied by starbursters (Oliva et al. 1999). Also in the Genzel et al. (1998) ISO diagnostic planes NGC 4945 is located in the regions occupied by starbursts. However, the presence of a strong continuum radio source and studies of the off-nuclear optical spectra have suggested the presence of a LINER (Whiteoak & Gardner 1979; Moorwood et al. 1996). The X-ray observations provided the final proof for the presence of an active nucleus. This confirms that hard X-ray emission can be the most efficient wavelength to identify the nature of obscured AGN (see e.g. the discussion in Vignati et al. 1999 for the case of NGC 6240).
Previous observations in the soft (0.1–2 keV) and intermediate (2–10 keV) X-rays showed a complexity, which is far from being completely resolved. The 3–10 keV Ginga spectrum (Iwasawa et al. 1993) could be fitted with a simple power-law with a photon index of about 1.7, interpreted as scattering of the primary nuclear continuum. The same description fits also the non-simultaneous Ginga, ASCA and OSSE spectra (Done et al. 1996). A huge (Equivalent Width, EW, 1–1.5 keV) iron line has been observed as well, whose centroid energy is consistent with Kα fluorescence from neutral or mildly ionized iron. The ASCA image is clearly extended, but the irregular, broad shape of the instrumental Point Spread Function (PSF) has prevented any detailed studies. The ROSAT PSPC and HRI images of NGC 4945 revealed a complex pattern. Brandt et al. (1996) detected at least five discrete sources, one of them variable by about one order of magnitude on timescales of hundreds days. A diffuse emission up to a distance of about 5 from the nucleus, and elongated along the plane of the galaxy, was measured as well.
The scientific payload on board BeppoSAX (Boella et al. 1997a) is particularly well suited to study this source and resolve at least part of this complexity. It combines the widest X-ray broadband coverage, the highest sensitivity above 10 keV and the sharpest 2–10 keV PSF ever flown before the advent of Chandra. We report in this paper the results of a BeppoSAX observation performed on July 1999. At the distance of NGC 4945, 1 corresponds to about 1.1 kpc.
In this paper: energies are quoted in the source rest frame; uncertainties on the spectral parameters are quoted at the 90% level for one interesting parameter (); the cosmology used assumes km s-1 Mpc-1 and ; J2000 coordinates are used, unless otherwise specified. The Galactic column density along the line of sight is assumed to be cm-2 (Heiles & Cleary 1979). The errors on the energies measured by the MECS take into account a systematics of 0.8% at 6 keV (Guainazzi & Molendi, 1999). Xspec 10 was used for spectral analysis.
The paper is organized as follows. In Sect. 2 the data reduction procedures are described. In Sect. 3 we will deal with the analysis of the LECS and MECS images. We will report the detection in the intermediate X-rays of two discrete sources in the SE outskirts of the NGC 4945 spatial profile (Sect. 3.1), and study the residual unresolved diffuse emission (Sect. 3.3). We present also a reanalysis of ROSAT/PSPC archival data of the NGC 4945 field (Sect. 3.2). The properties of the hard (i.e.: 10 keV) X-ray emission will be studied in Sect. 4.1. In Sect. 4.2 we will describe the broadband X-ray spectrum with standard fitting techniques. We will discuss our findings in Sect. 5 and summarize them in Sect. 6.
2 Observation and Data Reduction
NGC 4945 was observed by BeppoSAX from July 1 04:43 UTC to July 3 1999 09:18 UTC. The scientific payload onboard BeppoSAX comprises two gas scintillation proportional counters with imaging capabilities: the Low Energy Concentrator Spectrometer (LECS; Parmar et al. 1997), and the Medium Energy Concentrator Spectrometer (MECS; Boella et al. 1997b). The LECS has a nominal bandpass of 0.1–10 keV, with an energy resolution of 4% at 1 keV and 8% at 6 keV. The field of view has a diameter of 37. The angular resolution at 2 keV is 2.1 Full Width Half Maximum (FWHM), but degrades to 9.7 below the Carbon edge (i.e., keV). The MECS has similar energy resolution, but a wider field of view (57 diameter), a narrower sensitive bandpass (1.8–10.5 keV) and about a factor of two higher effective area in the overlapping energy interval, after the failure of one of the three original units in May 1997. The 80% power radius of the PSF is comprised between 2.5 and 2.75. The BeppoSAX payload also includes two collimated instruments, mounted on a rocking system to achieve a continuous monitoring of the background, with a duty-cycle of 96 s. The High Pressure Gas Scintillator Proportional Counter was switched off during the NGC 4945 observation. The Phoswitch Detector System (PDS; Frontera et al. 1997) possesses an unprecedented sensitivity in its 13–200 keV nominal bandpass.
The data reduction followed standard procedures, as described e.g. in Guainazzi et al. (1999b). In particular, good time intervals for the extraction of scientific products were selected only when the star tracker aligned with the pointing direction was operative. This condition allows the best attitude reconstruction. The absolute pointing accuracy under these conditions is better than 1, the relative better than 30 for sources as bright as NGC 4945. The resulting net exposure times are about 38.8 ks, 86.7 ks and 87.6 ks in the LECS, MECS and PDS, respectively. PDS data have been reduced using fixed Rise Time thresholds to reject the particle background, as appropriate for sources brighter then s-1. The PDS points continuously at the nominal target with only two of its four units, the others monitoring the background.
MECS background spectra were extracted from blank deep field exposures, accumulated by the BeppoSAX Science Data Center (SDC) in the first three years of the mission. The same method applied to the LECS spectra yields systematically negative counts below the carbon edge. We have therefore extracted LECS background spectra from two semi-annuli in the LECS field of view, and suitably renormalized them to the source extraction region, as described in Parmar et al. (1999). The background subtraction in PDS light curves and spectra has been performed by plain subtraction of the “off-source” from the “on-source” products. The systematic uncertainties of this method are lower than s-1 in the full PDS sensitive energy bandpass (Guainazzi & Matteuzzi 1997). Spectra and light curves of NGC 4945, unless otherwise specified, have been extracted from circular regions of 8 radius around the best-fit centroid of the 2–10 keV image. The position of the centroid is slightly dependent on energy. However, the dynamical range of these fluctuations is of the order of 20, well within the accuracy of the positional reconstruction. The spectra were rebinned in order to: a) oversample the FWHM of the energy resolution by a factor at least 3; b) have at least 20 counts per spectral channel, to ensure the applicability of statistics. The background-subtracted count rates are: s-1 (0.1–4 keV); s-1 (1.8–10.5 keV); s-1 (13–200 keV) in the LECS, MECS and PDS, respectively (in brackets the energy intervals where each instrument is currently well calibrated). The September 1997 calibration release is adopted throughout this paper. No known bright sources are present in the PDS field of view apart from NGC 4945 itself, and the probability of a serendipitous source with a flux equal or larger than NGC 4945 is , if the 2–10 keV ASCA LogN-LogS (Cagnoni et al. 1998) is adopted and the lowest extrapolation of the unabsorbed 2–10 keV flux is assumed (see Sect. 4.1).
3 Image Analysis in the 0.1-10 keV Energy Band
3.1 The serendipitous sources
The rather large visual extent of NGC 4945 (320) is well encompassed within the fields of view of both the LECS and the MECS. It is therefore possible with BeppoSAX to compare directly the shapes of the optical and of the X-ray images. In Fig. 1
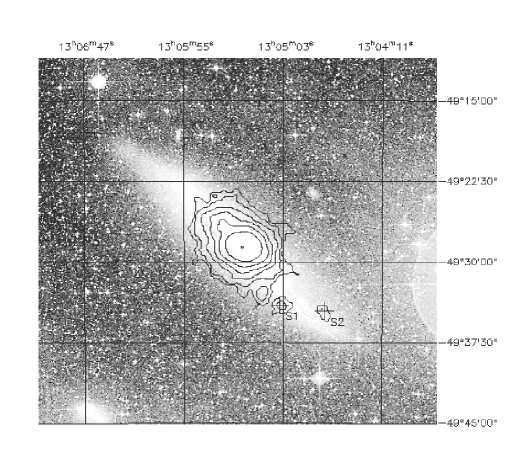
we superpose the 2–10 keV (MECS) iso-intensity contours with the ESO Digitalized Sky Survey image. The MECS contours are well aligned with the main plane of the host galaxy. Actually, part of the X-ray extension is likely to be due to the presence of discrete sources. Apart from the nucleus, one source is detected at a signal-to-noise ratio 5 (S1 hereinafter). Its coordinates are ; , and it is therefore located 6.2 SW from the nucleus. Assuming (the 90% upper limit on if left free in the fit is cm-2), its spectrum (extracted from a 2 circular region) can be modeled with a power-law with ( dof; see Fig. 2)

or a thermal bremsstrahlung with keV ( dof). The net background subtracted count rate is s-1 in the 2–10 keV band, corresponding to a flux of erg cm-2 s-1 and a rest-frame luminosity of erg s-1 at the distance of NGC 4945. The search for a periodic modulation has produced no significant peak, hardly surprising, since only 147 photons are counted from S1. Another detection at the 4 level [count rate s-1] corresponds to the following position: ; (9 SW from the center). The faintness of this source, and its location below the MECS strongback rib prevent us from performing any reliable flux determination or spectral analysis.
In Fig 3, we show the NGC 4945 field
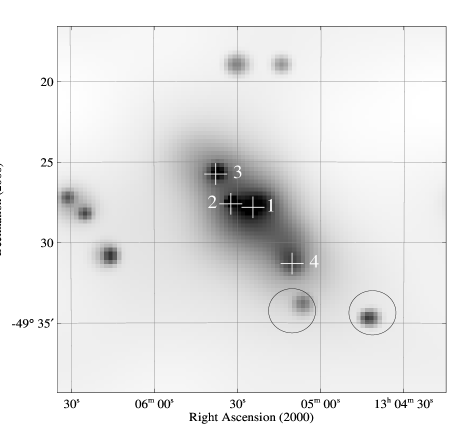
imaged by the ROSAT/PSPC on August 1992 and July 1993, for a total net exposure time of 14.2 and 9.0 ks, respectively. The BeppoSAX sources coincide with two of those detected by ROSAT within the 1 positional accuracy. The extrapolation of the S1 MECS best-fit into the PSPC band predicts photons, reasonably close to the observed 33 PSPC background-subtracted source counts. Despite the relatively high Galactic latitude of NGC 4945 (), the possibility that either or both S1 and S2 is a Galactic foreground object cannot be ruled out by our data alone. No known source is included in the Simbad or Ned databases within 2 from the best-fit MECS positions. If cm-2 (appropriate for a Galactic source at the distance of approximately 0.5 kpc), the extrapolation of the MECS best-fit would exceed the ROSAT flux by a factor of four, which could be accounted for by intrinsic variability. Analogously the extrapolation of the MECS spectrum remains consistent with the ROSAT detection within a factor of a few for absorbing column density cm-2. It is therefore also possible that S1 is a background object, seen through a moderate column density of the galaxy.
3.2 The ROSAT nuclear sources
The ROSAT PSPC detects four sources within the innermost NGC 4945 5 (see Fig. 3). Their coordinates and count rates are listed in Tab. 1. All of them exhibit a certain amount of
| a.b | a,c | d | |||
|---|---|---|---|---|---|
| (10-2 s -1) | (10-2s -1) | () | |||
| #1 | 0.6 | ||||
| #2 | 0.9 | ||||
| #3 | 2.9 | ||||
| #4 | …e | 4.3 |
a0.1–2.4 keV PSPC background subtracted count rate
bAugust 1992 observation
cJuly 1993 observation
ddistance from the galaxy optical nucleus
enot detected
variability. It is interesting to notice that none of them strictly coincides with the optical nucleus of the galaxy, the closest being located 0.6 SE. An extended diffuse emission along the galactic plane is also present, whose integrated count rate is about 3–4 s-1 (i.e., about the same as the sum of the detected discrete sources). No reliable spectral information can be obtained from any of the above sources. If their spectrum is a power-law with (1), they may contribute 15% (50%) of the observed 2–10 keV MECS flux.
3.3 The diffuse emission in BeppoSAX
In order to provide a quantitative estimate of the intrinsic extension and ellipticity of the BeppoSAX X-ray images, we extracted the counts along two perpendicular strips crossing the optical center of the galaxy in the 0.1-2 keV (LECS) and 2–10 keV (MECS) energy bands, respectively. The strip directions are defined by the following pair of coordinates: (; ) and (; ) for the strip parallel to the plane of the galaxy (i.e.: NE to SW); (; ) and (; ) for the strip perpendicular to the plane of the galaxy (i.e.: NW to SE). The width of the strips is 4′, comparable with the intrinsic width of the instrumental PSF (Parmar et al. 1997; Boella et al. 1997b). This choice is actually likely to discard the bulk of the photons emitted below the carbon edge, where the LECS detector PSF is the broadest. However, this effect is negligible in our case, because the photoelectric absorption due to the matter in our Galaxy along the line of sight of NGC 4945 is large enough to substantially suppress the photons in this band. The results are shown in Fig. 4, as count rate space density as a function of the offset angle towards the galaxy center (note that the offset increases for decreasing RA). The MECS image shows clearly a larger extent


in the direction parallel to the galaxy plane for all offset angles between -4 and 8. Comparison at larger angles is made impossible by the shadow of the strongback support ring in the MECS field of view. The difference between the profiles along the parallel and perpendicular directions is rather symmetric within 4, while an excess tail is evident at larger offset radii only for positive offsets (cf. the inset in the right panel of Fig. 4), due to the presence of the discrete sources detected by the MECS.
In the same Fig. 4, we compare the observed NGC 4945 profile with point-like sources, whose data have been reduced under the same experimental conditions as the NGC 4945 ones. In order to avoid any systematic effects due to the dependence of the PSF with energy, we have chosen two sources contained in the archive of the BeppoSAX public observations, whose spectrum is similar to that observed in NGC 4945. The 0.1–2 keV LECS spectrum of NGC 4945 can be formally well approximated by a photoelectrically absorbed power-law, with parameters: ; cm-2. This model is consistent, within the statistical uncertainties, with that describing the LECS spectrum of the black-hole candidate LMC X-3 in the same energy band (Siddiqui et al. 1999). The 2–10 keV MECS continuum of NGC 4945 is well approximated by a power-law, with . The comparison for the MECS is made against the profile of the quasar 3C273 (Grandi et al. 1997). The presence of a prominent iron line in the NGC 4945 spectrum (Iwasawa et al. 1993), which is absent in 3C273, makes a negligible difference in this context. Even the profile perpendicular to the galaxy plane is broader than the instrumental PSF within 3–4. However, caution has to be used in interpreting the last result, as the residual inaccuracies in the attitude reconstruction could significantly affect the significance of the last result, whereas no doubt exists about the true nature of the extension along the galaxy plane.
As a further step, we have studied the energy dependence of the X-ray image profile along the plane of the galaxy with the MECS (an analogous study with the LECS is hampered by the much poorer statistics and the broader instrumental PSF). The results of such a study are shown in Fig. 5. They

are compared with the width expected on the basis of the instrumental PSF, weighted on the energy assuming a power-law spectrum of photon index (dash-dotted line in Fig. 5). The X-ray MECS image is significantly extended in the whole range between 2 and 5 keV, whereas it becomes consistent with that expected from a point-like source for keV. It is difficult with our data to assess a systematic trend between 2 and 5 keV. If we consider the face-on values, the profile width has a peak at 4 keV.
4 The X-ray Spectral Energy Distribution
In Fig. 6 we compare the 2 keV spectra of NGC 4945 and

NGC 1068, after they have been divided by the spectrum of the Crab Nebula. Since the latter is a power-law with photon index 2, this technique is very similar to a plot. In the intermediate X-ray band, the two spectra are similar. A careful inspection suggests that the emission line feature around 6 keV is broader and more intense in NGC 1068, indicating that more ionization stages contribute to its profile than in NGC 4945. The most remarkable difference is, however, at energies 10 keV. NGC 4945 is more than one order of magnitude brighter in the PDS, suggesting that a further component emerges - actually well connected with the higher end of the MECS sensitive bandpass. It is straightforward to identify this component with the primary nuclear continuum transmitted through an absorber with a column density of a few cm-2, originally discovered by Iwasawa et al. (1993). On the other hand, in NGC 1068, the archetypical example of totally Compton-thick Seyfert 2, the nuclear emission is completely suppressed.
4.1 The high-energy emission
As shown in Fig. 7, the PDS full band light curve exhibits

a remarkable variability. In three events the flux increases by about 60% in s, whereas a decrease by a factor 30% in s represents the most extreme variability episode. We have searched in vain for spectral changes associated with these flux variations. In Fig. 8 we show the hardness ratio (HR)

between the count rates in the 13–35 and 35–200 keV energy bands. No clear deviation from constancy is observed. If we fit the data points in Fig. 8 with a constant, degrees of freedom (dof). We will therefore hereinafter focus on the time-averaged spectrum only.
An absorbed power-law model yields a marginally acceptable fit to the PDS spectrum ( dof). We first modeled the extinction as an exponential function of the energy , where the cross-section includes both the effects of photoelectric absorption (model wabs in Xspec, with the abundances of Morrison & McCammon 1983) and of Compton scattering (model cabs in Xspec). The inclusion of a high-energy cutoff improves the quality of the fit by , for the decrease of one degree of freedom, which is significant at confidence level according to the F-test. The best-fit parameters and results are summarized in Tab. 2.
| Model | dof | |||
|---|---|---|---|---|
| ( cm-2) | (keV) | |||
| PLa | … | 62.3/47 | ||
| CPa | 54.7/46 | |||
| CPb | 57.7/46 |
aCompton absorption after model cabs in Xspec
bCompton scattering after Matt et al. (1999b; absorption model for optically thick Compton scattering). In comparison to the same model without high-energy cutoff
In Fig. 9 we show the iso-

confidence contours for versus the cutoff energy . At 90% confidence level for two interesting parameters, is comprised between 70 and 500 keV, the value corresponding to the best-fit being 110 keV. The addition of a Compton-reflection component from a plane-parallel infinite edge-on slab to the best-fit model (implying the decrease of a further degree of freedom to the fit, the relative normalization between the reflected and the transmitted component R; model pexrav in Xspec, Magdziarz & Zdziarski 1995) does not yield any further improvements to the fit. The 90% upper limit on R is 0.5. The 20–100 keV observed flux is erg cm-2 s-1. The extrapolation of the best fit model (second row of Tab. 2) to the 2–10 keV (0.1–200 keV) energy band yields an unabsorbed flux of () erg cm-2 s-1, corresponding to a rest-frame luminosity of () erg s-1.
At the level of cm-2, the matter is optically thick to Compton scattering. The cabs model in Xspec assumes, on the contrary, the simple Thompson cross-section. Neglecting the effects of electron scattering in the column may lead to a substantial overestimate of the true column density and, consequently, of the intrinsic nuclear luminosity (Leahy et al. 1989). Matt et al. (1999b) have recently developed a self-consistent model for X-ray absorption by matter which is optically thick to Compton-scattering and has a large covering factor. The application of such a model yields about 40% lower value for the column density. Moreover, the extrapolated intrinsic luminosities differ significantly. In the Matt et al. (1999b) model a fraction of the photons are scattered into the line of sight, and the nuclear luminosity required to explain the observed flux is lower. The extrapolation of the best fit model (row 3 in Tab. 2) yields an unabsorbed 1–10 keV (0.1–200 keV) flux of () erg cm-2 s-1, corresponding to a rest frame luminosity of () erg s-1. We will refer to these values hereinafter.
4.2 The broadband 0.1-200 keV spectrum
Given the spatial and spectral complexity emerging from the above analysis, a global description of the 0.1–200 keV spectrum in terms of standard fitting technique at the moderate spatial resolution and sensitivity provided by the BeppoSAX instruments is hardly more than an academic task. The soft and intermediate X-ray emission is likely to be produced by the superposition of radiation scattered/reprocessed in the nuclear environment (probably most contributing to the huge iron line), a population of discrete unresolved sources (binaries, cataclysmic variables, supernova remnants) and truly diffuse gas emission, each possibly seen through absorbers with different density and/or physical conditions. Such complex scenario will be fully understood when future observation with arc-second spatial resolution and/or much better sensitivity will be available. Given all these caveats, in this Section we will, however, try to accomplish this task, whose results has allowed us to extend previous studies of this kind.
In Fig. 10 we show the light curves in the 0.1–2 keV, 2–4 keV

and 4–10.5 keV energy bands, along with the corresponding HRs between adjacent bands. No significant variability of either quantity is observed. This is of course not surprising, because the bulk of the emission below 6 keV is extended on several kpc scale (see Sect. 3.3). Fit with a constant line of the HRs yield of 22.3/17 dof and 17.9/17, for HR1 (2–4 keV/0.1–2 keV) and HR2 (10.5–4 keV/2–4 keV), respectively. We are therefore justified in focusing on the time-averaged spectrum only.
The broadband spectrum of NGC 4945 was fitted using the following general formula:
The last term in brackets is the nuclear transmitted component emerging in the PDS, with normalization . and are the photoelectric and Compton cross-sections, respectively. We will use the cabs Xspec implementation for the latter. and are two continuum models, chosen according to one of either the following scenarios:
-
a)
is a power-law, produced by the scattering of the primary continuum by ionized matter, and is the thermal emission from a collisionally excited plasma. The index of the former is tied to be the same as . We will use the mekal Xspec implementation for the latter throughout this paper. This model provides a reasonable description of the spectra of some reflection-dominated Seyfert 2 galaxies, like Circinus Galaxy, NGC 1068 (Guainazzi et al. 1999a), or NGC 6240 (Iwasawa & Comastri 1998; Vignati et al. 1999). All these objects are characterized by a strong circumnuclear starburst and/or are infrared ultraluminous galaxies
-
b)
is a thermal plasma emission and is either a blackbody (b1) or a second thermal plasma (b2), which is the template model successfully employed to fit the Einstein, ROSAT and ASCA bulge emission of early-type galaxies (Bregman et al. 1995; Matsumoto et al. 1997; Kim et al. 1996; Irwin & Bregman 1999)
-
c)
is a power-law and is a Compton-reflection, both with the photon index tied to be the same as . This scenario follows the idea that the primary nuclear continuum undergoes both scattering by a warm plasma and Compton reflection, along two different optical paths.
To all models a Gaussian emission line was added. We allowed different absorbing column densities for the nuclear (warm-scattered and Compton-reflected power-law) and the thermal/non-nuclear components. Finally, we included in the models a power-law, with all the parameters frozen to the best-fit values obtained fitting the S1 spectrum alone (this contribution is not explicity indicated in the above formula for sake of clarity).
The best-fit parameters and results are shown in Tab. 3. The fit
| Thermal components | Power-law | |||||||||
| ( cm-2) | (keV) | (keV) | ( cm-2) | (%) | ( cm-2) | (keV) | ||||
| a) | 3.4 | … | 0.4/1b | 158.3/127 | ||||||
| b1)c | … | 0.4/12b | 158.3/127 | |||||||
| b2)c | … | …/12b | 155.3/125 | |||||||
| c) | … | … | … | … | 0.4/2 | 172.2/128 | ||||
awarm scattering fraction
bupper limit on the Compton reflection relative normalization parameter. It is calculated after adding this component to the best-fit model
cin scenario b1) an optically thin plasma thermal emission (columns 2–4) and a blackbody (column 5) are employed. In scenario b2) the blackbody is substituted by an optically thin plasma thermal emission
is actually only marginally acceptable for scenarios a) and b). However, no significant improvement is obtained if a further component (either a continuum, an emission line or an absorption edge) is added to any of the above models. No improvement in the quality of the fit in scenario a) is obtained if the warm scattered power-law spectral index is untied from . No systematics trend can be recognized in the residuals, as shown in Fig. 11. We checked that the rather high is


not due to residual systematics effects.
The fit results strongly argue against any Compton reflection component to substantially contribute to the broad band spectrum. The scenario c), which includes it explicitly, yields a significantly worse with a comparable number of degrees of freedom. The addition of a Compton reflection component to the other scenarios is not statistically justified. In scenario a), its 2–10 keV flux upper limit is erg cm-2 s-1, against a erg cm-2 s-1 flux of the warm scattered component in the same energy band.
The properties of the iron line are not strongly dependent on the adopted continuum (see Tab. 4). It remains narrow (intrinsic width eV) and
| Model | |||
|---|---|---|---|
| (keV) | (eV) | ( photons cm-2 s-1) | |
| a) | 150 | ||
| b1) | 140 | ||
| c) | 140 |
consistent with Kα fluorescence from neutral or mildly ionized iron (Fexx). If we extrapolate the best-fit model of raw 3 Tab. 2, and compare it with the observed line intensity, the iron line EW against the transmitted nuclear continuum alone is 1.3 keV.
Assuming the best-fit scenario b), the observed flux in the 0.1–2 keV (2–10 keV) energy band is () erg cm-2 s-1, corresponding to a rest frame unabsorbed luminosity of () erg s-1.
5 Discussion
5.1 The hard X-ray emission
NGC 4945 is confirmed to be one of the brightest extragalactic objects above 10 keV, where we are seeing the primary nuclear continuum, transmitted through an absorbing column density of a few cm-2. This interpretation is confirmed by the detection of rapid variability in the PDS emission, with a extrapolated doubling/halving time scale – s. Variation of a comparable amount were observed by Ginga in the 9.1–30 keV energy band (Iwasawa et al. 1993). is actually only an upper limit to the variability timescales of the primary continuum. If the absorbing matter is spherically distributed, such a relatively rapid variability must be related only to the fraction of nuclear photons, which are transmitted without being scattered. For , more than 2/3 of the 20–200 keV incoming photons are scattered (Matt et al. 1999b). This implies that the observed variability could be substantially diluted. If we suppose that the light curve in Fig. 7 is given by the sum of a constant plateau (scattered photons) and a variable contribution (unscattered photons), the latter has 2.6 times higher dynamical range, or, conversely, a lower by this amount. s is still not exceptional among Seyfert galaxies. It is interesting to notice that NGC 4945 is one of the nearby galaxies with the smallest estimate of the central dark object mass (; Greenhill et al. 1997). This suggests that NGC 4945 might be an absorbed version of NGC 4051 (Lawrence et al. 1985), accreting at a sizeable fraction () of the Eddington rate. Alternatively, our estimate of the intrinsic nuclear variability dynamical range could be lowered if the covering fraction of the absorber is much less than unity. The lack of any significant detection of Compton reflection in the broadband X-ray spectrum supports this hypothesis.
It is remarkable that no spectral variability is associated with these flux changes. This rules out that changes in the interposing absorbing medium are responsible for the observed flux variations. On the other hand, this suggests that the shape of the primary continuum in NGC 4945 is not significantly dependent on the intensity state. The infrared luminosity, ( erg s-1 if calculated according to Mulchaey et al. 1994), and our extrapolation of the 2–10 keV nuclear intrinsic luminosity ( erg s-1) lie well on the low luminosity end of the correlation observed in Seyferts for these two quantities (Mulchaey et al. 1994). If , as typical for quasars with erg s-1 (Elvis et al. 1994), the bolometric luminosity associated to the AGN is of the same order of magnitude as the observed infrared luminosity, and hence the AGN dominates the energy output, at variance with the deductions of Genzel et al. (1998) on the basis of the ISO spectrum (see Marconi et al. 1999 for a possible explanation of this discrepancy).
A high-energy cut-off in the primary nuclear continuum is measured for the first time. Its presence is significantly required in all the models adopted to describe the broadband emission, and in the PDS data alone as well. The cut-off energy cannot be, however, very well constrained, and values in the range 100-300 keV are possible. A reanalysis of the 50–500 keV OSSE spectrum yields a steeper index than measured by BeppoSAX (), and also the BATSE average spectrum shows evidence for a high-energy cutoff above 100 keV (A.Malizia, private communication). Such cut-off energies are well consistent with those measured in several Seyfert 1s so far, both by OSSE (Zdziarski et al. 1995; Madjeski et al. 1995) and BeppoSAX (Piro et al. 1998; Guainazzi et al. 1999b; Guainazzi et al. 1999c; Perola et al. 1999). Also the intrinsic spectral index of the primary nuclear continuum (ranging between 1.4 and 1.7 in the various models) is slightly but not exceptionally flat among Seyfert galaxies (Nandra et al. 1997; Turner et al. 1997).
5.2 The 0.1–6 keV extended emission: unresolved discrete sources or truly diffuse emission?
The total suppression of the transmitted component below 8 keV allows us to observe other spectral components, which are at least in part associated with the host galaxy. The emission in the 0.1–6 keV energy band is clearly extended along the plane of the host galaxy, thus dismissing the possibility that the bulk of the intermediate X-ray emission is due to scattering of the nuclear radiation only (Iwasawa et al. 1993). In the MECS image at least two sources are detected with a signal-to-noise ratio higher than 3. The spectral properties and luminosity of the brightest are consistent with a binary system accreting at sizeable fraction of the Eddington luminosity, if it is indeed associated with NGC 4945. Other explanations are, however, not excluded by our data. If the contribution of these sources is taken into account, a significant extended emission remains within at least the innermost 5 kpc, whose extent is almost symmetric with respect to the nucleus. This would lead to the conclusion that it is produced in a truly diffuse interstellar medium. There is, however, no way of determining the amount of the contribution of any unresolved underlying sources. The ROSAT/PSPC images of NGC 4945 suggest that at least 50% of the 0.1–2.4 keV photons are produced by discrete sources. However, the extrapolation of the contribution of these sources in the MECS band yields a fraction of the observed flux varying between 15% and 50%, if a power-law with comprised between 1 and 2 is assumed. The study of a large sample of early type galaxies with ASCA and BeppoSAX suggests that the bulk of the emission above 1 keV probably originates as the integrated emission from X-ray binaries (Matsumoto et al. 1997; Trincheri et al. 1999). A complete characterization of the properties of this extended emission should await the superior spatial resolution and sensitivity available with the scientific payloads onboard Chandra and XMM. What BeppoSAX data can clearly show is that both the iron line and the continuum above 7 keV (where the presence of the transmitted primary nuclear continuum starts to be dominant) are, by contrast, produced by a point-like region (at least as seen by the MECS). This strongly supports a nuclear origin for both components.
5.3 The broadband X-ray spectrum
The 0.1–10 keV continuum can be fit with the superposition of a single temperature thermal emission from a collisionally excited plasma with keV and a warm scattered nuclear power-law, with a scattering fraction 0.4%. This model has already been successfully employed to describe the moderate resolution intermediate X-ray spectrum of several Compton-thick Seyfert 2 galaxies (Turner et al. 1997; Guainazzi et al. 1999a; Vignati et al. 1999). Two main differences are, however, present. The warm scattered power-law is seen through a substantial absorbing column density of cm-2. This might imply that the nuclear region is encompassed by absorbing matter also on scales with are much larger than the dimension of the Compton-thick structures, which almost suppress the direct view of the nucleus. It is straightforward to associate it with the prominent dust lanes crossing the galaxy plane, although the presence of a starburst ring on a 100-pc scale (Marconi et al. 1999) provides a possible alternative source of absorption (Fabian et al. 1999). Recent HST NICMOS observations suggest that the active nucleus in NGC 4945 might be obscured along all lines of sight by matter with – cm-2 (Marconi et al. 1999). On the other hand, the thermal component has a much higher temperature than typically associated with the X-ray emitting nuclear starburst in the Seyfert 2s (500 eV). Again, this may simply be telling us that the single temperature description of this component is too a crude approximation. Scenario a), however, can hardly be reconciled with the fact that the bulk of the emission below 6 keV is extended on scales larger than a few kpc. The warm scattered power-law, in fact, dominates the fit in the whole 3–10 keV range, therefore also where the emission is extended. This is almost at odds with its supposed nuclear origin. The power-law could of course represent only a phenomenological description of a different source of radiation, e.g. the contribution of a population of unresolved discrete sources.
A formally equivalent description of the soft/intermediate X-ray spectrum is provided in the framework of the two thermal components template, used to fit the integrated bulge emission of X-ray faint early-type galaxies (Bregman et al. 1995; Kim et al. 1996; Matsumoto et al. 1997; Irwin & Bregman 1999). The temperature obtained with BeppoSAX for the hotter component is remarkably consistent with that measured on other early type galaxies, whereas the typical temperature of the soft component is slightly lower than usual (Matsumoto et al. 1997; Irwin & Bregman 1999), although consistent with that measured by ASCA in at least one case (NGC 4392; Matsumoto et al. 1997). The fact that at least 50% of the soft X-rays originate in discrete sources (see Sect. 3.2) is in agreement with the results on M 31 (Primini et al. 1993; Irwin & Bregman 1999; Trincheri et al. 1999). On the other hand, Brandt et al. (1996) report a diffuse emission using the ROSAT/HRI on scales of 5 along the plane of NGC 4945, which is consistent with our reanalysis of the same data. Obviously, there is no way in this scenario to produce a neutral iron line with 1 keV EW. Actually, such lines have never been observed in the integrated spectra of early type galaxies (Matsushita et al. 1994; Matsumoto et al. 1997). The origin of the line must therefore be connected with the nuclear activity.
Recent studies suggest a possible alternative interpretation. In M 82 and NGC 253 (Cappi et al. 1999b), the intermediate X-rays are dominated by hot gas with 6–9 keV, probably associated with starburst superwind outflows protruding from the galaxy disks. The observed iron abundances are strongly sub-solar. If this scenario is viable also for NGC 4945, these abundances can explain the lack of detection of fluorescent emission from highly ionized iron. The presence of a wind-blown cavity (Moorwood et al. 1996) strongly supports the existence of a starburst superwind in NGC 4945. Again, high resolution imaging with Chandra and XMM will provide invaluable contributions to resolve this issue.
5.4 The iron line: signature of the nuclear absorber?
The spectral fits do not require the presence of any component associated with Compton-reflection from the inner side of the putative molecular torus surrounding the nuclear region, as observed in NGC 1068 (Matt et al. 1997) or Circinus Galaxy (Matt et al. 1999a). This rules out the most straightforward interpretation for the origin of the prominent ( keV) Kα fluorescent iron line. The centroid energy and intrinsic narrowness imply an origin from neutral or mildly ionized iron (Fexx). This is not in principle inconsistent with the line being produced in the same lukewarm medium responsible, in scenario a), for the almost energy-independent scattering of the primary nuclear radiation. However, given also the problems of the scenario a), an appealing alternative explanation is that the line is produced in transmission by the same thick absorbing medium covering the nucleus (Leahy et al. 1989). Matt et al. (2000) compare the observed EW in the whole sample of the Compton-thick Seyfert 2 galaxies observed by BeppoSAX with the values expected in the pure transmission scenario, as calculated by the Matt et al. (1999b). In NGC4945, the observed EW is consistent with the model predictions, suggesting that the iron line is indeed due to transmission by the same absorbing matter covering the nucleus. It is interesting to compare this outcome with that for the Circinus Galaxy, where the observed value (60 eV against the total continuum; Matt et al. 2000) is more than one order of magnitude higher than expected from the column density of the absorbing matter ( cm-2). In Circinus Galaxy a Compton reflection continuum is required to fit the broadband X-ray spectrum (Matt et al. 1999a), most likely providing the dominant contribution to the iron line. The difference between the NGC4945 and Circinus Galaxy case may be due to the geometry of the absorbing matter, allowing in the latter the direct view of the farthest side of the molecular torus encompassing the nucleus. The reader is referred to Matt et al. (2000) for a more extensive discussion of this issue.
6 Conclusions
The main results of this paper can be summarized as follows:
-
a)
the 0.1-5 keV image profile is extended along the plane of the host galaxy. The extension is symmetric within the innermost 5, but at larger radii only the SE MECS profile shows a broader tail. This asymmetry is due to two discrete galactic sources which are present both in the soft X-ray ROSAT/PSPC and in the intermediate X-ray MECS/BeppoSAX fields. The profile perpendicular to the galaxy plane is possibly also extended within 3, although this result is made more uncertain by possible residual inaccuracies in the BeppoSAX attitude reconstruction
-
b)
we measure the best high-energy (i.e.: 10 keV) spectrum so far. Along with the lack of significant extension in the MECS emission above 7 keV, the spectral fitting confirms the idea that the emission above 10 keV is dominated by a nuclear non-thermal continuum, seen through an absorbing screen of a few cm-2. A flux variability with a dynamical range 60% and extrapolated doubling/halving timescales a few s (similar to that discovered by Iwasawa et al. 1993 with Ginga) is not associated with any spectral changes, suggesting that it echoes a, possibly more extreme, variability of the intrinsic nuclear continuum
-
c)
from our estimate of the intrinsic nuclear power, we conclude that the energy output in NGC 4945 is likely to be dominated by the AGN, not by the starburst as suggested by infrared diagnostic (Genzel et al. 1998). NGC 4945 is therefore another indication that absorbed AGN (and, possibly, also the so far elusive type 2 quasars) should be better searched in X-rays rather in the optical/infrared band
-
d)
the prominent iron line is consistent with Kα fluorescence from neutral or mildly ionized iron (Fexx). There is no evidence for blending or intrinsic broadening at a level higher than 200 eV. The bulk of the line (along with the continuum above 7 keV) is produced within about 1, strongly supporting a nuclear origin. The most likely explanation is fluorescence in the same absorbing medium, responsible for the nuclear absorption, provided its covering fraction is lower than one
-
e)
the broadband 0.1–200 keV spectrum can be fitted with several statistically equivalent models. However, the most consistent explanation is in the framework of the two thermal components template, already employed to fit the integrated bulge emission of early type galaxies, where the bulk of the soft X-rays and a sizeable fraction of the intermediate X-rays are believed to be produced by unresolved discrete sources (mainly binaries). Alternatively, the extended emission above 1 keV might be associated with a hot superwind-driven outflow, as already observed in nearby starburst galaxies.
Acknowledgements.
The BeppoSAX satellite is a joint Italian-Dutch program. MG acknowledges an ESA Research Fellowship. WNB gratefully acknowledges the support of NASA LTSA grant NAG5-8107. GM acknowledges financial support from ASI and from MURST (grant cofin98–02–32). The authors acknowledge help from L.Chiappetti for the MECS data analysis, and useful comments from A.Marconi and G.C.Perola. This research has made use of the NASA/IPAC Extragalactic Database, which is operated by the Jet Propulsion Laboratory under contract with NASA, and of data obtained through the High Energy Astrophysics Science Archive Research Center Online Service, provided by the NASA/Goddard Space Flight Center.References
- (1) Boella G., Butler R., Perola G.C., et al., 1997a, A&AS 112, 299
- (2) Boella G., Chiappetti L., Conti G., et al., 1997, A&AS 112, 372
- (3) Brandt W.N., Iwasawa K., Reynolds C.S., 1996, MNRAS 281, L41
- (4) Bregman J.N., Hogg D., Roberts M.S., 1995, ApJ 441, 561
- (5) Brock D., Joy M., Lester D.F., Harvey P.M., Ellis H.B., 1988, ApJ 329, 208
- (6) Cagnoni I., Della Ceca R., Maccacaro T., 1998, ApJ 493, 54
- (7) Cappi M., Bassani L., Comastri A., et al., 1999a, A&A, 344. 857
- (8) Cappi M., Persic M., Bassani L., et al., 1999b, A&A, 350, 777
- (9) Chiappetti L., et al., 1998, “A guided tour to the MECS”, available at http://sax/ifctr/mi/cnr.it/Sax/Mecs/tour.html
- (10) Done C., Madjeski G.M., Smith D.A., 1996, ApJ 463, L63
- (11) Dos Santos P.M., Lepine J.R.D., 1979, Nat 278, 34
- (12) Elvis M., Wilkes B., McDowell J.C., et al., 1994, ApJS 95, 1
- (13) Fabian A.C., Barcons X., Almaini O., Iwasawa K., 1999, MNRAS 297, P11
- (14) Frontera F., Costa E., Dal Fiume D., et al., 1997, A&AS 112, 357
- (15) Genzel R., Lutz D., Sturm E., et al., 1998, ApJ 498, 579
- (16) Grandi P., Guainazzi M., Mineo T., et al., 1997, 325, L17
- (17) Greenhill L.J., Moran J.M., Herrnstein J.R., 1997, ApJ 481, L23
- (18) Guainazzi M., Matteuzzi G., 1997, SDC-TR-014, available at ftp:www.sdc.asi.it/
- (19) Guainazzi M., Matt G., Antonelli L.A., et al., 1999a, MNRAS, 310, 10
- (20) Guainazzi M., Matt G., Molendi S., et al., 1999c, A&A 341, L27
- (21) Guainazzi M., Molendi S., 1999, A&A, 351, L19
- (22) Guainazzi M., Perola G.C., Matt G., et al., 1999b, A&A 346, 407
- (23) Heckman T.M., Armus L., Miley G.K., 1990, ApJS 74, 833
- (24) Heiles C., Cleary M.N., 1979, Astr. J. Phys. Astrophys. Suppl., 47, 1
- (25) Kim D.W., Fabbiano G., Matsumoto H., Koyama K., Trincheri G., 1996, ApJ 468, 175
- (26) Koornneff J., 1993, ApJ, 403, 581
- (27) Irwin J.A., Bregman J.N., 1999, ApJ, in press (astroph/9907153)
- (28) Iwasawa K., 1997, Ph.D thesis
- (29) Iwasawa K., Comastri A., 1998, MNRAS 297, 1219
- (30) Iwasawa K., Fabian A.C., Matt G., 1997, MNRAS 298, 443
- (31) Iwasawa K., Koyama K., Awaki H., et al., 1993, ApJ 409, 155
- (32) Lawrence A., Watson M.G., Pounds K.A., Elvis M., 1985, MNRAS 217, 685
- (33) Leahy D.A., Matsuoka M., Kawai N., Makino F., 1989, MNRAS 236, 603
- (34) Madejski G.M., Zdziarski A.A., Turner T.J., et al., 1995, ApJ 438, 672
- (35) Magdziarz P., Zdziarski A.A., 1995, MNRAS 273, 837
- (36) Marconi A., Maiolino R., Oliva E., et al., 1999, A&A, submitted
- (37) Matsumoto H., Koyama K., Awaki H., et al., 1997, ApJ 482, 133
- (38) Matsushita K., Makishima K., Awaki H., et al. 1994, PASJ 436, L41
- (39) Matt G., Fabian A.C., Guainazzi M., et al., 2000, MNRAS, submitted
- (40) Matt G., Guainazzi M., Frontera F., et al., 1997, A&A, 325, L13
- (41) Matt G., Guainazzi M., Maiolino R., et al., 1999a, A&A 341, L39
- (42) Matt G., Pompilio F., La Franca F., 1999b, NewA 4/3, 191
- (43) Mauersberger R., Henkel C., Whiteoak J.B., Chin Y.-N., Tieftrunk A.R., 1996, A&A 309, 705
- (44) Moorwood A.F.M., van der Werf P.P., Kotilainen J.K., Marconi A., Oliva E., 1996, A&A, 308, L1
- (45) Morrison M., Mc Cammon D., 1983, ApJ 270, 119
- (46) Mulchaey J.S., Koraktar A., Ward M.J., et al., 1994, ApJ 436, 586
- (47) Nakai N., 1989, PASJ 41, 1107
- (48) Nandra K., George I.M., Mushotzky R.F., et al., 1997, ApJ 488, L91
- (49) Oliva E., Origlia L., Maiolino R., Moorwood A.F.M., 1999, A&A, 350, 9
- (50) Parmar A.N., Martin D.D.E., Bavdaz M., et al., 1997, A&AS 122, 309
- (51) Parmar A.N., Oosterbroek T., Orr A., et al., 1999, A&AS 136, 407
- (52) Perola G.C., Matt G., Cappi M., et al., 1999, A&A, submitted
- (53) Piro L., Feroci M., Grandi P., et al., 1998, Nucl. Phys. B (Proc. Suppl.), 69/1-3, 481
- (54) Primini F.A., Forman W., Jones C., 1993, ApJ 410, 615
- (55) Rice W., Lonsdale C.J., Soifer B.T., et al., 1988, ApJS 68, 91
- (56) Siddiqui H., Owens A., Parmar A.N., et al., 1999, A&A, submitted
- (57) Trincheri G., Israel G.L., Chiappetti L., et al., 1999, A&A, in press (astroph/9906162)
- (58) Turner T.J., George I.M., Nandra K., Mushotzky R.F., 1997, ApJ 488, 164
- (59) Véron-Cetty M.P., Véron P., 1989, “A Catalogue of Quasars and Active Galactic Nuclei”, ESO Scientific Report No. 7, 4th edition
- (60) Vignati P., Molendi S., Matt G., et al., 1999, A&A, 349, L57
- (61) Whiteoak J.B., Gardner F.F., 1979, PASA 3, 319
- (62) Zdziarski A.A., Johnston W.N., Done C., Smith D., McNaron-Brown K., 1995, ApJ 438, L63