On the Existence of Differences in Luminosity between Horizontal Branch Stars in Globular Clusters and in the Field
Abstract
The discrepancy between a long distance scale derived from Hipparcos based distances to globular clusters via main sequence fitting to local subdwarfs, and a short distance scale derived from the absolute magnitude of field RR Lyraes via statistical parallaxes and the Baade-Wesselink method could be accounted for whether an intrinsic difference of about 0.1-0.2 mag was found to exist between horizontal branch (HB) stars populating the sparse general field and the dense globular clusters. In this paper we discuss the possible existence of such a systematic difference comparing the period-shifts observed for field and cluster RR Lyraes. Various approaches based on different parameters and data-sets for both cluster and field variables were used in order to establish the size of such a hypothetical difference, if any. We find that on the whole very small not significant differences exist between the period-metallicity distributions of field and cluster RR Lyraes, thus confirming with a more quantitative approach, the qualitative conclusions by Catelan (1998). This observational evidence translates into a very small difference between the horizontal branch luminosity of field and cluster stars, unless RR Lyraes in Globular Clusters are about 0.06 M⊙ more massive than field RR Lyrae at same metallicity, which is to be proven.
keywords:
stars : distances –stars: horizontal branch – stars: variables: other – globular clusters: general1 Introduction
The well-known dichotomy existing between short and long distance scale as derived from old, Population II stars is still an unsolved problem, not yet settled even after the improvement, in distance determinations, due to the release of the Hipparcos Parallax Catalogue. In fact, while distances to globular clusters by main sequence fitting to local subdwarfs with parallaxes measured by Hipparcos, favour the long distance scale (see Gratton et al. 1997, Paper I, and Carretta et al. 2000, Paper II, for extensive updates and discussions on this topic), the statistical parallaxes of field RR Lyraes (one of the most commonly used galactic standard candle), based on Hipparcos proper motions (Fernley et al. 1998; Popowski and Gould, 1998, Tsujimoto et al., 1997) still lead to the short distance scale.
Following an alternative approach, Gratton (1998) used Hipparcos parallaxes for a sample of field metal-poor HB stars in order to directly calibrate these standard candles. Given the paucity of RR Lyrae variables within reasonable distances from the Sun, Hipparcos was able to measure useful parallaxes for only 3 variables, RR Lyrae itself and two additional stars. Uncertainties in the parallax determinations of the latter are however rather large. In order to increase the statistical significance of the sample, Gratton (1998) selected also red and blue HB field stars from various sources. His final sample consists of 20 stars with and 2 stars slightly fainter than this limit. For a consistent comparison of the results, metal abundances for the stars in the sample were put on the same metallicity scale used in Paper I and II. The mean weighted absolute magnitude found by Gratton (1998) with this procedure is (at average metallicity [Fe/H]=), and brightens to (at average [Fe/H]=) when HD17072, a suspected first ascent giant branch star (see however Carney, Lee & Habgood, 1998) is discarded from the sample. This latter value has been recently revised to (see Koen & Laney 1998) in order to account for the intrinsic scatter in the HB magnitudes when correcting for the Lutz-Kelker effect. The error bar given by this analysis is still large enough that a final choice between the short and long distance scale can not be made.
Gratton (1998), however pointed out how different distance determination methods seem to give consistent results as far as only HB stars or only globular cluster HB stars are considered. This argument led him to suggest that a real difference in luminosity of mag, might actually exist between HB stars in globular cluster and in the general field, the cluster stars being brighter.
The hypothesis of an intrinsic difference between field and cluster RR Lyraes was immediately challenged by Catelan (1998; C98) who used the period-temperature distribution for both field and cluster variables at about fixed metallicity (in a metal-poor and a metal-rich regime) to show that GC and field RR Lyrae are essentially indistinguishable in the plane, thus concluding that there is no significant difference in luminosity between them.
In the present paper we try to have a deeper insight into this problem. Both the original targets in C98 analysis as well as a new, more homogeneous sample of cluster and field variables are used in order to achieve a quantitative estimate of the possible differences in luminosity between HB field and cluster stars, and to complement and refine the fully qualitative approach used by C98.
2 A reanalysis of C98 data
As a starting point, we have re-analyzed the original set of data considered by C98, kindly provided by the author. C98 dataset consists of 35 field RR Lyraes and 49 variables in 5 globular clusters (namely NGC 362, M5, M68, M15 and M92). Variables were selected by C98 in order to be of ab-type, and with light curves not affected by Blazhko effect. Metallicities were from Layden et al. (1996), and are therefore on Zinn & West (1984) metallicity scale, which is also adopted by C98 for the globular cluster variables.
According to C98 we used the empirical relation of Carney, Storm & Jones (1992a; CSJ) which gives the so-called “equilibrium temperature” Teq of a RR Lyrae variable as a function of the blue amplitude , metal abundance [Fe/H] and pulsational period P. This relation provides a very tight logP–logTeq between cluster and field variables (see figure 2 in C98), and hence seems to be the best confirmation of a similarity in their luminosities.
Following an approach similar to that of C98, we then derived Teq values for all stars in his sample. However, in order to quantify the supposed identity between field and cluster variables at fixed metal abundance we used the M15 variables as a reference. A quadratic relationship was fit to the M15 RR Lyraes in the logP–logTeq plane (see Figure 1), and we derived for each variable the expected period if the star was to follow the M15 logP–logTeq relation.
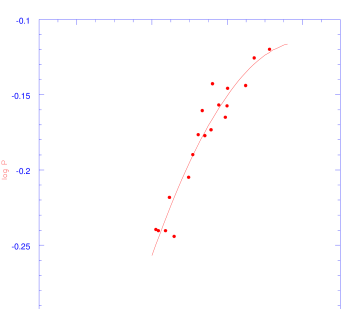
Differences between the actually observed (as quoted by C98) and the expected period were then computed for each star : Ps dlogPoss-exp.
Figure 2 shows the run of Ps [Fe/H] for all stars in the original C98 sample. For the cluster variables we show the average value at the cluster metallicity.
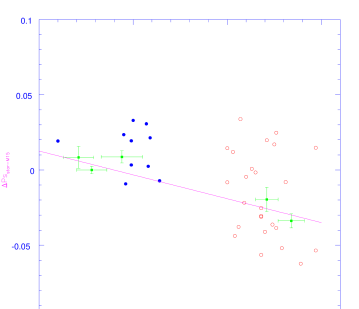
A linear best-fit was drawn through the cluster data in order to evaluate how much field stars differ from the cluster variables. Admittedly, there is some hint that fitting by a second order polynomial could be a better representation of the data, however the lack of clusters around [Fe/H] in C98 original sample prevents further assessment of this issue. We then computed the distance of each field star from the fit representing the period-shift [Fe/H] relation defined by the cluster variables.
The unweighted average derived from all 35 (both metal-poor and metal-rich) field stars is :
| (1) | |||||
with . This relation is a more quantitative measure of the results achieved by C98, and simply tells us that the field variables have at least the same, or possibly even longer period shifts (within rather large internal errors) with respect to cluster variables of comparable metal abundance. This could be interpreted as a (weak) evidence for the field RR Lyraes to be than their cluster counterparts. A result a little unpalatable, since the discrepancy between distance scales could be accounted for only whether field RR Lyraes were fainter than their cluster counterparts. We should recall, however, that what the period shift between the two distributions (at fixed temperature and metallicity) actually measures is the the convolution of stellar mass luminosity effects, as in the classical equation of pulsation by van Albada & Baker (1971) (e.g. eq. 10 in CSJ or the more recent one by Bono et al. 1997). This point will be further discussed below.
2.1 The effect of changing dataset
Having settled the size of the effect we can expect, and of the related errors, we then explored how the observational parameters involved in the analysis could affect the derived result.
We thus repeated the analysis adopting different sets of parameters, metallicity scale (from Clementini et al. 1995, C95 or Blanco 1992 for field variables; and from Carretta & Gratton 1997, CG97, or Zinn & West 1984 for clusters) and light curve parameters (as the updated blue amplitudes for field stars by Nikolov et al. 1984).
These tests allowed us to ascertain that:
-
1.
The effect that we want to highlight is (or could be) very subtle: in the best case we want to detect a difference of about 0.1-0.15 mag in the HB luminosities of cluster and field stars.
-
2.
The internal errors alone are very likely about the same size of the effect we are looking for. Even parameters usually thought to be very reliable and simple to measure, as amplitudes and periods, should be carefully checked.
-
3.
There is a strong suggestion that homogeneous data sets could greatly help to reduce systematic errors which may smear out real differences.
2.2 Is the pulsational approach the proper way to detect possible luminosity differences between field and cluster stars ?
There may be some procedural concerns about the use of the pulsational approach to detect a systematic difference in luminosity between field and cluster HB stars.
A first concern was pointed out by Catelan (1998), who suggested that an empirical calibration of Teq omitting the period term would be a better approach, with respect to the original CSJ calibration. In fact, there is a risk of being catched in a circular line of thought, entering with pulsational periods in order to derive temperatures and then using distributions of field and cluster stars in the TlogP plane to highlight a difference (shift) in the periods, to be interpreted as a luminosity difference. This can be seen also by a simple experiment suggested by the referee. If we decrease by 0.2 mag the luminosities of variables in Figure 1 in order to simulate a fainter sample, then the combination of the van Albada & Baker pulsation equation and of eq. (16) in CSJ acts to shift these fainter variables toward shorter periods and higher temperatures. The net effect is to transport the overall distribution in the Teq -logP plane along the relationship (and its extension to higher temperatures), so that no significant period shift can be detected between the original, observed sample of M 15 variables and the simulated faint one.
Unfortunately, the relationship for Teq derived by C98 with no period term is so scattered (see Figure 3 in C98), that no useful information can be derived, apart from a generic similarity of the field and cluster star distributions in the TlogP plane. Moreover, a reference relationship logP log Teq seems not very easy to establish for any of the clusters in C98 list, judging from his Figure 3.
A point of further concern is that both in the original CSJ and in C98 analysis, the empirical calibrations of Teq are derived using only the field stars and then applied also to the cluster variables. The underlying assumption is that RR Lyrae stars share the same physical parameters, with no dependence on the environment in which they were born : the dense clusters or the much looser field. We believe that this is a dangerous procedure which may mimic spurious and/or mask real differences in the absolute magnitude of field and cluster variables.
3 An independent evaluation of C98 results
In order to quantitatively assess the analysis by C98 we need a more homogeneous sample of stars and a temperature calibration which can be applied independently to cluster and field RR Lyraes. We have thus selected a sample of field stars smaller in numerical size with respect to C98, but which can provide a tighter distribution, thanks to the higher degree of accuracy of their photometric data. Using new model atmospheres by Kurucz (1993) and semi-empirical colour-temperature calibrations, new temperatures were derived for all field and cluster variables, irrespective of their belonging to one or the other enviroment. Selected samples and their analysis are discussed in the following section.
3.1 Definition of a new sample, observables and derived temperatures
Our new sample of field stars consists of 16 ab-type RR Lyraes used by CSJ in Baade-Wesselink analyses (we disregarded RS Boo since it is presently known to be affected by Blazhko). The new targets satisfy all requisites listed in section 3.1 of C98 : being the variables usually used in the Baade-Wesselink approach to distances, they all have a very good coverage at each phase of light curve, periods and amplitudes are measured with much greater accuracy than for variables in generic surveys as those of Layden et al. (1996) and all have new homogeneous metallicity estimates from the new metallicity scale for the RR Lyraes variables of C95111The metal abundance scale in C95 is fully consistent with the metallicity scale derived by CG97 for globular cluster giants (see discussion in CG97).
As in CSJ, we have not eliminated the supposedly evolved stars DX Del and SS Leo, since we are comparing sets of stars (field and clusters’) which both are likely to include some evolved variables.
As for the cluster variables, we considered 19 RRab in M15 (the same used by C98), 41 RRab variables in M 3 with new CCD photometry from Carretta et al. (1998), 22 RRab in M 5 (Ripepi et al. 1998, private communication), 8 type-ab RR Lyrae with clean light curves in M 68 (Walker 1994), 6 RRab in M 92 (Carney et al. 1992b) and 18 RRab in NGC 6362 (Walker 1999, private communication). All observational datasets but those for M15 are from recent CCD photometry. However, we are confident that even if based on photographic observations, derived quantities for M15 variables well compare with the CCD data for the other clusters. In fact, none of our conclusions would be altered whether any other of the clusters in our sample was taken as a reference, even if we would have used NGC 6362, whose stars span all the relevant range in temperature. In particular, the period shift relations (see next section) are not sensitive to the choice of the cluster used to define the fiducial locus for determining the period shifts.
We used the magnitude-average color index as temperature indicator. As widely discussed in CSJ, there is no particular reason to believe the BV to be the best colour index to reproduce the RR Lyrae’s equilibrium temperature. However, B,V photometry is presently available for a larger number of cluster variables, and, on the other hand, since this is a analysis between cluster and field stars, the crucial point is to use the same colour (no matter which), for both kind of variables, in order to achieve the maximum degree of homogeneity.
colours (where and are intensity-averaged magnitudes), are available for all cluster variables, as well as for the field sample adopted by CSJ (column 6 of their Table 4).
Using the latter we derived a relation to transform the intensity-averaged colours into magnitude-averaged colours for all variables in our sample.
Figure 3 displays this colour conversion derived from the field Baade-Wesselink stars of CSJ (column 6 of their Table 4). The best-fitting relation is :
| (2) |
= 0.006, correlation coefficient , based on 17 stars.
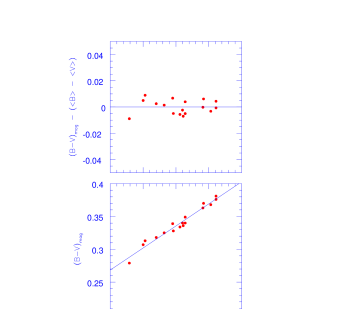
Although the two indices are not in a one-to-one correspondence, the above transformation allows us to obtain a set of colours mutually consistent for both the field and the cluster stars in our samples.
Temperatures were obtained for all stars using this colour and the semi-empirical procedure discussed at length in Gratton, Carretta & Castelli (1996). Briefly, the latest model atmospheres by Kurucz (1993) were tied (i.e. “corrected with”) to an empirical colour-temperature calibration for pop. I stars based on the Infrared Flux Method (see details in Gratton, Carretta & Castelli). The corrected models then were used to read from the observed de-reddened colours the temperatures at the gravity and metal abundance appropriate for each star.
A constant value of was adopted for all variables. This is the value generally adopted for RR Lyraes at minimum light and presently there is some indication that a larger value by 0.10-0.15 dex might be more appropriate for RR Lyraes at minimum light. However the results of our differential analysis are not affected by the adopted value of provided that the same value is adopted for both field and cluster variables222Strictly speaking, gravity should be slighthly different in RR Lyraes of different luminosities and masses. However, changing gravity by 0.1 dex (corresponding to a difference of 25% in the mass and/or 0.25 mag in magnitude) only changes Teff’s by 10 K. The effect on the period shifts is only of 0.002 dex and can be neglected when compared with uncertainties e.g. on interstellar reddening. Metal abundances for the field stars were from C95. Reddening for M15 (, M3 (, M5 (, M92 ( and M 68 () are fully consistent with the new reddening scale of Paper I (Gratton et al. 1997) and Paper II (Carretta et al. 2000). In turn, metal abundances for the cluster variables were slightly different from the values of the original CG97 scale. Taking into account the adopted reddenings, the temperatures for the cluster RR Lyraes were thus obtained using [Fe/H] for M 3, [Fe/H] for M15, [Fe/H] for M 68, [Fe/H] for M 5 and [Fe/H] for M 92. For NGC 6362 (not included in the sample of Paper I and II), we adopt [Fe/H]=0.96 dex from Carretta & Gratton (1997) and E(BV)=0.08 mag from Brocato et al. (1999).
3.2 Analysis
The only assumption made so far is that for each variable, either in the field or in a cluster, a temperature can be defined using the latest Kurucz model atmospheres (empirically corrected) and that the temperatures so derived represent the ones the variables would have if they were static stars. Bearing in mind that we aim at a differential comparison, we may ask how much this assumption can be trusted.
As an estimate we can compare our newly derived temperatures with the equilibrium temperatures for field stars analyzed with the Baade-Wesselink method, listed in column 9 of Table 4 in CSJ.
This comparison is shown in Figure 4. Our temperatures are on average larger than the equilibrium temperatures of CSJ, the mean difference being K ( K, 17 stars), with no trend with temperature (or metal-abundance).
Taken at face value, this indicates that equilibrium temperatures for pulsating pop. II stars as the RR Lyraes, computed from infrared colours (as those usually employed in Baade-Wesselink analyses) and the old Kurucz (1979) model atmospheres, not corrected to empirical data, are in good agreement with effective temperature derived from intensity-averaged colours using the new Kurucz (1993) and the semi-empirical procedure defined above. However, we caution that some of the original Baade-Wesselink analyses, from which values in table 4 of CSJ were taken, adopted a semi-empirical calibration.
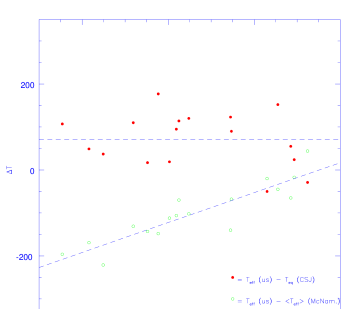
As a comparison, we also computed differences for the same set of stars with the mean effective temperatures derived by McNamara (1997) using optical and near infrared colours and the temperature calibrations given by the new Kurucz models. In Figure 4 it is easy to see that in this case, although the average difference is not much larger than in the previous comparison (T K (r.m.s. = 67 K, 17 stars), a clear trend with temperature arises, likely due to the absence of semi-empirical corrections to the models employed by McNamara (1997).
However, we can be confident that our temperature scale i) is fully homogeneous for both field and cluster variables and ii) likely due to various, compensating effects, the derived temperature are not much far away from the so-called equilibrium temperature of a pulsating star, as discussed in CSJ.
Note that in our analysis we avoid introducing any spurious results due to the assumption that field and cluster variables have similar histories, as implicit in the CSJ and C98 analysis.
As before we used M15 as a reference and derived a linear relationship as the best fit in the the logP–logTeff plane (a quadratic relation is no longer justified). Entering in this relation with the derived effective temperature for each stars, again we computed the difference between the actually observed and the expected period of each star, Ps dlogPoss-exp. These differences are displayed in Figure 5 as a function of the metal abundances, taking for each cluster the unweighted mean of all cluster variables. In order to evaluate the relevance of systematic errors in the reddening scale (which affects the derived temperatures colours) we repeated our analysis changing by the adopted reddening values for the cluster stars. The corresponding uncertainty in the derived Ps dlogPoss-exp would be about 0.02.
As for systematic errors in the metallicity scale, the overall uncertainty cannot be reduced below 0.1 dex, as discussed by Carretta et al. (2000). We therefore adopted this figure as the possible systematic errors due to the adoption of CG97 scale.
A linear best fit regression through the data of the 16 B-W field stars in Figure 5 gives :
| (3) |
which is the bisector of direct and inverse relations, 16 stars, correlation coefficient of . Nothing new in this relation, which slope is very similar to others obtained using field variables (e.g. Fernley 1993: -0.073).
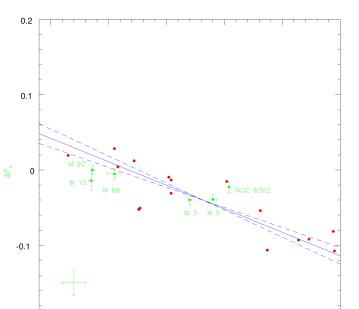
On average, the cluster RR Lyraes are not too much far away from the mean locus defined by field variables in Figure 5. The impression by eye is of a hint for the RR Lyraes in clusters having slightly shorter periods than field variables of similar metallicity.
We then derived the same fit also for the average values defined by the cluster variables. Taking again the bisecant of relations obtained exchanging dependent and independent variables, we derived from the 6 clusters considered here:
| (4) |
with a correlation coefficient .
This slope is much less than the value derived by the latest study of Sandage (1993). However, since we are mainly interested to obtain a figure for the actual differences between the distribution of field and cluster variables at fixed metallicity, we have computed the offset from each field RR Lyrae with respect to the fit defined by the cluster variables.
The unweighted average derived from all the 16 field stars is now:
| (5) | |||||
On the other side, when considering only field stars with [Fe/H] values in the metallicity range spanned by globular clusters (i.e. excluding from the average those more metal-rich than [Fe/H]) the above figure become , based on 10 stars.
Both these results and the attached error bars simply tell us that any difference between field and cluster variables has to be considered at best not very significant. In the following, we will use the average from Eq. (5), but the discussion would not change even using the other value.
4 Discussion
If we now combine the result obtained in the previous section with the pulsational equation of (e.g.) Van Albada & Baker (1971) we can simply write:
| (6) |
where all differential quantities (periods, luminosities and masses) correspond to mean field cluster and are read at fixed temperature (and metallicity). Since, according to the pulsation equation the period depends on both luminosity and mass to understand the physical meaning of our results we can make two different assumptions concerning the mass of pulsating variables on the horizontal branch.
First we suppose that cluster and field variables were formed with identical masses and share similar histories and properties independently of the enviroment, and that the present mass is, for example, about 0.6 M⊙, as the classical value for globular cluster HB stars.
Then from equation (6) one derives that , and, neglecting at first order the bolometric corrections, log(fi-cl) . This means that field variables are approximately as luminous as cluster variables of same metallicity. This value is only a twenty percent in magnitude of the effect ( mag) required to explain the discrepancy between different distance indicators.
Given the above result, if we want that field variables are about 0.1 mag than cluster RR Lyraes, we must release the assumption of equal masses. If so, simple computations allow to obtain the values listed in Table 1.
| logM | Mfi | ||
|---|---|---|---|
| (fi-cl) | (fi-cl) | (fi-cl) | (if M) |
| +0.0 | +0.00 | 0.614 M⊙ | |
| +0.1 | 0.04 | 0.548 M⊙ | |
| +0.2 | 0.08 | 0.489 M⊙ |
It is then clear that if the discrepancy in distances calibrated using cluster and field variables is due to an intrinsic difference in luminosity of mag, between field and cluster HB stars, we should also postulate that HB stars in the more sparse field are about 0.05 M⊙ less massive than their cluster counterparts of similar temperature.
4.1 Comparison with Zero Age Horizontal Branch models
How this prediction derived from purely pulsational properties compares with evolutionary models of Zero Age Horizontal Branch (ZAHB) stars ? Is there a basic parameter (e.g. core mass or abundance of helium Y) which variation within plausible ranges could result into a difference of about 0.05 M⊙ ?
The theory of stellar evolution has by long time secured the notion that the enhancement of Y in a ZAHB model results in a star populating the HB at bluer colours (i.e. warmer temperatures) and at brighter luminosities than a model with similar structural parameters but lower Y abundance.
Actually, we are not interested in a HB star has gained a larger Y abundance, but mainly in the consequences that such enhancement could have. However, stars obviously arrive on the HB following a well defined evolutionary path, and it is known that a good candidate to give larger Y abundance is for instance the presence of deep extra-mixing whose onset is likely related to some non-standard mechanism (see e.g. Cavallo et al. 1998 and quoted references). In this scenario, both bluer colours and brighter luminosities are due to the higher level attained by the stars to the red giant tip, with consequent enhanced mass loss and helium core mass. The net result would thus be a star which locates on the blue part of the horizontal branch. In order to find such high-Y ”cluster” star at the same colour of a field RR Lyrae, i.e. inside the instability strip, the star should also have been born with a higher mass, so to spend a part of his helium-core burning as a pulsating variable.
To have a more quantitative insight into this scenario, we need a set of ZAHB models which explore systematically the variations of each structural parameter (mass, core mass, Y abundance) while keeping all the others fixed. Unfortunately, most of published studies assume a typical set of parameters and then follow the global of the stars, making it difficult, or almost impossible, to discriminate among different involved parameters, and the new models computed by Sweigart (1997) where enhancement of Y is explicitly treated are unfortunately still unpublished. The most complete set of classical ZAHB models available so far are those Sweigart & Gross (1976: SG76). In this respect, SG76 models are the tool we need; all subsequent improvements in the input physics are of minor relevance, in the present context, since we are mainly interested to study differential effects.
Results of interpolations in the SG76 models are listed in Table 2, where we report the variations obtained in the total ZAHB mass varying the core mass and the Y abundance, at fixed metallicity and temperature. Figures are derived holding also a constant difference of , (i.e. .
| Y | M/M⊙ | |
|---|---|---|
| (fi-cl) | (fi-cl) | (fi-cl) |
| 0.000 | 0.020 | 0.004 |
| 0.006 | 0.012 | 0.011 |
| 0.014 | 0.000 | 0.019 |
Values in Table 2 read as the changes in Mc and Y of a theoretical ZAHB cluster star in order to be i) brighter (by mag) and, at same time, ii) more massive than a theoretical field star.
It is easy to see that
-
1.
if Y is enhanced at fixed core mass, the resulting enhancement in mass is negligible, if compared to the required 0.06 M⊙. Moreover, the solution would be a little unpalatable, since it is well known that a higher Y implies higher luminosities of the star at the giant tip, but also an increase of the luminosities of the RR Lyraes, and hence in their periods (Sweigart 1997), at odd with present results. On the other side, a higher Y, if primordial, would result in lower luminosities at the red giant tip and in a smaller core mass (Sweigart, Greggio & Renzini 1990);
-
2.
if both Y and Mc are increased, a larger increase in the mass appears
-
3.
finally, it seems that better results are obtained simply with an increased core mass. In fact, if we assume that cluster variables start their HB evolution with core masses 0.014 M⊙ larger than field stars (e.g. due to enhanced internal rotation, maybe driven by the denser environment of their formation and evolution) then it is possible for such stars to reach a difference of about 0.02 M⊙. However, even in this case the mass enhancement is a factor 3 smaller than derived from the pulsational analysis.
4.2 Summary and conclusions
In this paper we explore the suggestion by Gratton (1998) that the existence of an intrinsic difference of about 0.1 mag between the luminosity of field and cluster HB stars could be responsible of the disagreement found between distance calibrations ultimately based on Hipparcos parallaxes.
Following an approach very similar in principle to that presented by Catelan (1998), we used photometric data of RR Lyrae variables in the field and in globular clusters to study their pulsational properties. Quantitative estimates of the amount of possible differences between the two kind of variables are given.
The differential comparison of the resultant period distributions leads to the following conclusions:
-
1.
repeated trials using the original samples of variables adopted by C98 but different metallicity scales, or sets of light curve parameters, highlight that inhomogeneities in the data sets or intrinsic (even small) internal errors could blur a luminosity difference between field and cluster stars as derived from differences in their period distributions at fixed metallicity;
-
2.
when a homogeneous metallicity scale for both field and cluster RR Lyraes is used, and consistent temperatures from optical colours and the new Kurucz’s model atmospheres (tied to empirical calibrations) are derived, more quantitative and stringent estimates are possible;
-
3.
we confirm on the whole C98 findings: at fixed temperature and metal abundance the run of periods with [Fe/H] is essentially the same for both field and cluster RR Lyrae stars, even if there could be a small hint for cluster RR Lyrae having slightly shorter periods than field variables of the same metallicity;
-
4.
our best estimate from 16 field RR Lyraes (with accurate parameters from Baade-Wesselink analyses) and 114 cluster RR Lyraes with recent and accurate photometry is that on average field stars have a difference of in logP with respect to cluster variables. The statistical significance of this effect is then very scarce;
-
5.
when combined with the classical pulsational equation by (e.g.) van Albada & Baker (1971), this difference formally implies that at fixed temperature and metallicity either the mass or the luminosity (or both) of field and cluster variables must be slightly different, however assuming that field and cluster RR Lyraes were born with same mass would result in a difference of only about two hundreth of a magnitude. On the other hand, in order to achieve a 0.1 mag difference in HB luminosity as suggested by Gratton (1998), the field variables should be about less massive than their cluster counterparts at same temperature and metal abundance.
Unfortunately, the determination of the mass of a star is still one of the most difficult problems in the observational astrophysics. In the case of pop. II pulsating stars, one could exploit the pulsation theory in order to derive mass estimates from periods; however, the exact value of the masses (and their run as a function of [Fe/H]) is still an unsettled and controversial issue.
Results from a simple explorations of SG76 ZAHB grids, discussed in Section 4.1, show that a larger core mass in the HB phase could give the larger masses required to explain, at least in part, the discrepancy in HB luminosity tentatively suggested to exist between field and cluster stars. From a theoretical point of view, a good candidate to give larger masses for stars born and evolved in the cluster dense environment is an enhanced Y abundance, possibly due to extra-mixing phenomena likely related to non-standard core rotation (see Cavallo et al. 1998 and references therein). Since evidences of deep mixing are only found in cluster giants and not in field stars (Gratton et al. 2000), the star birth-place and the density of the environment hosting its evolutionary life, in particular, could be responsible for the differences found between field and cluster objetcs.
However, according to Sweigart (1997), non-canonical helium-mixed models would result into an increase of the luminosity of the RR Lyrae variables, and hence in their pulsational periods. This is clearly at odd with C98 and our results, which find no or very little differences between the period distributions of field and cluster variables at fixed temperature.
ACKNOWLEDGEMENTS
We warmly thank Marcio Catelan for kindly providing his original data and a preprint of his paper in advance of publication. We also thank Alistair Walker for sending us mean colour and parameters for variables in NGC 6362 in machine ready form in advance of publication. It is a pleasure to thank Bernardo Salasnich and Leo Girardi for helpful discussions, as well the referee for her/his useful comments.
References
- [1] Blanco, V.M. 1992, AJ, 104, 734
- [2] Bono, G., Caputo, F., Castellani, V., Marconi, M. 1997, A&AS, 121, 327
- [3] Brocato, E., Castellani, V., Raimondo, G., Walker, A.R. 1999, ApJ, 527, 230
- [4] Carney, B. W., Lee, J.W., & Habgood, M.J., 1998, A.J. 116, 424
- [5] Carney, B. W., Storm, J. & Jones, R.V. 1992a, ApJ, 386, 663 (CSJ)
- [6] Carney, B. W., Storm, J., Trammell, S.R. & Jones, R.V. 1992b, PASP, 104, 44
- [7] Carretta, E., & Gratton, R. G. 1997, A&AS, 121, 95 (CG97)
- [8] Carretta, E., Cacciari, C., Ferraro, F.R., Fusi Pecci, F., Tessicini, G. 1998b, MNRAS, 298, 1005
- [9] Carretta, E., Gratton, R.G., Clementini, G. & Fusi Pecci, F. 2000, ApJ, in press, (Paper II)
- [10] Catelan, M. 1998, ApJ, 495, L81 (C98)
- [11] Cavallo, R.M., Sweigart, A.V. & Bell, R.A. 1998, ApJ, 492, 575
- [12] Clementini, G., Carretta, E., Gratton, R. G., Merighi, R., Mould, J. R., & McCarthy, J. K. 1995, AJ, 110, 2319 (C95)
- [13] Fernley, J. 1993, A&A, 268, 591
- [14] Fernley, J., Barnes, T.G., Skillen, I., Hawley, S.L., Hanley, C.J., Evans, D.W,. Solano, E., & Garrido, R., 1998, A&A 330, 515
- [15] Gratton, R.G. 1998, MNRAS, 296, 739
- [16] Gratton, R. G., Carretta, E., & Castelli, F. 1996, A&A, 314, 191
- [17] Gratton, R. G., Fusi Pecci, F., Carretta, E., Clementini, G., Corsi, C. E., Lattanzi, M. 1997, ApJ, 491, 749 (Paper I)
- [18] Gratton, R. G., Sneden, C., Carretta, E., Bragaglia, A. 2000, A&A, in press
- [19] Koen, C., Laney, D. 1998, MNRAS, 301, 582
- [20] Kurucz, R. L. 1993, CD-ROM 13 and CD-ROM 18
- [21] Kurucz, R. L. 1979, ApJS, 40, 1
- [22] Layden, A.C., Hanson, R.B., Hawley, S.L., Klemola, A.R. & Hanley, C.J. 1996, AJ, 112, 2110
- [23] McNamara, D.H. 1997, PASP, 109, 857
- [24] Nikolov, N., Buckhantsova, N., Frolov M. 1984, “The mean light and colour (B-V and U-B) curves of 210 field RR Lyrae type stars”, Astronomical Council of the USSR Academy of Sciences, Sofia
- [25] Popowski, P. & Gould, A., 1998, ApJ, 506, 259
- [26] Sandage, A. R., 1993, AJ, 106, 703
- [27] Sweigart, A.V. 1997, ApJ, 474, L23
- [28] Sweigart, A.V., Greggio, L., Renzini, A. 1990, ApJ, 364, 527
- [29] Sweigart, A.V. & Gross, P.G. 1976, ApJS, 32, 367 (SG76)
- [30] Tsujimoto, T., Miyamoto, M., & Yoshii, Y. 1998, ApJ, 492, L79
- [31] Van Albada, T.S., Baker, N. 1971, Apj, 169, 311
- [32] Walker, A.R. 1994, AJ, 108, 555
- [33] Zinn, R., & West, M. J. 1984, ApJS, 55, 45