Early spectroscopic observations of Nova (V1494) Aquilae 1999 No.2 ††thanks: Based on the data obtained at the David Dunlap Observatory, University of Toronto
Abstract
Low- and medium resolution spectra of the fast nova, Nova (V1494) Aql 1999 No.2 obtained approximately 6, 7, 19 and 28 days after the maximum brightness are presented and discussed. The spectrum covering the whole optical range at day 6 shows the principal plus diffuse-enhanced spectrum. The presence of strong Fe II multiplets with P-Cyg profiles suggest that V1494 Aql belongs to the “Fe II” class defined by Williams (1992). The medium-resolution profiles () of the H and H lines shows well-defined sharp absorption features with the same radial velocities, while the H split into two distinct emission peaks in the last two spectra (=19 and 28 days). The observed behaviour suggests an expanding equatorial ring with possible small-scale clumpiness in the nova shell. The visual lightcurve is used to deduce MV by the maximum magnitude versus rate of decline relationship. The resulting parameters are: days, =16 days, M mag. Adopting this value, a distance d=3.60.3 kpc is determined.
Key Words.:
stars: novae – stars: individual: V1494 Aql1 Introduction
Nova Aql 1999 No. 2 (=V1494 Aql) was discovered visually by A. Pereira on Dec. 1.875 UT, 1999 (Pereira et al. 1999) at magnitude mvis=6.0. The spectroscopic confirmation was given by subsequent low-resolution observations revealing hydrogen Balmer series with P-Cyg profiles, Mg II 448.1 nm (or He I 447.1 nm) and O I 777.4 nm lines, all with P-Cyg profiles. The very early spectra showed the H absorption component to be blueshifted by about 1020 km s-1 in respect to the emission peak (Fujii et al. 1999). In contrast to this latter measurement, Moro et al. (1999) reported the absorption component of the H P-Cyg profile at a blueshift of 1850 km s-1. Additionally, Fe II multiplets at 492, 502 and 517 nm were observed in emission with P-Cyg profile. Further low-resolution spectroscopy was reported by W. Liller (Liller et al. 1999), who took a CCD spectrogram with an objective prism, that showed H in emission at a level of 31 percent above the local continuum.
Early photometric observations consist of mainly visual estimates carried out by amateur astronomers published partly in a number of IAU Circulars and partly in observing reports collected by the VSNET group (http://www.kusastro.kyoto-u.ac.jp/vsnet). Thanks to the fast access to the newly obtained magnitudes, the realtime brightness evolution could be followed. The star reached a maximum brightness of 4.0v shortly after the discovery, which was followed by a rapid decline (see below). Few photoelectric data were published which gave a similar picture to that based on visual estimates. V1494 Aql was also detected at 0.85 and 0.45 mm using SCUBA on the JCMT (Pontefract et al. 1999)
V1494 Aql is the brightest nova in the northern hemisphere after Nova (V1500) Cygni 1975 – Nova (V1974) Cygni 1992 was fainter in maximum by about 0.2 mag, Warner 1995 –, therefore, it provides a good opportunity to carry out thorough studies of a nova explosion by various instruments. Unfortunately, its celestial position disables continuous follow-up observations in early 2000. Therefore, the spectroscopic evolution, especially the formation of the nebular spectrum is difficult to monitor. The main aim of this paper is to present spectra of the nova taken about a week, 19 and 28 days after maximum and to discuss the meaning of the observed spectra. In addition, we also estimate the absolute magnitude and the distance of the nova given by the characteristic light curve parameters ( and ).
2 The spectroscopic observations
The spectroscopic observations were carried out with the Cassegrain-spectrograph attached to the 1.88-m telescope of the David Dunlap Observatory (Richmond Hill, Canada). The spectra were obtained on four nights in December, 1999. The detector was a Thomson 1024 x 1024 CCD chip (with a 6 e- readout noise). A low resolution broad band spectrum was taken on the first night of observations, while we took only medium resolution spectra to study the line profiles in detail on the following three nights. The gratings, observed spectral regions and the resolution at the central wavelength are summarized in Table 1.
| Date (UT) | grating | range (Å) | |
|---|---|---|---|
| (l/mm) | |||
| 1999 Dec. 8.95 | 100 | 3750–7440 | 1400 |
| 1999 Dec. 8.97 | 600 | 3900–4500 | 7000 |
| 1999 Dec. 9.97 | 1800 | 6480–6680 | 11000 |
| 1999 Dec. 22.00 | 1800 | 6480–6680 | 11000 |
| 1999 Dec. 30.96 | 1800 | 6480–6680 | 11000 |
The spectra were reduced with standard IRAF tasks, including bias removal, flat-fielding, aperture extraction (with the task doslit) and wavelength calibration. For the latter, two FeAr spectral lamp exposures were used, which were obtained immediately before and after every stellar exposures. The integration times varied between 10 seconds and 10 minutes, depending on the actual resolving power and wavelength range.
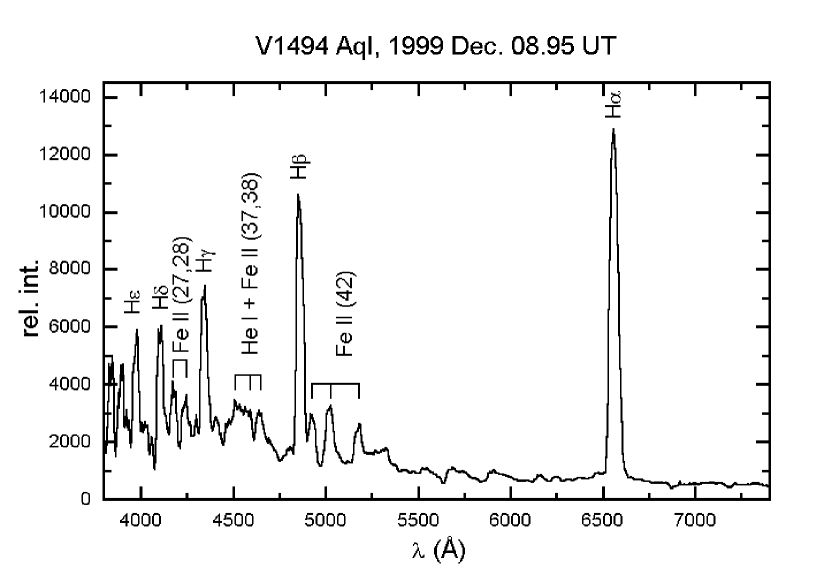
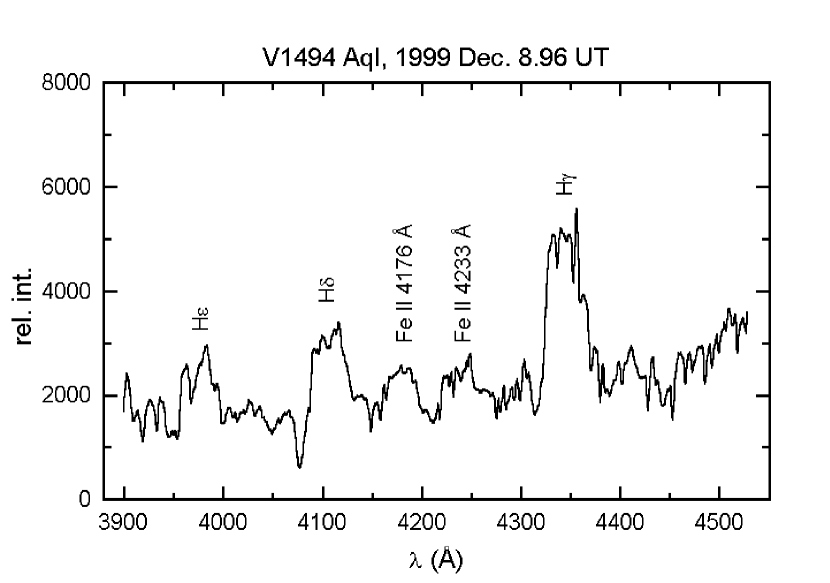
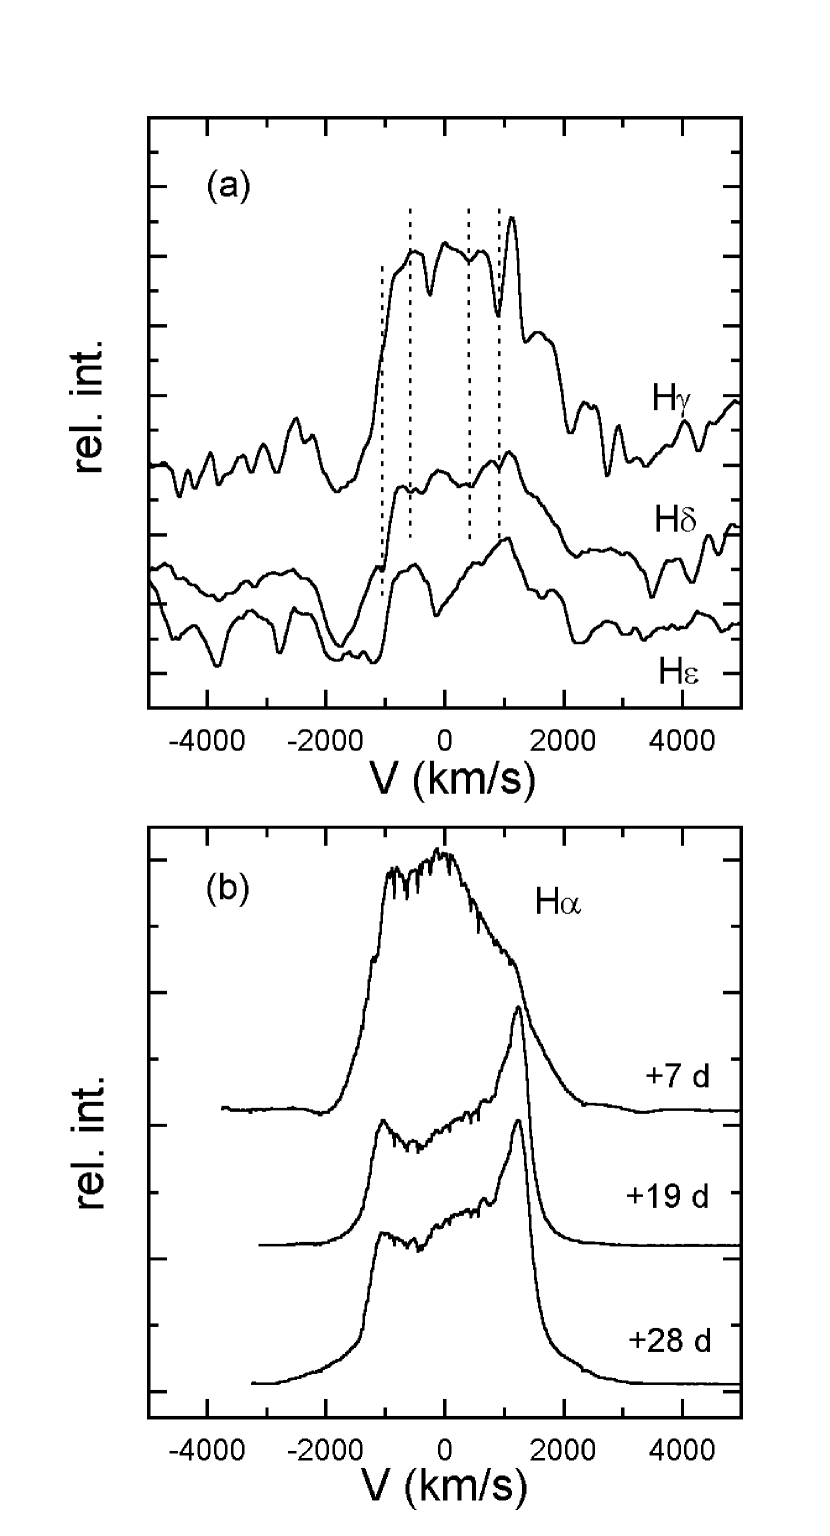
The obtained low-resolution spectrum is plotted in Fig. 1, where the most characteristic features are also marked. Fig. 1 clearly illustrates the typical principal plus diffuse-enhanced spectrum. The prominent Balmer series and Fe II multiplets have P-Cyg profiles that were already reported by Moro et al. (1999). Note the Fe II and He I blend at 4500 Å. The presence of strong Fe II multiplets suggest that V1494 Aql belongs to the “Fe II” class of classical novae defined by Williams (1992). Adopting the interpretation of Williams (1992), this means that the line formation happens in a post-outburst wind. The higher-resolution view of the blue region is presented in Fig. 2, where the hydrogen profiles show interesting substructures in absorption. This system of narrow absorption components of H and H lines can be seen in Fig. 3a. The symmetric sharp absorption lines are shifted approximately by 400 and 1000 km s-1 relative to the central emission near the rest wavelength. H is shown for comparison, because of the similar complexity.
The evolution of the H profile was followed through 4 weeks after the maximum. The earlier non-Gaussian emission peak changed to a saddle-shaped profile with two maxima at 1050 km s-1 and +1200 km s-1. (Fig. 3b). Unfortunately, the possible similar narrow absorption lines are strongly affected by the atmospheric telluric lines.
3 The light curve
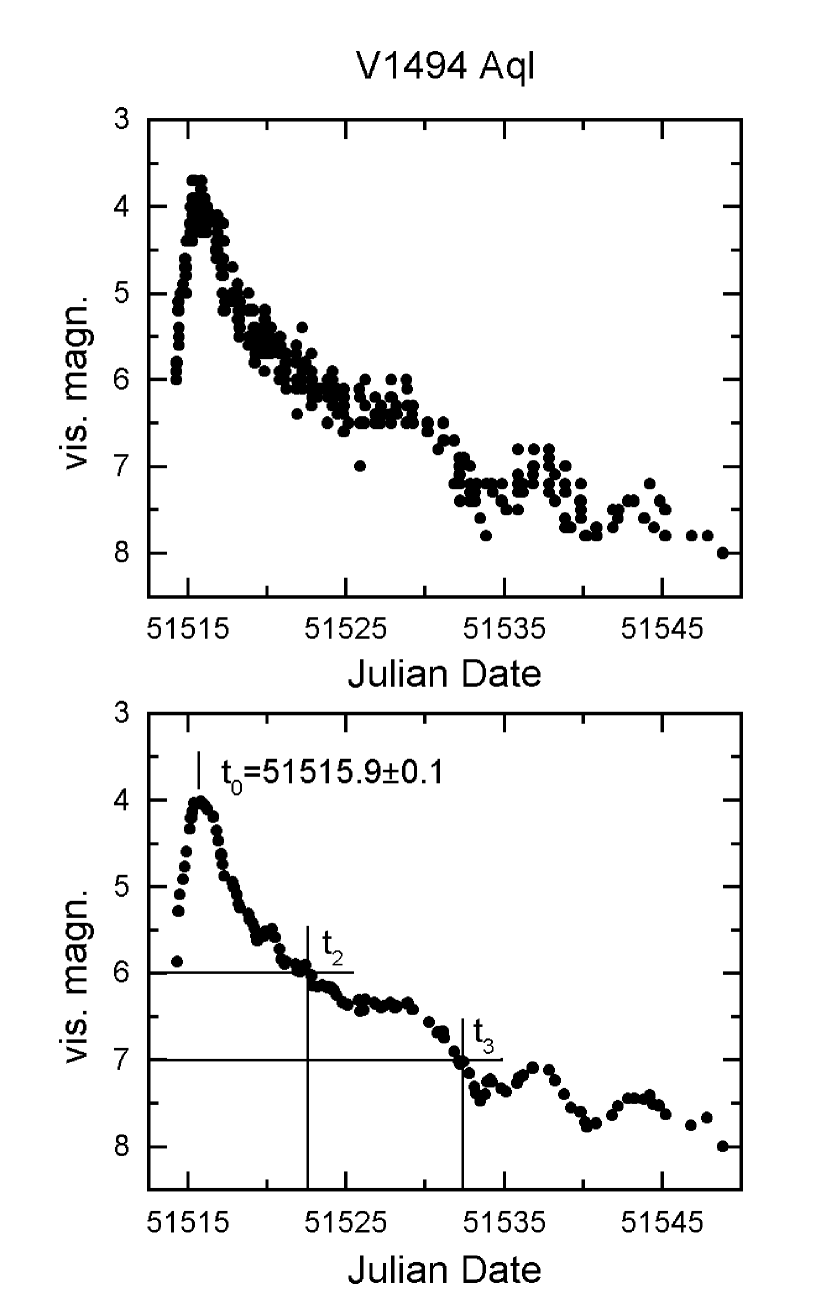
To estimate the light curve parameters, we used visual magnitude estimates by amateur astronomers that were made available by the VSNET group (this data also includes the observations published in the IAU Circulars). Between the discovery on Dec. 1, 1999 and Jan. 5, 2000, almost 420 individual points were collected. As the typical uncertainty of a visual estimate is about 0.3 mag, we have determined a mean light curve by taking 0.1-day bins and calculating the mean value from the individual points. This led to an averaged light curve containing 117 points, which was further noise-filtered by a simple Gaussian smoothing with 0.08 days FWHM. This approach can only be used when the original light curve is dense enough and therefore, the observational scatter can be properly averaged (see Kiss et al. 1999 illustrating this method). The resulting visual light curve is plotted in Fig. 4, where the maximum, and are also indicated. The derived parameters are: =2451515.90.1 days (1999 Dec 3.4 UT), =6.60.5 days, =160.5 days. Consequently, V1494 Aql is a fast nova and the spectroscopic observations were done 6, 7, 19 and 28 days after the maximum. We note, that the statistical relationship between and (, Warner 1995) agrees well with the observed values, as the determined would imply a of 14.5 days.
The most striking post-maximum feature is the additional cyclic brightness change following the fast decline. The characteristic period of this secondary variation is about 7 days with an approximate semi-amplitude of 0.3–0.4 mag. It occured 10 days after the maximum light. Fortunately, the nova was at 7.0 mag (maximum plus 3 mag) around the mean level of the cyclic change, therefore, is only weakly affected. The occurence of the quasi-periodic brightness oscillations indicated the start of the transition phase, when the fast novae often show variations with quasi-periods ranging from 5 days (GK Per) to 25 days (DK Lac, Warner 1995), generally with a time-scale being close to . The underlying physical mechanism could be related either to accretion disk phenomena (Leibowitz 1993) or to the contracting photosphere of the white dwarf (Bianchini et al. 1992).
Three maximum magnitude versus rate of decline (MMRD) relations were used to calculate visual absolute magnitude (Della Valle & Livio 1995, Capaccioli et al. 1989 and Schmidt 1957). They gave 8.84 mag, 8.87 mag and 8.72 mag for MV and Mvis, respectively. Another method, involving the absolute magnitude 15 days after maximum (Capaccioli et al. 1989), resulted in MV(max)= mag (formal error), however, this value has higher uncertainty due to the brightness oscillation in the transition phase. All of these values suggest an approximate visual absolute magnitude of mag being typical among the fast novae. The distance can be determined from the apparent maximum brightness (mvis=4.0 mag). Neglecting the interstellar reddening, the distance is d=3.60.3 kpc. The absence of strong Na I D absorption may suggest that the reddening is low indeed. The mass of the white dwarf in V1494 Aql was estimated using Eq. (6) of Livio (1992) assuming (i.e. M) (Warner 1995). It resulted in MWD=1.1 M⊙, however, this value should be only considered as a rough estimate. Finally, the calculated distance and the apparent brightness of the likely progenitor (Pereira et al. 1999) give the pre-outburst visual absolute magnitude of the system. There is a star in the USNO-A2.0 catalogue very close to the position of the nova with red mag 15.6 and blue mag 17.4. These values correspond to an approximate visual apparent magnitude 16.5, that results in Mvis=3.7 mag for the progenitor, which is normal for quiescent novae (Ringwald et al. 1996). This result excludes the possibility of a giant secondary component, like in GK Per or RS Oph.
4 Conclusions
The overall appearence of the low-resolution spectrum covering the whole optical range strongly resembles Nova LMC 1988 No.1 (see Fig. 1 in Williams 1992) being a nova with characteristic “Fe II” type spectrum. Also, it is very similar to the spectrum of the fast (=5 days) nova, Nova LMC 1988 No. 2 (Sekiguchi et al. 1989, Williams et al. 1991). Sekiguchi et al. (1989) found two distinct sharp absorption systems in the Balmer lines resembling our medium-resolution observations of the H and H profiles. The presence of such complex absorption systems is a common phenomenon in novae (Sekiguchi et al. 1989), which may usually be traced even to H–H8 in the Balmer series. Unfortunately, we have obtained only one spectrum in that spectral region, therefore, we have no information on the time evolution and no firm conclusion can be drawn about the underlying physical reasons. One would speculatively expect such symmetric (400 and 1000 km s-1) and narrow absorption lines in an axisymmetric wind during the common envelope (CE) phase in the outburst, when the CE phase produces a density contrast between the equatorial and polar directions (Livio et al. 1990). This is supported by the observed H profiles, which showed first an emission profile with one main component (simultaneously with the H and H observations) and then the split into two main peaks after 19 days.
The saddle-shaped H profile suggest the non-spherical symmetry of the nova shell. Most recently, Gill & O’Brien (1999) presented an ensemble of calculated emission-line profiles from model nova shells with various symmetries. The observed shape of the H line corresponds to an equatorial ring seen most probably nearly edge-on. The difference of the blue and red peaks in the H can be associated with possible small-scale clumpiness in the shell, which produces an increase in brightness in the receding half of the shell (see Gill & O’Brien 1999 concerning the observed asymmetries in the emission-line profiles of V705 Cas).
Adopting the calculated distance of 3.6 kpc and and expansion velocity of the nova shell of 2000 km s-1 given by the radial velocity of the absorption component of the P-Cyg profiles, Eq. (5.10) in Warner (1995) gives 011 for the angular radius of the shell after 1 year. This is within range of the HST. Therefore, subsequent spectroscopy and high-resolution imaging may confirm the existence of the hypothetic non-spherical structure. Evidence suggests this to be an equatorial ring.
Acknowledgements.
This research was supported by Hungarian OTKA Grants #F022249, #T022259 and Szeged Observatory Foundation. Fruitful discussions with J. Vinkó are gratefully acknowledged. The referee (Dr. M. Orio) has greatly improved the paper with her helpful comments and suggestions. The NASA ADS Abstract Service was used to access data and references.References
- (1) Bianchini, A., Friedjung, M., Brinkmann, W. 1992, A&A 257, 599
- (2) Capaccioli, M., Della Valle, M., D’Onofrio, M., Rosino, L. 1989, AJ 97, 1622
- (3) Cohen, J.G. 1988, ASP Conf. Series 4, 114
- (4) Della Valle, M., Livio, M. 1995, ApJ 452, 704
- (5) Fujii, M., Ayani, K., Liller, W., Skiff, B., et al. 1999, IAU Circ. No. 7324, 1.
- (6) Gill, C.D., O’Brien, T.J. 1999, MNRAS 307, 677
- (7) Kiss, L.L., Szatmáry, K., Cadmus, Jr., R.R., Mattei, J.A. 1999, A&A 346, 542
- (8) Leibowitz, E.M. 1993, ApJ 411, L29
- (9) Liller, W., Frasca, A., Messina, S. et al. 1999, IAU Circ. No. 7327, 2.
- (10) Livio, M. 1992, ApJ 393, 516
- (11) Livio, M., Shankar, A., Burkert, A., Truran, J.W. 1990, ApJ 356, 250
- (12) Moro, D., Pizzella, A., Munari, U. et al. 1999, IAU Circular No. 7325, 1.
- (13) Pereira, A., di Cicco, D., Vitorino, C., Green, D.W.E. 1999, IAU Circ. No. 7323, 1.
- (14) Pontefract, M., Ivison, R.J., Tilanus, R.P.J. et al. 1999, IAU Circ. No. 7330, 2.
- (15) Rao, J., Giovanardi, S., Tao., H-L., et al. 1999, IAU Circ. No. 7326, 3.
- (16) Ringwald, F.A., Naylor, T. Mukai, K. 1996, MNRAS 281, 192
- (17) Schmidt, T. 1957, Z. Astrophys. 41, 182
- (18) Sekiguchi, K., Kilkenny, D., Winkler, H., Doyle, J.G. 1989, MNRAS 241, 827
- (19) Warner, B. 1995, Cataclysmic variable stars, Cambridge Univ. Press, Cambridge
- (20) Williams, R.E. 1992, AJ 104, 725
- (21) Williams, R.E., Hamuy, M., Phillips, M.M. et al. 1991, ApJ 376, 721