A Young Globular Cluster in the Galaxy NGC 6946111Based on observations made with the Nordic Optical Telescope, operated on the island of La Palma jointly by Denmark, Finland, Iceland, Norway, and Sweden, in the Spanish Observatorio del Roque de los Muchachos of the Instituto de Astrofisica de Canarias.
Abstract
A globular cluster My old that contains M⊙ of stars inside an pc radius has been found in the nearby spiral galaxy NGC 6946, surrounded by clouds of dust and smaller young clusters inside a giant circular bubble 300 pc in radius. At the edge of the bubble is an arc of regularly-spaced clusters that could have been triggered during the bubble’s formation. The region is at the end of a spiral arm, suggesting an origin by the asymmetric collapse of spiral arm gas. The globular is one of the nearest examples of a cluster that is similar to the massive old globulars in the Milky Way. We consider the energetics of the bubble and possible formation mechanisms for the globular cluster, including the coalescence of smaller clusters.
Subject headings: stars: formation — ISM: bubbles — globular clusters: general
submitted … 7 June 1999, accepted … 18 January 2000
1 Introduction
During a recent search for massive young clusters in the nearby spiral galaxy NGC 6946, Larsen & Richtler (1999) found a circular bubble containing numerous small clusters and a bright compact cluster that resembled a young globular. Some of the small clusters in the bubble are organized into arc-like shapes. This feature was found and sketched first by Hodge (1967) as the only positive detection in his search for multiple-arc structures similar to that in the Constellation III region of the LMC. The diffuse object inside the bubble was noted later by Efremov (1999), who suggested it was a cluster causally related to the arcs in the same way that the LMC massive cluster NGC 1978 might be related to Constellation III.
The mass and radius of the brightest cluster in this region make it similar to the globular clusters in the outer halo of the Milky Way (see review in VandenBerg, Stetson & Bolte 1996). Globular cluster formation is very rare in normal galaxy disks (the Milky Way disk has none), yet other young globulars have been found in dwarf galaxies like the LMC (van den Bergh 1991; Richtler 1993), and in interacting galaxies (Whitmore & Schweizer 1995) and starbursts (Maoz et al. 1996; Holtzman et al. 1992; Meurer et al. 1995). Because of this, there is growing anticipation that we will soon be able to understand the origin of the old population of globular clusters in the Milky Way and other galaxies by studying their younger versions. In this respect, we can use the young globular in NGC 6946 for closer study.
Here we consider the properties of the bright compact cluster in NGC 6946 in view of the environment in which it formed. The observations are presented in section 2, an analysis of the energetics and pressures of the region are in section 3, and a discussion of possible mechanisms for the formation of the globular are in section 4.
2 Observations
Observations of clusters in NGC 6946 and other galaxies were made with the Nordic Optical Telescope by Larsen & Richtler (1999), who discussed the results in general terms. The bubble surrounding the brightest cluster in the galaxy caught our attention because of its peculiar structure and possible implications for understanding globular cluster formation.
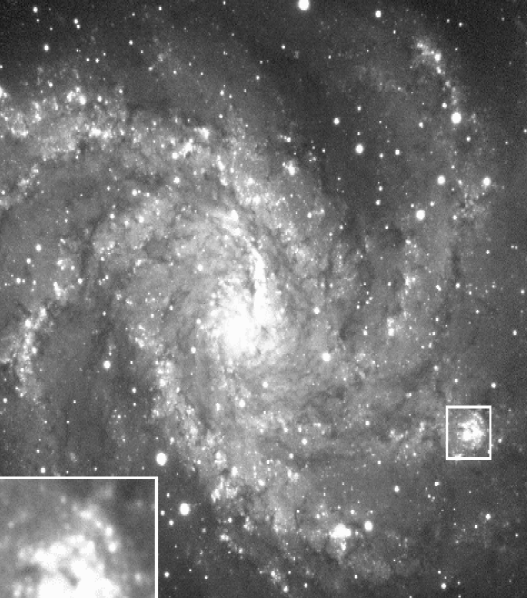
Figure 1 shows a color222Black and White for Astro-ph to limit file size image of this galaxy in B, V, and R+H, with an insert magnifying the bubble region. The structure of the star formation here is unlike anything else in the galaxy. It is located at the end of a short spiral arm, downstream from a dust lane, with a circular bubble outlined by an arc of clusters in the west and a dark region, suggesting dust, just to the right. Red patchy emission from H surrounds the bubble as if star formation is continuing there in dense residual gas. The brightest and largest concentration of starlight emission inside the bubble is the globular-like cluster. The overall dimensions of the cavity are pc east-west and pc north-south, assuming a distance of 5.5 Mpc (Tully 1988).
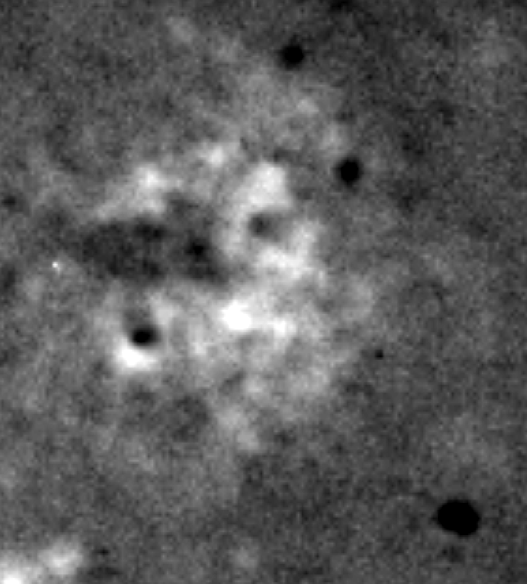
The extinction in the region is shown better by a plot of VI in figure 2, which covers 28”33” around the bubble. Many of the dark patches are irregularly shaped, like clouds in the midst of diffuse and clustered stellar emission. A large dark region near the center of the bubble, north of the brightest cluster, could be the remains of the molecular cloud from which the cluster formed. Its dimensions are pc. We measured the extinction in this region in two ways: the brightness deficiency in the B band, and the V-I color excess, both compared to the surrounding light. These two measurements are independent and they give the same result, mag.. This implies that the feature is really dust and not just a lack of stars, and that the dust is mostly in front of the emission. With this average extinction for the molecular cloud feature and its size given above, the mass becomes M⊙.
Another VI dust feature halfway out to the western edge resembles a cometary globule, and this, along with the scalloped structures along the western edge, point back to the brightest cluster. Other dust patches and partial arcs are also evident in the V-I figure, inside the bubble and beyond the bubble boundary. The dark region just to the north of the globular cluster is probably an artifact of color variations in the point spread profiles of the bright cluster image.
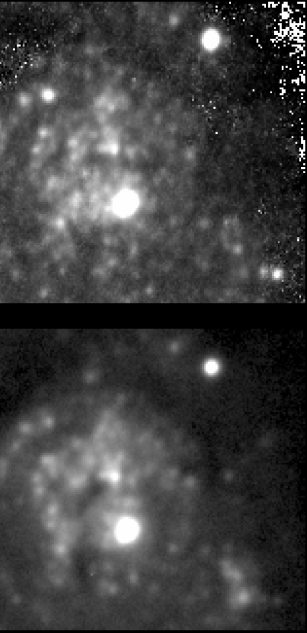
Figure 3 shows a V-band image of the same bubble region on the left and a de-reddened V-band image on the right, made from the observed ratios of V and I band intensities and corrected in V for the corresponding extinction, assuming all the dust is foreground and the background color is uniform. Many of the dark regions and bands in figure 2 fill in with what appear to be tiny clusters, and some of the arc-like structures go away. This technique cannot correct for extremely heavy obscuration because then there is no emission for the determination of V-I color excess. The dark region beyond the bubble in the west, seen in figure 2, may have this problem (the spots indicate that the V/I intensity ratio has overflowed).
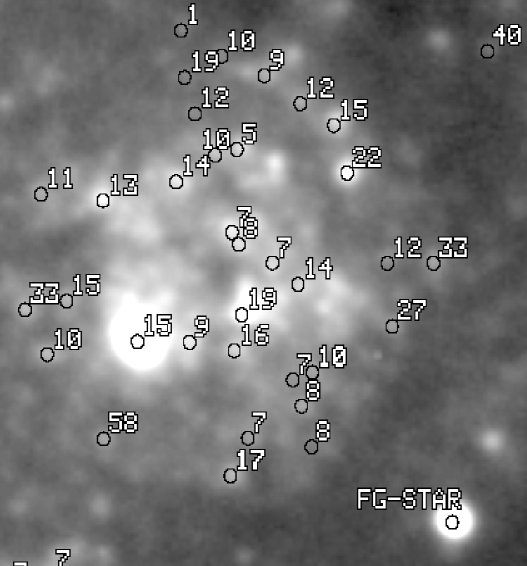
A low-contrast I-band image with cluster ages in millions of years is shown in figure 4. The ages were determined from their integral colors, U-B and B-V, following the S-method and calibration in Girardi et al. (1995). For the brightest clusters, the ages range from 10 to 30 Myr with no overall pattern inside the bubble. The colors of the globular cluster (U-B=-0.74, B-V=0.01, V-I=0.52; Larsen 1999), give it an age of million years. The bright spot in the southeast outside the bubble is a foreground star.
A color-magnitude diagram for the same objects is shown in figure 5. The lines are stellar isochrones for stars at the indicated ages, with each line spanning a wide range of stellar masses from 0.6 M⊙, which is outside the figure, to the masses corresponding to the endpoints of stellar evolution (from Bertelli et al. 1994). The diamonds are the objects inside the bubble; the source at is the globular cluster. This figure demonstrates that the small sources inside the bubble are too bright to be stars if they are at the distance of NGC 6946. Even the brightest stars in M33, at M mag (Humphreys & Sandage 1980), are not as bright as the objects in the bubble.
The ages given in figure 4 are slightly sensitive to unknown absorption. We can estimate the error from figure 10 in Girardi et al. (1995), which suggests that a color excess of E(B-V) = 0.2 mag. changes an age of 15 My to 11 My. Thus the ages determined from the S-method are probably accurate to no better than %, and may be systematically large. We can also estimate the ages from the extinction-free parameter (; van den Bergh 1968), calibrating Q vs. log(age) using the population synthesis models by Bruzual & Charlot (1996), and assuming all the emission is behind the dust and not mixed with it. These ages also tend to be slightly less than the values given in figure 4. For example, the globular cluster age becomes My from its extinction-free value. This second check on the ages is also useful because the Girardi et al. ages were calibrated for the LMC, where the metallicity is relatively low. Considering measurement errors and extinction uncertainties, the ages in figure 4 are probably accurate only to My. In what follows, we assume an age for the whole region of My; it could range between 20 and 40 My, but this distinction is not important. The energy required to make the bubble scales as the inverse square of the age.
The absolute magnitude ( mag) of the globular cluster makes its mass M⊙, from the calibration in Bruzual & Charlot (1993, 1996; see Leitherer et al. 1996), assuming a Salpeter IMF between 0.1 M⊙ and 150 M⊙. If we assume a more realistic flattening of the IMF below M⊙ (Festin 1997; Hillenbrand 1997; Luhman & Rieke 1998; Lada, Lada & Muench 1998; Hillenbrand & Carpenter 1999), then the mass is M⊙. Other clusters in the same region are at least 2 magnitudes fainter than the globular, although they have about the same ages, and all the other clusters elsewhere in this galaxy are at least 1 magnitude fainter than the globular.
The radial intensity profile for the globular cluster is shown in figure 6, along with the profile for the bright star in the southwest. The globular is clearly more extended than the star. The half-light radius is 11 pc from a fit to a King light profile, corrected for telescope resolution (Larsen & Richtler 1999; Larsen 1999). This radius is highly uncertain because the seeing resolution of 0.6” corresponds to 15 pc. The radial profiles of the fainter objects in the field are somewhat extended too, making them appear fuzzy in the image and more like clusters than stars. However, the S/N for these profiles is too poor to give cluster sizes. We intend to verify the cluster nature of the fainter objects using HST images.
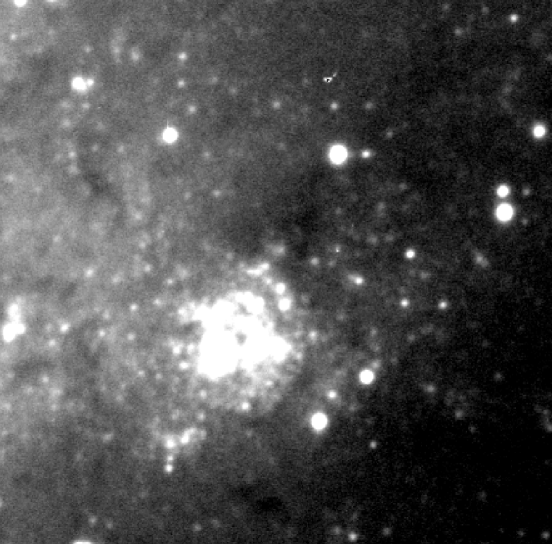
The large-scale environment of the bubble is shown in figure 7, from an I-band image. The bubble is clearly defined in the midst of spiral arm stars and surrounding dust. There is a thin dust arc just outside the bubble edge in the southwest, which is probably part of the dust shell surrounding the cavity. A larger dust feature is at the edge of the bubble in the northwest, connecting to the spiral arm dust lane that trails off further in this direction (cf. Fig 1). Essentially all of the star formation in the vicinity of the globular cluster is confined to the bubble cavity; the surrounding dust hides only a small amount of additional star formation in comparison to what has already occurred, considering the weak H outside the bubble (Fig. 1). This suggests that much of the star formation inside the bubble, including the arc of clusters at the edge, is causally related and possibly triggered or synchronized by a series of high pressure events.
3 The Origin of the Bubble
3.1 Multiple stellar winds and supernovae
Figures 2–7 indicate that the bubble in NGC 6946 contains a single bright cluster and a concentration of smaller sources, many of which are probably smaller clusters.
Most of these clusters are concentrated within a pc diameter region inside a pc cavity. A few other clusters lie along the rim of the bubble and more may be outside, producing the H emission evident in figure 1. The densest concentration of sources is within pc of the globular, as seen in figure 3. We count about 25 objects there. This concentration is packed so tightly that many of the luminous sources blend together.
The total luminosity of all of the bright clusters in the bubble suggests that a large number of supernovae exploded during its My lifetime. These supernova and the winds of the associated massive stars could have dispersed most of the dense gas that formed the clusters and left only the M⊙ dust cloud and other dust clouds seen in figure 2, now located pc or more from the globular. The cometary and shell-like debris inside the cavity could have been shaped by the supernova and stellar winds too.
A disturbance pc in radius that has been driven for million years by continuous pressures from winds and supernovae will have a mass for ambient surface density and a speed (Weaver et al. 1977). The kinetic energy is erg. Here we have rewritten the ambient mass column density of the galaxy in terms of the equivalent V-band extinction through the disk, AV gm cm-2, using the conversion in Bohlin, Savage & Drake (1978) with 10% He by number.
Typically the energy required to make a bubble from multiple supernovae and stellar winds is times the kinetic energy of the expansion because of energy loss from radiation in the shocks and decompression of the cavity (MacLow & McCray 1988). For example, the product of the wind luminosity and the time in the Weaver et al. (1977) model (cf. their equation 21) is 5.1 times the instantaneous kinetic energy. For a factor of 10 from MacLow & McCray, the source energy becomes ergs, scaling with the inverse square of the age of the bubble.
We expect before star-formation began for the average of the dense part of this spiral arm gas, based on direct measurements of extinction in spiral arm shocks (Elmegreen 1980) and on extinction, HI, and CO maps of this galaxy. The average extinction on pc scales surrounding the bubble currently exceeds 2 magnitudes in B band (Trewhella 1998), while the summed atomic (Boulanger & Viallefond 1992) and molecular (Tacconi & Young 1989) gas column densities over a 1 kpc region correspond to mag.
If equaled 3 mag in the vicinity of the bubble before star-formation began, then the expansion required the equivalent of supernovae, each with a typical energy of ergs. If the bubble age is only 15 My, the age of the globular cluster, then the equivalent number of supernova would be . This is easy for a cluster with M⊙, because there would be 2700 stars more massive than the turnoff mass at 15 My (which is 14 M⊙), assuming a flattened Salpeter IMF out to 150 and stellar evolution models in Bertelli et al. (1994). With so many expected supernovae, the expansion age could be even younger than 15 My, or larger than 3. Presumably some of these supernovae made the smaller shells inside the bubble too, producing the overall frothy appearance in figure 1. In this case these supernovae may have been ejected from the globular.
The average energy density in the bubble is cm-3 K. The energy density in the core, at the peak of the input rate, should have been at least 10 times this average. For , this peak is cm-3 K, which is similar to that around OB associations in the Solar neighborhood. Thus the pressure that made the bubble was not unreasonably large, in spite of the high density of stars in the center. This is because the overall star formation rate in the pc region inside the bubble is typical for spiral arms. The only difference in the bubble here is that most of this star formation went into a single dense cluster, rather than a giant, extended star complex, like Gould’s Belt.
3.2 Alternative Scenarios
An alternative source of pressure for the bubble should also be considered for this massive central cluster. It seems possible that such a cluster would have sufficient opportunity to produce several rare hypernovae (Paczyński 1998) from the collapse of extremely massive or otherwise rare single or binary stars. For example, a Salpeter IMF that flattens below 0.3 M⊙ in a cluster that contains would be likely to produce stars with masses between 100 M⊙ and 150 M⊙ if the maximum mass were 150 M⊙. Such massive stars could produce hypernovae of the type described by Paczyński (1998). If the IMF continued up to arbitrarily high masses, then the largest star would have an unlikely mass of M⊙ in a M⊙ cluster, just from sampling statistics alone (without any consideration of whether such massive stars are physically possible). Of course, stars this massive have never been found, but neither has a fixed upper limit to the stellar mass in a cluster: the largest star just keeps getting larger for larger clusters (e.g., Massey & Hunter 1998). Thus the largest star could conceivably contain several hundred M⊙. If such a star, or any other rare object exploded, possibly making a gamma ray burst, it could have an energy larger than a single supernovae by a factor of (Rees & Mézáros 1998) and be able to produce one of the large arcs of gas and dust individually (see also Efremov 2000).
Although there is no direct evidence for unusual pressure sources like hypernovae, there are several remarkable properties of the bubble that are not usually part of the standard, multiple supernovae/stellar wind scenario (Tenorio-Tagle & Bodenheimer 1988).
First, the bubble is not elliptical or elongated along the major axis of the galaxy. This implies that it is not a circular ring in the midplane (unless an intrinsic ellipticity fortuitously cancels the projection effect), but more like a sphere with some thickness perpendicular to the plane. Yet its diameter (600 pc) is much larger than the likely disk thickness. This leads us to wonder how such a circular bubble could have formed in the first place. Its uniform shape would seem to require a very uniform external medium for the pressure to push around, yet disturbances perpendicular to the plane generally propagate into decreasing densities. Perhaps the shocked gas in the density wave really does have such a large thickness, and what we were calling a GMC in Section 2 is really the near side of the bubble, far above the plane.
Second, the clusters that lie along the bubble rim to the north, west, and south are somewhat uniformly spaced, as if they were triggered by the regular gravitational collapse of a swept-up shell (e.g. McCray & Kafatos 1987). However, the ages of these rim clusters are about the same as the ages of all the other clusters inside the bubble, including the globular cluster, so there is no evident time sequence or source of pressure for this triggering. Efremov (2000) suggested that there had to be some invisible older generation ( My) of clusters or super-explosions that made all of these features at about the same time, i.e., the overall bubble, the outer cluster arcs, and possibly the globular cluster. Alternatively, the photometric ages could be wrong.
Third, the interior of the bubble contains dust (and presumably gas) clouds, including a comet-shaped cloud half-way out to the western edge. How can the bubble outside these clouds be so circular? Wouldn’t the comet and other interior clouds block the expansion along their paths if the pressure source was near the bubble center? Does this imply that the bubble formed before the comet cloud and that there were two epochs of high pressure in this region? A similar situation seems to occur in the Constellation III region of the LMC, where the HI cavity is much larger than a triggered arc of stars (Efremov & Elmegreen 1998). The solution here might be simply that the dark debris in the interior of the bubble is far above the plane on the near side, and not on the line of sight between the central pressure source and the western edge.
Fourth, there is apparently some star formation beyond the bubble, in the H-emitting regions. This makes us wonder if the western arc of clusters is not really an arc of stars but an arc of clear-viewing, seen through a dust screen made up of dense material with its own arc shape, just inside the stellar arc, and other dense material with an arc-shaped inner border, just beyond the western edge (cf. Fig. 2). What is the source of the inner gas shell in this interpretation? Can multiple supernovae and stellar winds make such a shell inside a pre-existing bubble cavity, or does it require a more concentrated giant explosion as in the hypernova scenario discussed above? Did this additional explosion also occur after the bubble formed, as suggested above for the comet cloud?
All in all, the high concentration of star formation in this region, forming what appears to be a dense cluster of clusters, is unusual for non-interacting galaxies. The presence of background stars to the west of the bubble in figure 7 suggests that the obscuration there is not so large that it could hide a significant amount of additional star formation, at least not comparable to what is in the bubble itself. This means that the western edge of the bubble is only partly the result of an end to the clearing of the cavity; it is also from a lack of bright clusters beyond. If there was any triggering of star formation, especially to make the arcs along the bubble edge, then this triggering has stopped near the current limit of the bubble. The sharp western edge of the bubble may then be explained if this is a triggered shell of clusters.
The sharp edge and the perfect circular shape of the western rim of the bubble is the property shared also by a number of other stellar arcs in a few galaxies, first of all in the Constellation III region of the LMC. The circular and sharp outer edges indicate triggered star formation in the partial spherical shells, the occurrence of the multiple arcs near each other being connected with the common origin of the pressure sources. Most probably they were ejected from a rich nearby cluster (Efremov, 2000). As mentioned above, the exact nature of suggested triggering is difficult to understand, as is the source of pressure, but super-explosions cannot be overlooked.
Thus we see that even though the energy and pressure inside the bubble are somewhat normal for an aggregate of stars like this, the morphology of the whole region is baffling. Perhaps higher resolution and longer wavelength observations will help clarify these questions.
4 Speculations about Globular Cluster Formation
4.1 General Discussion of the Observed Environment for Globular Cluster Formation
Why should a globular cluster form in this region of NGC 6946 and no where else? This is a special location at the abrupt end or break-point in a secondary spiral arm. When star formation began, there was a gross asymmetry in the self-gravitational force of the spiral arm gas, with most of the acceleration pointing inwards along the arm. Such asymmetry would cause catastrophic collapse in a large mass of gas, possibly like the end of a tidal tail (Barnes & Hernquist 1992; Elmegreen et al. 1993). The total atomic (Boulanger & Viallefond, 1992) and molecular (Tacconi & Young 1989) mass observed in a kpc region around the globular cluster is M⊙, which is times higher than the typical cloud mass from normal density wave triggering (Elmegreen 1994).
Not all disk globular clusters form at the ends of spiral arms, however, and the other arm endpoints in NGC 6946 contain no globular clusters, even though they often contain massive star-forming regions (cf. Fig. 1). Something peculiar happened here to make the dense, massive cloud that was necessary for the globule to have formed.
What is unusual about this region? The density of the globular cluster alone is not particularly high. The average half-light density is only stars pc-3, which is much smaller than the stars pc-3 in the Orion Trapezium cluster (Prosser et al. 1994; McCaughrean & Stauffer 1994) and Mon R2 (Carpenter et al. 1997). The corresponding density would have been cm-3 with a 25% star-formation efficiency (e.g., Elmegreen et al. 2000), and this is similar to that in a GMC core. The main peculiarity with the globular cluster is the large mass at this density. For an efficiency of 25%, the gas mass to make a M⊙ cluster would have been M⊙, which is comparable to that of the largest GMCs in the Milky Way but here concentrated inside several tens of parsecs. Such a high mass concentration means that the virial velocity and pressure of the cluster-forming core were large. A M⊙ cloud with a half-light radius of pc has a virial speed km s-1 and a pressure , which converts to K cm-3 for Boltzmann constant .
The pressure would have been slightly lower in the surrounding gas. If we consider the core of luminous sources surrounding the globular cluster in figure 3, which has a pc radius, and estimate that the total mass in that core increased linearly with radius as for an isothermal density profile, then the mass there would be times larger than the globular core mass, or M⊙. The average pressure would be K cm-3 and the virial speed still km s-1.
These virial speeds are comparable to the thermal speed of an HII region, suggesting that the O-type stars which formed in the clusters would have had some difficulty destroying the cloud cores. The core pressures are also large enough to avoid complete ionization of the gas. These are welcome checks on the most basic theory of globular cluster formation: the cloud-binding energy densities and escape speeds have to be large enough to keep the gas around to continue forming stars, in spite of all the O star ionization, until the critical efficiency to form a bound cluster is reached (Elmegreen & Efremov 1997).
The pressure in the 60 pc core region was times higher than the typical pressure in a local OB association and molecular cloud core and times higher than the ambient pressure in the Solar neighborhood. The pressure in the 11 pc core was times higher than in a local OB association/GMC core. Most likely the ambient pressure in the NGC 6946 region was times the ambient pressure in the Solar neighborhood, and the extra factor of for the cloud cores over the ambient value was from the self-gravity of the material surrounding it. Such overpressures are typical for star-forming clouds in the Solar neighborhood. What might have given the pre-cluster interstellar medium a pressure of cm-3K over a region perhaps a kiloparsec in size?
Considering the location of this region of star formation inside NGC 6946, we should probably concentrate on the effects of a spiral density wave shock. For an incoming average HI density of 1 cm-3, a shock speed of km s-1 would have reached the required K cm-3 pressure over a large region. Such a shock speed is not unusual for a galaxy like this, and when combined with an asymmetric collapse from the arm end, could have conspired to make the pressure in a massive virialized cloud somewhat high.
A second constraint on the formation of the globular cluster is its small photometric age. Obviously it had to form very quickly, probably within only several million years, to have such a young age with no obvious dust or irregular structure remaining inside of it. The only dense dusty material that we see nearby is a M⊙ cloud some 100 pc away, which could be the remains of the cloud core that formed it. Such a quick formation time follows from the most basic model (e.g., Fig. 4 in Elmegreen & Efremov 1997) if clouds typically convert their gas into stars in only several dynamical time scales of the cloud core. At the pre-cluster density in the globular core, the dynamical time was million years. This is fast enough to form the globular and clear away most of the debris within its My lifetime. Such a short time scale also implies that supernovae in the cluster did not enrich the gas much before it was cleared away. This helps us understand how the oldest globulars in the Milky Way halo can have very low metallicities even though they must have had massive stars.
4.2 A Coalescence Model for the Formation of the Globular Cluster
These aspects of the environment of the globular cluster in NGC 6946 are all consistent with what we believe to be necessary for the formation of such a massive object with a normal IMF, and they are also consistent with the location of this cluster inside the galaxy. They do not indicate how the globular actually formed, however. It need not have formed by the monotonic collapse of a single cloud core, for example, as in the standard scenario for cluster formation. Instead, it could have formed by the agglomeration and accretion of smaller clusters in the vicinity, provided the timescale for such accretion was short enough. Indeed, there are several peculiarities of star formation here that suggest such accretion might have actually happened.
First, there is an extremely high concentration of small luminous sources that may be individual clusters surrounding the globular cluster. This is shown best by the extinction-corrected image in figure 3. We count small objects within a radius of 60 pc, and estimate that there are probably an equal number in the foreground and background of the bright globular cluster image. This would make the current cluster density pc-3 if all these objects are small clusters.
Second, the mass function of all the known clusters in this region is discontinuous. The globular cluster is times more massive than any of the other clusters. This is unusual for disk cluster systems, which tend to have a continuous power-law mass distribution (van den Bergh & Lafontaine 1984; see the review in Elmegreen et al. 2000). Discontinuous mass functions, with a single largest object having a mass much larger than any other object, can arise from a runaway accretion process as the gravitational cross section of the largest object increases with mass. This could have been important for old globular clusters because their mass distribution differs from that of disk clusters today (van den Bergh 1995). In fact the old clusters have a characteristic mass similar to that of the globular cluster in NGC 6946, so formation processes like agglomeration, which break away from the power law distributions of normal disk clusters, might be important.
Third, the photometric age of the globular cluster, My, is about the average age of all the other clusters in the bubble, which is 14.4 My not counting the globular cluster itself, or 12.5 My if we omit the 58 My-old cluster in figure 4. This equality is to be expected in a coalescence model: the photometric age of the globular would not be its true age from some single star formation event, but the luminosity-weighted average age of all of the clusters it accreted. The true age could be the maximum age of the neighbors, because this marks the beginning of all star formation in the region and the time when the accretion process might have begun. This third point is uncertain, however, because of the statistical errors in the age measurements.
Finally, the globular cluster has a low average density, lower than the densities of embedded clusters that typically form near the Sun. Accretion can do this because it puffs up a cluster with the kinetic energy of the accreting pieces, giving it a lower average density than any single piece. We discuss this effect in more detail below.
We first check the accretion model by calculating the accretion rate for the small objects that are currently in the dense region surrounding the globular. This rate is for surrounding cluster density estimated above, cluster velocity dispersion , and capture cross section . The cluster velocity dispersion is taken to be 12 km s-1 from the virial dispersion in the cluster core, derived above. The capture cross section is
| (1) |
for core radii of the globular and incident clusters, pc and , globular cluster mass, M⊙, and gravitational focusing factor () in large parentheses above. For , pc2. Then the accretion rate is field cluster per My. If the true age of the globular cluster is not the average photometric age of all the accreted clusters but the total age range in the whole region, which is twice this average value, then the globular had My to accrete smaller clusters from the dense swarm around it. Moreover, the initial field cluster density was probably higher before the accretion began, so the accretion rate could have been higher then too. Thus the globular could conceivably have grown by accretion over a My period from an initial size comparable to that of one of smaller clusters in the area.
The potential errors involved in this calculation should be reiterated because the observations are not good enough yet to be certain about the coalescence rate. First, the globular cluster radius is close to the seeing limit so the King-profile fit used to determine pc is inaccurate. The cluster could be smaller. Second, the small sources surrounding the globular in figure 3 could be image noise, or, if not, then some of the fainter ones could be luminous stars instead of clusters. Third, the ages of the clusters are not well known, so we cannot be certain that the photometric age of the globular is the average of all the others in the neighborhood. Fourth, the gas mass that formed the globular is not observed directly, but only inferred from the need for cluster self-binding, which implies a high star formation efficiency. The first three of these uncertainties could be clarified by higher resolution observations. There is no direct way to know what the previous cloud was like.
Nevertheless, the possibility that the globular cluster formed by the accretion of smaller clusters is intriguing, and, if true, could change our way of thinking about globular cluster formation. Thus we seek another piece of evidence from the low density of the globular cluster today. Such a density might be expected in a coalescence model because of the conversion of neighbor cluster orbital energy into globular cluster binding energy.
Consider two clusters with masses and and gravitational binding energies and for constant depending on the mass distributions. If these clusters coalesce after an initial release at infinite distance and zero velocity, then, because of energy conservation, the final cluster will have a total energy . After relaxation, this will equal the total energy of the new virialized cluster, for new radius . For initial cluster densities and , the final cluster density, , becomes
| (2) |
If we consider that the globular cluster formed by the successive accretion of identical smaller clusters, each of density , and write the ratio of the current globular density to this initial density, , then decreases iteratively with as
| (3) |
Starting with , this gives a sequence of 0.25, 0.111, and so on. Thus after the successive addition of small clusters, a large cluster, 10 times as massive, forms with % of the initial density. This factor of for mass is about the ratio of the globular cluster luminosity to the luminosities of the bright neighboring clusters (2.5 mag difference in brightness), and % is about the ratio of the globular cluster stellar density to the density in a trapezium-type cluster, which is presumably similar to the cluster densities in the NGC 6946 neighborhood.
These simple checks suggest that the globular cluster in NGC 6946 could have had enough time, My, and currently has about the right mass and density, for it to have formed by the coalescence of many of the smaller objects, perhaps normal clusters, that seem to be nearby. The photometric age of the globular would then be the average age of these neighbor clusters, My, as observed within the errors. During this same total time of 30 My, the pressures from thousands of stellar winds and hundreds of supernovae in the dense star-forming region made the 600 pc bubble and pushed the residual dense gas to pc distance inside the bubble, leaving a M⊙ cloud and several cometary-shaped clouds.
5 Conclusions
A young globular cluster has been found inside a bubble of gas filled with numerous smaller clusters at the end of a short spiral arm in the nearby galaxy NGC 6946. The photometric age of the globular cluster is probably between 5 My and 30 My; the best fit is My. The mass of the globular is M⊙, and the half-light radius was estimated to be pc by a fit to King model. This radius is less than the seeing limit (16 pc) so the actual radius could be smaller. The mass and size of the whole star-forming region correspond to such a high velocity dispersion and pressure in the previous cloud core that disruption by OB stars and stellar winds would have been difficult before the supernova era began. This observation satisfies the most fundamental requirement of bound cluster formation, that the star formation process be able to continue unimpeded until a high efficiency is reached. The total time for the cluster to form was probably very short, considering the My dynamical time in the dense part of the cloud core. This time is consistent with the young age and relaxed structure of the globular cluster today.
The bubble surrounding the globular cluster could have been made by the wind and supernova pressures from evolved massive stars in the cluster. No additional pressure sources are needed, like the “super-supernova” postulated by Hodge (1967). Nevertheless, such unusual explosions might be expected for such a massive cluster, and they may have contributed to some of the arc-like structures in the gas and dust. Some of these cluster arcs seem to be real, and then they could be triggered star formation. The average pressure in the bubble is typical for the pressures in OB associations near the Sun, and the bubble size is not unusual for giant disturbances in galaxies. The near-perfect circular shape of the bubble is unusual, though, considering its size in comparison to the likely scale height of the disk.
This circular shape and the absence of clusters outside the western parts of the rim of the ’bubble’ suggest another possible interpretation: that this is in fact not a cavity in absorption (a bubble), but a spherical shell of triggered star clusters, like some other arc-shaped regions of star formation in other galaxies (Efremov 2000). This would remove the difficulties with the clearing model. At any event, such a spherical feature is unusual, and more so if the similar ages for all of the clusters inside the shell are confirmed. Then Hodge’s (1967) suggestion that there was a super-explosion in this region will be more tenable. The only alternative might be an infall of a group of clouds.
Also unusual is the formation of a Gould’s Belt worth of star mass inside a half-light radius of only 11 pc or less. We suggested that high pressures and an asymmetric collapse from the associated spiral density wave might have produced the right conditions for such concentrated star formation, but why this region should differ from so many other sites of star formation at spiral arm ends is unknown. Perhaps the pressure source that formed the outer arc of clusters, if that came first, was also involved with the formation of the globular cluster.
The possible formation of the globular cluster by the coalescence of smaller clusters was also discussed. For the assumed parameters, the cluster accretion rate is high enough to explain the globular cluster mass, and the gradual decrease in virial density by the addition of moving sub-clusters can explain the current low globular cluster density. Also explained is the apparent globular cluster age, which seems to equal the average age of all the clusters in the region, and the unusual cluster mass function, which has one massive cluster at least 10 times bigger than the rest in the midst of a swarm of what appear to be more normal clusters. Whether other globular clusters or even open clusters have had similar accretion histories is an intriguing possibility. Better observations at higher angular resolution are necessary to check this model.
Acknowledgements:
Yu.E. appreciates partial support from the Russian Foundation for Basic Research and the Council for Support of Scientific Schools. The research of SSL was supported by the Danish Natural Science Research Council through its Centre for Ground-Based Observational Astronomy. Many helpful suggestions by Tom Richtler are gratefully acknowledged, as are useful comments by the referee.
References
- (1) Barnes, J. E., & Hernquist, L. 1992, Nature, 369, 715
- (2) Bertelli, G., Bressan, A., Chiosi, C., Fagotto, F., & Nasi, E. 1994, A&AS, 106, 275.
- (3) Bohlin, R.C., Savage, B.D. & Drake, J.F. ApJ, 224, 132
- (4) Boulanger, F. & Viallefond, F. 1992, A&A, 266, 37
- (5) Bruzual, A.G., & Charlot, S. 1993, ApJ, 405, 538
- (6) Bruzual, A.G., & Charlot, S. 1996, in preparation
- (7) Carpenter, J.M., Meyer, M.R., Dougados, C., Strom, S.E., Hillenbrand, L.A. 1997, AJ, 114, 198
- (8) Efremov, Yu. N. 1999, Astr. Lett., 25, 74
- (9) Efremov, Yu. N. 2000, Astr. Rep., in preparation
- (10) Efremov, Yu.N. & Elmegreen, B.G. 1998, MNRAS, 299, 643
- (11) Elmegreen, B.G., 1994, ApJ, 433, 39
- (12) Elmegreen, B.G., Kaufman, M, & Thomasson, M. 1993, ApJ, 412, 9
- (13) Elmegreen, B.G., & Efremov, Yu.N. 1997, ApJ, 480, 235
- (14) Elmegreen, B.G., Efremov, Y.N., Pudritz, R.E., & Zinnecker, H. 2000, in Protostars and Planets IV, eds. V. G. Mannings, A. P. Boss, and S. S. Russell, Tucson: Univ. Arizona, p. 179
- (15) Elmegreen, D.M. 1980, ApJS, 43, 37
- (16) Festin, L. 1997, A&A, 322, 455
- (17) Girardi, L., Chiosi, C., Bertelli, & G. Bressan, A. 1995, A&A, 298, 87
- (18) Hillenbrand, L.A. 1997, AJ, 113, 1733
- (19) Hillenbrand, L.A., & Carpenter, J. 1999, BAAS 194, 53.01
- (20) Hodge, P.W. 1967, PASP, 79, 29
- (21) Holtzman, J.A., et al. 1992, AJ, 103, 691
- (22) Humphreys, R.M., & Sandage, A. 1980, ApJS, 44, 319
- (23) Lada, E.A., Lada, C.J., & Muench, A. 1998, in The Stellar Initial Mass Function, ed. G. Gilmore, I. Parry, & S. Ryan, Cambridge: Cambridge University Press, p. 107
- (24) Larsen, S.S. 1999, A&AS, 139, 393
- (25) Larsen, S.S., & Richtler, T. 1999, A&A 345, 59
- (26) Leitherer, C., et al. (80 authors), 1996, PASP. 108, 996
- (27) Luhman, K. L., & Rieke, G. H. 1998, ApJ, 497, 354
- (28) MacLow, M.M. & McCray, R. 1988, ApJ, 324, 776
- (29) Maoz, D., Barth, A.J., Sternberg, A., Filippenko, A.V., Ho, L.C., Macchetto, F.D., Rix, H.W., & Schneider, D.P. 1996, AJ, 111, 2248
- (30) Massey, P., & Hunter, D. 1998, ApJ, 493, 180
- (31) McCaughrean, M. J., & Stauffer, J. R. 1994, AJ, 108, 1382
- (32) McCray, R., & Kafatos, M. 1987, ApJ, 317, 190
- (33) McLaughlin, D.E., & Pudritz, R.E. 1996, ApJ, 457, 578
- (34) Meurer, G.R., Heckman, T.M., Leitherer, C., Kinney, A., Robert, C., & Garnett, D.R. 1995, AJ, 110, 2665
- (35) Paczyński, B. 1998, ApJ, 494, L45.
- (36) Prosser, C. F., Stauffer, J. R., Hartmann, L., Soderblom, D. R., Jones, B. F., Werner, M. W., & McCaughrean, M. J. 1994, ApJ, 421, 517
- (37) Rees, M.J. & Mészáros, P. 1998, ApJ, 496, L1
- (38) Richtler, T., 1993, in 11th Santa Cruz Summer Workshop, eds. Smith and Brodie, ASP Conf. Ser. 48
- (39) Tacconi, L.J., & Young, J.S. 1989, ApJS, 71, 455
- (40) Tenorio-Tagle, G., & Bodenheimer, P. 1988, ARAA, 26, 145
- (41) Trewhella, M. 1998, MNRAS, 297, 807
- (42) Tully, R. B. 1988, Nearby Galaxies Catalog, Cambridge: Cambridge Univ. Press.
- (43) van den Bergh, S. 1968, AJ, 73, 569,
- (44) van den Bergh, S. 1991, ApJ, 369, 1
- (45) van den Bergh, S. 1995, ApJ, 450, 27
- (46) van den Bergh, S., & Lafontaine, A. 1984, AJ, 89, 1822
- (47) VandenBerg, D.A., Stetson, P.B., & Bolte, M. 1996, ARAA, 34, 461
- (48) Weaver, R., McCray, R., Castor, J., Shapiro, P., & Moore, R. 1977, ApJ, 218, 377
- (49) Whitmore, B.C., & Schweizer, F. 1995, AJ, 109, 960