Detection of the first X-ray selected large AGN group
Abstract
We have examined the spatial distribution of 856 AGN detected by the ROSAT All-Sky Survey (RASS) using a direct search for structures with the minimal spanning tree. The AGNs were compiled from an area of 7000 deg2, in which optical identifications of RASS sources were made with the help of the digitized objective prism plates of the Hamburg Quasar Survey (HQS). Redshifts were taken from the literature or from own follow-up observations. The sample probes the spatial distribution at low redshifts, since the redshift distribution peaks at z 0.1. The application of the minimal spanning tree led to a 1.8 discovery of an AGN group with 7 members in a volume V 140 75 75 h-3Mpc3 in the Pisces constellation. With a mean redshift z=0.27 this group is only the third discovered group at redshifts z0.5. The RASS offers excellent possibilities to study large scale structure with AGNs at low redshifts, once these redshifts are determined.
keywords:
surveys – quasars: clustering – cosmology: large-scale structure of Universe.1 Introduction
Since first indications of cellular structures in the distribution of galaxies taken from the ’Second Reference Catalogue’ were found by Joeveer & Einasto (1978) more than 20 years ago the field of large-scale structure research has been developed rapidly. Already a few years later, due to the mapping of the nearby universe (z 0.1) (Gregory & Thompson 1978, Davis, Huchra & Latham 1983, De Lapparent, Geller & Huchra 1986), the last sceptics had to accept the existence of filamentary and cellular structures in the spatial distribution of the visible matter. Nowadays many elements in the network of visible matter like walls, knots and voids are well examined, using galaxies, clusters of galaxies and also superclusters. Later also Active Galactic Nuclei (AGN) were used to map large scale structures, beginning with the work by Osmer (1981). In spite of their lower space density in comparison to galaxies, significant clustering signals on small scales were detected, and also groups of them were discovered.

The clustering properties of AGNs are of great interest in cosmology because they allow the study of the evolution of structure over a range of redshifts not accessible with other objects so far. On small scales (20 h-1Mpc) evidence for AGN clustering seems to be well established (e.g. Shanks et al. 1987, Crampton et al. 1989, Iovino, Shaver & Christiani 1991, Mo & Fang 1993, Shanks & Boyle 1994, Georgantopoulos & Shanks 1994, Croom & Shanks 1996), but its cosmological evolution is discussed controversially (Iovino & Shaver 1988, Croom & Shanks 1996, Kundić 1997, Stephens et al. 1997, La Franca, Andreani & Christiani 1998), mainly because the clustering properties at low redshifts are not well determined. Sizeable low-redshift AGN samples require surveys over large areas of the sky and contain presently less than 200 objects (Boyle & Mo 1993, Georgantopoulos & Shanks 1994). The RASS will provide several thousand new low-redshift AGNs, allowing clustering studies in unprecedented details as soon as the redshifts will be available.
In addition to the clustering on small scale, AGN groups with considerably greater sizes were discovered. The first AGN group, detected by Webster (1982) in the CTIO survey, contains only 4 members at a redshift of z 0.37. The largest known group was found in one field of the CFHT grens survey by Crampton, Cowley & Hartwick (1989) comprising 23 AGNs. Clowes and Campusano (1991) searched in the direction of ESO/SERC field 927 and came upon an elongated group at z 1.3 with 13 members. Using the minimal spanning tree technique Graham, Clowes & Campusano (1995, hereafter GCC) analyzed several quasar surveys, in which they could confirm the three already known groups and could find another two. These new groups were detected in the Osmer & Hewett (1991) survey at z 1.9 containing 10 members and in the Christiani et al. (1989) and La Franca et al. (1992) survey at z 0.19 with seven members. The next successful search was done by Komberg, Kravtsov & Lukash (1996, hereafter KKT) carrying out a cluster analysis method known as the friend-of-friend technique (Einasto et al. 1994) in the Véron-Cetty & Véron Catalogue (1991). They found 11 new groups with at least 10 members each and redshifts greater than 0.6. The group discovered by Crampton et al. was confirmed. Finally Newman et al. (1997) discovered a group of 13 AGN at z 1.51 in the Chile-UK quasar survey. All in all we are aware of 17 groups of AGN having dimensions of 60 - 200 h-1Mpc. These sizes are significantly larger than the typical sizes ( 30h-1Mpc) of superclusters of galaxies. Most of them are too far away to allow presently studies of their spatial relation to the associated distribution of galaxies and clusters of galaxies, but it might be possible that they trace superstructures on scales h-1 Mpc (KKT). We present here the discovery of another group, which is the first X-ray selected group of AGN.
2 RASS AGN sample
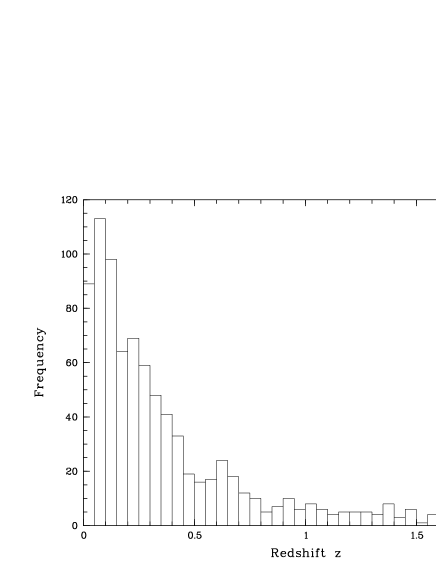
The ROSAT All-Sky Survey contains tens of thousands of AGN with z 0.5 and offers therefore a possibility to investigate the spatial distribution of AGN in the nearby universe. Close clusters of quasars could be searched for. Until the spring of 1996 identifications of RASS-AGN were carried out in 338 fields ( 7000 deg2) of the HQS (Bade et al. 1996). Roughly 3400 AGN candidates were available altogether ( 10 AGN/field). For studying the three dimensional distribution only objects with known redshifts could be used. For 367 AGN discovered by the RASS own follow-up spectroscopy was available. 489 RASS detected AGN from the literature were added, giving a total sample of 856 X-ray selected AGN. The surface density was 0.12 AGN/deg2, which is roughly of the same order as the surface densities of optical surveys for low redshifts. The advantage of the RASS is the much larger sky coverage than the one typically obtained for optical surveys. The distribution of the RASS-AGN on the northern sky is shown in Figure 1, the redshift distribution in Figure 2.
3 Statistical techniques
3.1 Cosmological model, distance determination
The evaluation of data using cosmological distances requires the declaration of a cosmological model. We adopted a flat universe with = 1, = 0.5, k = 0 and H0 = 100 km s-1 Mpc-1. AGN separations are expressed in comoving coordinates. The distance rp in comoving coordinates relative to the observer, the proper distance, is given by the equation of Mattig (1958):
The distance R between object 1 and object 2, which are separated by an angle (=arccos[cos()cos()]), is (Osmer 1981),
where
For = 0.5 and k = 0 we have D = 1, so that the distance R between two objects is the cosine rule of Euclidean geometry, i.e.,
3.2 Minimal Spanning Tree
To study the distribution of the RASS-AGN sample we used the minimal spanning tree (MST) technique which has widespread applications in many scientific fields. First algorithms were published by Kruskal (1956) and Prim (1957). For details on the historical evolution of the MST technique we refer to Graham and Hell (1985). GCC introduced a version of this technique into astronomy which is in particular useful for the purpose of detecting groups or clusters of objects in any spatial distribution. They discovered successfully two new groups of quasars, prompting us to apply this technique in our case. Crucial steps for this technique are the determination of a critical separation distance (Dussert et al. 1987, GCC) and of a significance level.
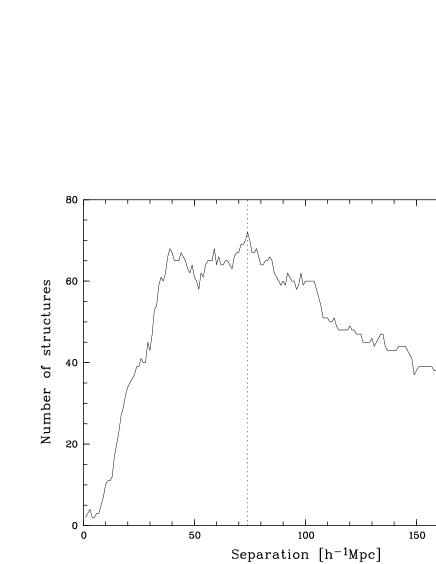
The separation distance of a given tree is the largest distance allowed to the nearest neighbor. A choice of this separation distance cuts the tree into connected structures with at least two members. The critical separation distance is the optimum value to search for superstructure candidates. Figure 3 shows the number of connected structures as function of the separation distance. In our case it is a distribution with an almost flat plateau between 40 and 100 h-1 Mpc. GCC used the maximum of this distribution as critical separation distance, as their distribution was signifcantly peaking at this value. This is not the case here, but we decided to use the maximum too, as it is located at 74 h-1 Mpc almost in the middle of the plateau. The choice of a smaller separation distance as the critical distance would result in smaller structures, probably substructures or cores of superstructures down to pairs of objects. In the opposite direction huge and elongated structures with extensions of a few hundreds of Mpc would be considered as structure candidates which are unlikely having a physical connection.
To find out, whether a structure is real one has to determine a significance level. Following GCC, we calculated the normalized mean m and the normalized standard deviation of the edge-lenghts of the MST for each superstructure candidate and compared them to the values ms and obtained from randomly generated samples. The edge-lengths are here the distances R between the AGNs. For this purpose 10 000 random samples were generated for each candidate, which have the same number of objects and are distributed within a volume of the same size. The volume is chosen as euclidean rectangular box with edges defined by the extremes of the z values of the candidate members. The significance level is then given by P = , where N is the number of trees with m m and .
4 Results
The application of the MST with a critical separation distance of 74 h-1 Mpc on the RASS AGN sample provided seven connected structures with at least five members each. These seven structures were adopted as superstructure candidates. The limit of at least five members was adopted, because the number of connected structures with less than five members increases very rapidly. The diameters of the superstructure candidates were of the order of (100 - 200) h-1Mpc, while typical angular diameters were 5∘ - 10∘. The comparison with random generated structures resulted in significance levels between 15 and 80 per cent for all but one candidate. This candidate (Table 1), which we call ’Pisces AGN Group’ has a significance level of P = 7.5 per cent. This first X-ray selected AGN group is located at , has 7 members at z = 0.27 0.03 and covers a volume of h-3Mpc3 (z,) (Fig. 4).
The identification of the ’Pisces AGN group’ within the MST does not depend strongly on the choice of the critical distance. The MST of the ’Pisces AGN Group’ contains six ’edge-lengths’ spanning a range from 32 to 53 h-1Mpc, while several group members have AGN neighbors with separations of 75–80 h-1Mpc. Therefore, over a wide range of choices for the critical distance (53–75 h-1Mpc) the AGN group would have been recognized, and only for a choice 53 h-1 Mpc the group would have fallen apart into subgroups. However, for critical distances 75 h-1 Mpc the group could have been missed.

| RXJ | z | B | Ref. | ||
|---|---|---|---|---|---|
| 23574+0457 | 23 57 28.8 | +04 58 11 | 0.285 | 16.9 | 1 |
| 00012+0728 | 00 01 18.1 | +07 28 26 | 0.270 | 17.9 | 1 |
| 00015+0529 | 00 01 33.4 | +05 29 19 | 0.251 | 16.9 | 1 |
| 00057+0203 | 00 05 47.5 | +02 02 59 | 0.234 | 16.5 | 2 |
| 00074+0241 | 00 07 27.1 | +02 41 12 | 0.300 | 17.6 | 2 |
| 00177+0136 | 00 17 45.8 | +01 36 20 | 0.236 | 18.2 | 2 |
| 00205+0228 | 00 20 33.2 | +02 28 52 | 0.256 | 17.9 | 2 |
References : 1) own follow-up spectroscopy, 2) Hewett et al. 1995
Shape and size of the group as well as the ability to detect further members in soft X-rays may depend on variations in sensitivity of the RASS across the region. While the exposure times are fairly homogeneous in the area shown in Fig 4, variations of the hydrogen column density NH by a factor of 5.6 are present. To visualize it, we overplotted in Fig 4 the NH distribution as taken from the Leiden/Dwingeloo Survey (Hartmann & Burton 1997). There is no obvious clustering of RASS AGN (candidates) in low NH regions nor do they avoid systematically regions of higher column density. Taking the NH variations into account we find that the RASS sensitivity varies at most by 18 per cent throughout the region. As the peak values of NH are restricted to rather small areas, we conclude that losses introduced by variations of the RASS sensitivity are negligible. Note that several dozen AGN candidates are already known in the Pisces region, which we could not take into account because of their unknown redshifts.
The ’Pisces AGN Group’ is only the third large AGN group discovered at z0.5, and the first found by an X-ray survey. The group contains AGNs with luminosities -22.5 MB -24.4 around the MB=-23.0 limit at which AGNs are separated into Seyfert galaxies and quasars. The other two low-redshift large agglomerations are the group of four AGNs at z=0.37 (-22.8 MB -24.4) analyzed by Webster [1982], and the group of seven Seyfert galaxies (-20.4 MB -22.3) at z=0.19 discovered by GCC. Their sizes of h-3 Mpc3 and h-3 Mpc3 are considerably smaller than the size of the ’Pisces AGN Group’ resulting in higher number densities for the former. The correponding numbers are 9 , 39 , and 1 h3 Mpc-3. With a level of 7.5 per cent the significance of the ’Pisces AGN Group’ is still lower than for the other groups (P 1 per cent) making a verification by completing the redshift determinations of the RASS-AGN candidates in this region (cf. Fig. 4) desirable. We note that at a distance of 10∘ ( 120 h-1 Mpc) of the group two AGNs are known within the groups redshift range. If further AGNs are found in the region in between, the ’Pisces AGN Group’ might be part of an even larger structure. Perhaps it is a node in a filamentary AGN superstructure extending north-west from the group (cf. Fig. 4).
5 Discussion
The discovery of the Pisces Quasar Cluster in our rather inhomogeneously distributed sample encourages to use the RASS for further studies of the large scale distribution of low-redshift AGN. The full information however will be available only after a complete determination of redshifts of all the RASS-AGN candidates, at least on a part of the sky. From the identification of RASS sources on Hamburg Schmidt Plates follows, that about 50 per cent of the sources with are AGNs (Bade et al. 1998), so that a surface density of 0.7 AGN/deg2 can be reached. Based on the distribution of redshifts of RASS-AGNs from Bade et al. [1995] (see also Fig. 2), the expected surface density for is still 0.5 AGN/deg2. Such a surface density has not been reached by any other non-optical survey in this redshift range so far. Only optical surveys may reach similar surface densities, but their areas searched are significantly smaller and their efficiency to find AGN are much lower. For example, the largest of them, the ’Large Bright Quasar Survey’ (LBQS), discovered 1055 quasars on an effective area of 454 deg2 (Hewett et al. 1995). Among them are 165 with low redshift (), giving a surface density of 0.36 AGN/deg2.
Today we consider the RASS as first choice, if searches for structures on large scales at low redshifts are attempted. At z = 0.3 a linear size of 120 h-1Mpc for example corresponds to an angle on the sky of 12∘ and at to 27∘. Optical surveys the size two or three times the LBQS would be required to be competitive. New AGN groups at low redshifts also provide a better chance to study the underlying matter distribution than at high redshifts, because the discovery of associated clusters of galaxies or even individual galaxies will be in reach of present day telescopes.
In any case, the nature of AGN groups is not yet well understood. When Webster [1982] found a very low probability that the z=0.37 group of quasars is a chance event, this group with a size of 100 h-1 Mpc was the largest known structure in the universe. Meanwhile further quasar groups have been found and evidence from other observations point out that large scale structure on scales of 100 h-1 Mpc might be common (Eisenstein et al. [1998] and references therein). Thus, the relation of quasar groups to the overall matter distribution on large scales is of eminent interest. Due to the large distances between group members and therefore because of the low volume density, it must be assumed that groups of AGN are not held together by gravitational forces. Presupposed that these structures are real, such groups could trace the structure of the universe at rather large scales, and are possibly embedded in the spatial distribution of galaxies and clusters of galaxies. Up to now their role in the network of galaxies is absolutely unknown.
KKT suggest that the Large Quasar Groups at higher z belong to concentrations of young galaxy clusters and evolve into the known superclusters of today. Quasar groups would point to sites of enhanced matter density. They derive a local spatial number density of superclusters of n 1.4 h3 Mpc-3 and predict about the same number of Large Quasar Groups at higher redshifts as they actually found in a number of homogeneous quasar surveys.
Their evolutionary scenario predicts several dozen new quasar groups in the volume accessible now with the help of the RASS. With an area of 7000 deg2 in which RASS identifications were available, and restricting to a redshift range 0.05z0.3, in which the RASS is most sensitive, N40 quasar groups with more than ten members are predicted. Thus 400 AGN belonging to quasar groups should be contained in this volume, making up 12 per cent of all RASS-AGN candidates in this area. As only part of the group members will actually be detected by the RASS, the finding of only one significant group (but having 7 members only) in our sample might not be at odds with the prediction. One reason for this disagreement could be that KKT did their estimation with objects taken from the Véron-Cetty & Véron Catalogue (1991) in which mostly optically selected AGNs are contained. X-ray selected AGNs, however, may have different clustering properties as optically selected AGNs. Carrera et al. (1998) presented a first clustering analysis of X-ray selected AGNs taken from the RIXOS Survey. They obtained limits on the AGN clustering estimating the correlation length , and their values showed consistency with the clustering of galaxies but not with clustering of optically selected AGNs in the way that X-ray selected AGNs are less clustered. Furthermore, follow-up spectroscopy of RASS-AGN candidates is rather incomplete. For only about one fourth of the AGN candidates the redshifts are known so far. These lacking redshifts will probably not explain the disagreement with the KKT hypothesis completely but at least some AGN groups might be found additionally.
Because of their high luminosity, quasars are excellent tools to study large scale structure beyond the limits of the deepest wide-angle galaxy redshift surveys. If quasar activity in galaxies is of too short duration or occur only in a small fraction of galaxies, their frequency might be too low for some of them to be present at a given time in a particular structure to form a detectable group. This bias factor might prevent that most of the underlying matter distribution is traced efficiently by AGN. To determine this bias factor the number density of AGN groups has to be known. An upper limit might be given by the number density of the superstructures in the local universe (KKT). A direct determination would be possible on the base of complete RASS-AGN redshift surveys, possibly starting with selected areas. For the beginning we started such a survey on 1600 deg2 in three areas on the northern sky (Engels et al. 1998; see also: www.hs.uni-hamburg.de/rosac.html).
6 Conclusions
We discovered the first RASS selected group of AGNs (Pisces AGN Group), showing that the RASS indeed can be used to study large scale structure formation at z 0.5 with AGNs. More groups should have been discovered, if such groups were associated with structures, which develop into the superclusters of galaxies in the local universe.
One can probably search efficiently for superstructures (groups, voids, filaments) in the distribution of RASS AGNs by simply increasing their surface density. This requires redshift determinations for the RASS AGN candidates, already pre-identified on Hamburg Schmidt plates. Follow-up spectroscopy of these candidates will be an efficient way to create homogeneous selected samples of low-redshift AGNs covering a large area on the sky. With such a sample it should be possible to determine the volume density of AGN groups. This will clarify, whether the AGN groups are isolated density peaks in the spatial distribution of AGNs or whether they belong to rather regular AGN superstructures. The Sloan Digital Sky Survey will reach the same range of redshifts with clusters of galaxies. A comparison of the distributions of these clusters of galaxies with the RASS AGNs should give hints whether both classes of objects trace the same large scale structures in the universe.
Acknowledgments
The Hamburg/RASS identification program is supported by the Deutsche Forschungsgemeinschaft (DFG) grant Re 352/22 and by the BMBF grant DARA 50 OR 96016. We acknowledge the support of this work by DFG grant En 176/13.
References
- [1995] Bade N., Fink H.H., Engels D., Voges W., Hagen H.-J., Wisotzki L., Reimers D., 1995, A&AS 110, 469
- [1996] Bade N., Engels D., Voges W., Reimers D., 1996, MPE-Report 263, 647
- [1998] Bade N., Engels D., Voges W., Beckmann V., Boller T., Cordis L., Dahlem M., Englhauser J., Molthagen K., Studt J., Reimers D., 1998, A&AS 127, 145
- [1993] Boyle B. J., Mo H. J. 1993, MNRAS, 260, 925
- [1998] Carrera F.J., Barcons X., Fabian A.C., Hasinger G., Mason K.O., McMahon P.G., Mittaz J.P.D., Page M.J., 1998, MNRAS 299, 229
- [1989] Christiani S., Barbieri C., Iovino A., La Franca F., Nota A., 1989, A&AS 77, 161
- [1991] Clowes R. G., Campusano L. E., 1991, MNRAS 249, 218
- [1989] Crampton D., Cowley A.P., Hartwick F.D.A., 1989, ApJ 345, 59
- [1996] Croom S.M., Shanks T., 1996, MNRAS 281, 893
- [1983] Davis M., Huchra J., Latham D., 1983, IAU Symposium 104, in The Early Evolution of the Universe
- [1986] De Lapparent V., Geller M., Huchra J., 1986, ApJ 302, L1
- [1987] Dussert C., Rasigni M., Palmari J., Rasigni G., Llebaria A., Marty F. 1987, J. theor. Biol., 125, 317
- [1994] Einasto M., Einasto J., Tago E., Dalton G. B., Andernach H., 1994, MNRAS 269, 301
- [1998] Eisenstein D.J., Hu W., Silk J., Szalay A.S., 1998, ApJ 494, L1
- [1998] Engels D., Tesch F., Ledoux C., Wei J., Ugryumov A., Valls-Gabaud D., Hu J., Voges W., 1998, MPE-Report in press (ph/9811182)
- [1994] Georgantopoulos I., Shanks T., 1994, MNRAS 271, 773
- [1985] Graham R. L., Hell P., 1985, Annals of the History of Computing, Volume 7, Number 1
- [1995] Graham M. J., Clowes R. G., Campusano L. E., 1995, MNRAS, 275, 790
- [1978] Gregory S.A., Thompson L.A., 1978, ApJ 222, 784
- [1995] Hartmann D., Burton W.B., 1997, Cambridge University Press 1997
- [1997] Hewett P.C., Foltz C.B., Chaffee F.H., 1995, AJ 109, 1498
- [1988] Iovino A., Shaver P., 1988, ApJ 330, L13
- [1991] Iovino A., Shaver P., Christiani S., 1991, in The Space Distribution of Quasars, ASP Conference Series, vol. 21, p. 202
- [1978] Joeveer M., Einasto J., 1978, IAU Symposium 79, in The Large-Scale Structure of the Universe, p. 241
- [1996] Komberg B.V., Kravtsov A.V., Lukash V.N., 1996, MNRAS 282, 713
- [1956] Kruskal J. B., 1956, Proc. Am. Math. Soc. 7, 48
- [1997] Kundić T., 1997, ApJ 482, 631
- [1992] La Franca F., Christiani S., Barbieri C., 1992, AJ 103, 1062
- [1998] La Franca F., Andreani P., Christiani S., 1998, ApJ 497, 529
- [1958] Mattig W., 1958, Astron. Nachr. 284, 109
- [1993] Mo H.J., Fang L.Z., 1993, ApJ 410, 493
- [1997] Newman P. R., Clowes R. G., Campusano L. E., Graham M. J., 1997, ph/9710281
- [1981] Osmer P.S., 1981, ApJ 247, 762
- [1991] Osmer P. S., Hewett P. C., 1991, ApJS 75, 273
- [1957] Prim R. C., 1957, Bell Sys. Tech. J. 36, 1389
- [1987] Shanks T., Fong R., Boyle B.J., Peterson B.A., 1987, MNRAS 227, 739
- [1994] Shanks T., Boyle B.J., 1994, MNRAS 271, 753
- [1997] Stephens A.W., Schneider D.P., Schmidt M., Gunn J.E., Weinberg D.H., 1997, AJ 114, 41
- [1991] Véron-Cetty M.-P., Véron P., 1991, A Catalogue of Quasars and Active Nuclei, ESO Sci. Rep. No. 10.
- [1982] Webster A., 1982, MNRAS 199, 683