Investigations of the Local Supercluster Velocity Field
Abstract
We have extended the discussion of Paper II (Ekholm et al. 1999a ) to cover also the backside of the Local Supercluster (LSC) by using 96 galaxies within from the adopted centre of LSC and with distance moduli from the direct B-band Tully-Fisher relation. In order to minimize the influence of the Malmquist bias we required and .
We found out that if this sample fails to follow the expected dynamical pattern from the Tolman-Bondi (TB) model. When we compared our results with the Virgo core galaxies given by Federspiel et al. (Federspiel98 (1998)) we were able to constrain the distance to Virgo: .
When analyzing the TB-behaviour of the sample as seen from the origin of the metric as well as that with distances from the extragalactic Cepheid -relation we found additional support to the estimate given in Paper II. Using a two-component mass-model we found a Virgo mass estimate – , where for . This estimate agrees with the conclusion in Paper I (Teerikorpi et al. Teerikorpi92 (1992)).
Our results indicate that the density distribution of luminous matter is shallower than that of the total gravitating matter when . The preferred exponent in the density power law, , agrees with recent theoretical work on the universal density profile of dark matter clustering in an Einstein-deSitter universe (Tittley & Couchman Tittley99 (1999)).
Key Words.:
Cosmology: theory – dark matter – distance scale – Galaxies: distances and redshifts – Galaxies: general – Galaxies: kinematics and dynamics1 Introduction
Study of the local extragalactic velocity field has a considerable history. Rubin (Rubin88 (1988)) pinpoints the beginning of the studies concerning deviations from the Hubble law to a paper of Gamow (Gamow46 (1946)) where Gamow asked if galaxies partake of a large-scale systematic rotation in addition to the Hubble expansion. The pioneer works by Rubin (Rubin51 (1951)) and Ogorodnikov (Ogorodnikov52 (1952)) gave evidence that the local extragalactic velocity field is neither linear nor isotropic. De Vaucouleurs (deVaucouleurs53 (1953)) then interpreted the distribution of bright galaxies and proposed rotation in terms of a flattened local supergalaxy. This short but remarkable paper did not yet refer to differential expansion, introduced by de Vaucouleurs (deVaucouleurs58 (1958)) as an explanation of the “north-south anisotropy” which he stated was first pointed out by Sandage (Humason et al. Humason56 (1956)). Differential expansion was a milder form of Hubble’s “the law of redshifts does not operate within the Local Group” and de Vaucouleurs pondered that “in condensed regions of space, such as groups or clusters, the expansion rate is greatly reduced…”. Though there was a period of debate on the importance of the kinematic effects claimed by de Vaucouleurs and even on the reality of the local supergalaxy (presently termed as the Local Supercluster, LSC), already for two decades the reality of the differential peculiar velocity field around the Virgo cluster has been generally accepted. However, its amplitude and such details as the deviation from spherical symmetry and possible rotational component, are still under discussion.
A theoretical line of research related to de Vaucouleurs’ differential expansion, has been motivated by the work on density perturbations in Friedmann cosmological models, resulting in infall models of matter (Silk Silk74 (1974)) which predict a connection between the infall peculiar velocity at the position of the Local Group towards the Virgo cluster and the density parameter of the Friedmann universe. Later on, Olson & Silk (Olson79 (1979)) further developed the formalism in a way which was found useful in Teerikorpi et al. (Teerikorpi92 (1992); hereafter Paper I). The linearized approximation of Peebles (Peebles76 (1976)) has been often used for describing the velocity field and for making routine corrections for systemic velocities.
Using Tolman-Bondi model (Tolman Tolman34 (1934), Bondi Bondi47 (1947)) Hoffman et al. (Hoffman80 (1980)) calculated the expected velocity dispersions along line-of-sight as a function of angular distance from a supercluster and applied the results to Virgo. They derived a gravitating mass of about inside the cone of . The Tolman-Bondi (TB) model is the simplest inhomogeneous solution to the Einstein’s field equations. It describes the time evolution of a spherically symmetric pressure-free dust universe in terms of comoving coordinates. For details of the TB-model cf. Ekholm et al. (1999a ; hereafter Paper II).
Then, following the course of Hoffman et al. (Hoffman80 (1980)), Tully & Shaya (Tully84 (1984)) calculated the expected run of radial velocity vs. distance at different angular distances from Virgo and for different (point) mass-age models. Comparison of such envelope curves with available galaxy data agreed with the point mass having roughly the value of Virgo’s virial mass () for reasonable Friedmann universe ages.
The Hubble diagram of Tully & Shaya contained a small number of galaxies and did not very well show the expected behaviour. With a larger sample of Tully-Fisher measured galaxies and attempting to take into account the Malmquist bias, Teerikorpi et al. (Teerikorpi92 (1992)) were able to put in evidence the expected features: an initial steeply rising tight velocity-distance relation, the local maximum in front of Virgo and the final ascending part of the relation, expected to approach asymptotically the undisturbed Hubble law. Looking from the Virgo centre the zero-velocity surface was clearly seen around . Using either a continuous mass model or a two-component model, the conclusions of Tully & Shaya (Tully84 (1984)) were generally confirmed and it was stated that “Various density distributions, constrained by the mass inside the Local Group distance (required to produce ), agree with the observations, but only if the mass within the Virgo region is close to or larger than the standard Virgo virial mass values. This is so independently of the value of , of the slope of the density distribution outside of Virgo, and of the values adopted for Virgo distance and velocity”.
It is the aim of the present paper to use the available sample of galaxies with more accurate distances from Cepheids and Tully-Fisher relation to study the virgocentric velocity field. In Paper II galaxies with Cepheid-distances were used to map the velocity field in front of Virgo, here we add galaxies with good Tully-Fisher distances in order to see both the frontside and backside behaviour and investigate how conclusions of Paper I should be modified in the light of new data. It should be emphasized that also our Tully-Fisher distances are now better, after a programme to study the slope and the Hubble type dependence of the zero-point (see Theureau et al. Theureau97 (1997)).
This paper is structured as follows. In Sect. 2 we shortly review the basics of the use of the direct Tully-Fisher relation, give the relation to be used and describe our sample and the restrictions put upon it. In Sect. 3 we examine our sample in terms of systemic velocity vs. distance diagrams and see which distance to Virgo will bring about best agreement between the TB-predictions and the observations. In Sect. 4 we try to answer the question whether we have actually found the Virgo cluster at the centre of the TB-metric. In Sect. 5 we re-examine our sample from a virgocentric viewpoint and compare our results from the TF-distances with the sample of galaxies with distances from the extragalactic Cepheid -relation. In Sect. 6 we shortly discuss the mass estimate and our density profile and, finally, in Sect. 7 we summarize our results with some conclusive remarks.
2 The sample based on direct B-band Tully-Fisher relation
The absolute magnitude and the logarithm of the maximum rotational velocity of a galaxy (for which also a shorthand is used) are related as:
| (1) |
The use of this kind of relation as a distance indicator was suggested by Gouguenheim (Gouguenheim69 (1969)). Eq. 1 is known as Tully-Fisher (TF) relation after Tully & Fisher (Tully77 (1977)).
It is nowadays widely acknowledged that the distance moduli inferred using Eq. 1 are underestimated because of selection effects in the sampling. We can see how this Malmquist bias affects the distance determination by considering the observed average absolute magnitude at each as a function of the true distance . The limit in apparent magnitude, , cuts off progressively more and more of the distribution function of for a constant . This means that the observed mean absolute magnitude is overestimated by the expectation value :
| (2) |
This inequality gives a practical measure of the Malmquist bias depending primarily on , , and . The equality holds only when the magnitude limit cuts the luminosity function insignificantly. For our present purposes it is also important to note that for luminous galaxies, which are also fast rotators (large ) the effect of the magnitude limit is felt at much larger distances than for intrinsically faint galaxies which rotate slowly. Hence by limiting to large values one expects to add to the sample galaxies which suffer very little from the Malmquist bias within a restricted distance range. For this kind of bias the review by Teerikorpi (Teerikorpi97 (1997)) suggested the name Malmquist bias of the kind, in order to make a difference from the classical Malmquist bias (of the kind).
Following Paper I we selected galaxies towards Virgo by requiring to be larger than . At the time Paper I was written this value was expected to bring about nearly unbiased TF distance moduli up to twice the Virgo distance. With the present, much deeper sample the limit chosen is much safer. Also, we allow an error in B-magnitude to be at maximum . We also require the axis ratio to be . Because the maximum amplitude of systemic velocities near Virgo can be quite large, we first restricted the velocities by , where is the angular distance from the adopted centre (, ) and the cosmological velocity of the centre is following Paper II . After this the derived TF-distances were restricted by .
| PGC | Name | |||||||||||
|---|---|---|---|---|---|---|---|---|---|---|---|---|
| (1) | (2) | (3) | (4) | (5) | (6) | (7) | (8) | (9) | (10) | (11) | (12) | (13) |
| 031883 | NGC 3338 | 230.33 | 57.02 | 5.3 | .21 | 11.02 | .12 | 2.268 | .033 | 1174 | 26.55 | 28.32 |
| 032007 | NGC 3351 | 233.95 | 56.37 | 2.5 | .23 | 9.97 | .13 | 2.166 | .027 | 640 | 26.18 | 11.52 |
| 032192 | NGC 3368 | 234.44 | 57.01 | 1.5 | .17 | 9.65 | .12 | 2.318 | .039 | 761 | 25.49 | 12.56 |
| 032306 | NGC 3389 | 233.72 | 57.74 | 6.1 | .35 | 11.52 | .10 | 2.116 | .029 | 1168 | 25.04 | 24.55 |
| 033166 | NGC 3486 | 202.08 | 65.49 | 5.1 | .14 | 10.55 | .08 | 2.125 | .050 | 632 | 26.83 | 15.54 |
| 033234 | NGC 3495 | 249.89 | 54.73 | 5.9 | .64 | 11.08 | .08 | 2.233 | .006 | 960 | 23.86 | 27.44 |
| 034612 | NGC 3623 | 241.33 | 64.22 | 1.6 | .61 | 9.36 | .16 | 2.395 | .005 | 676 | 17.60 | 13.51 |
| 034695 | NGC 3627 | 241.97 | 64.42 | 2.7 | .33 | 8.92 | .16 | 2.265 | .020 | 596 | 17.28 | 9.26 |
| 034697 | NGC 3628 | 240.86 | 64.78 | 3.3 | .59 | 9.19 | .16 | 2.349 | .009 | 719 | 17.28 | 13.14 |
| 034935 | NGC 3655 | 235.59 | 66.97 | 4.9 | .18 | 11.75 | .08 | 2.260 | .049 | 1364 | 17.02 | 38.80 |
| 035043 | NGC 3666 | 246.40 | 64.18 | 5.2 | .55 | 11.53 | .07 | 2.108 | .009 | 923 | 16.33 | 23.32 |
| 035088 | NGC 3672 | 270.42 | 47.55 | 4.7 | .31 | 11.28 | .16 | 2.328 | .018 | 1635 | 27.58 | 37.50 |
| 035224 | NGC 3684 | 235.98 | 68.07 | 4.7 | .18 | 11.51 | .10 | 2.120 | .032 | 1053 | 16.12 | 23.86 |
| 035268 | NGC 3686 | 235.71 | 68.28 | 4.5 | .10 | 11.51 | .11 | 2.126 | .055 | 1047 | 16.05 | 24.25 |
| 035294 | NGC 3689 | 212.72 | 71.32 | 5.8 | .19 | 12.43 | .09 | 2.209 | .040 | 2674 | 19.89 | 47.91 |
| 035405 | NGC 3701 | 217.69 | 71.30 | 3.8 | .32 | 12.73 | .08 | 2.120 | .021 | 2732 | 18.70 | 41.22 |
| 035440 | NGC 3705 | 252.02 | 63.79 | 2.3 | .38 | 11.10 | .13 | 2.232 | .022 | 871 | 15.28 | 19.44 |
| 036243 | NGC 3810 | 252.94 | 67.22 | 5.6 | .17 | 10.79 | .09 | 2.246 | .029 | 858 | 12.28 | 24.86 |
| 036266 | NGC 3813 | 176.19 | 72.42 | 4.4 | .29 | 11.52 | .07 | 2.202 | .029 | 1459 | 26.63 | 29.42 |
| 038031 | NGC 4045 | 275.98 | 62.27 | 1.7 | .20 | 12.27 | .11 | 2.249 | .051 | 1806 | 12.55 | 34.88 |
| 038150 | NGC 4062 | 185.26 | 78.65 | 5.6 | .35 | 11.04 | .07 | 2.189 | .011 | 743 | 20.48 | 23.94 |
| 038693 | NGC 4145 | 154.27 | 74.62 | 6.6 | .17 | 11.21 | .08 | 2.106 | .034 | 1032 | 27.89 | 15.65 |
| 038749 | NGC 4152 | 260.39 | 75.42 | 4.9 | .10 | 12.24 | .16 | 2.194 | .099 | 2059 | 6.15 | 40.73 |
| 038916 | IC 769 | 269.75 | 72.44 | 3.8 | .17 | 12.82 | .11 | 2.180 | .046 | 2093 | 4.53 | 50.47 |
| 038943 | NGC | 271.86 | 71.37 | 6.6 | .46 | 10.86 | .09 | 2.101 | .037 | 245 | 4.73 | 13.14 |
| 038964 | NGC 4180 | 276.79 | 67.94 | 3.2 | .45 | 12.45 | .18 | 2.301 | .018 | 1935 | 6.95 | 51.85 |
| 039025 | NGC | 268.37 | 73.72 | 6.1 | .17 | 11.97 | .19 | 2.221 | .086 | 1994 | 4.34 | 40.03 |
| 039028 | NGC | 265.44 | 74.96 | 2.4 | .60 | 9.98 | .09 | 2.377 | .005 | -253 | 4.89 | 17.13 |
| 039040 | NGC | 268.91 | 73.51 | 4.4 | .32 | 12.43 | .09 | 2.251 | .018 | 2355 | 4.26 | 51.02 |
| 039152 | IC | 268.20 | 74.39 | 5.0 | .74 | 12.90 | .08 | 2.136 | .017 | 2201 | 4.23 | 47.25 |
| 039224 | NGC | 268.89 | 74.36 | 5.6 | .20 | 11.21 | .15 | 2.175 | .034 | -198 | 4.05 | 24.93 |
| 039246 | NGC | 270.45 | 73.74 | 2.2 | .65 | 9.96 | .15 | 2.410 | .005 | 11 | 3.78 | 18.54 |
| 039308 | NGC | 270.54 | 73.93 | 6.0 | .79 | 12.30 | .09 | 2.146 | .007 | 111 | 3.70 | 38.11 |
| 039389 | NGC 4235 | 279.18 | 68.47 | 1.0 | .65 | 11.88 | .09 | 2.153 | .009 | 2263 | 6.22 | 22.53 |
| 039393 | NGC | 267.21 | 75.76 | 4.9 | .19 | 11.92 | .13 | 2.158 | .034 | 757 | 4.47 | 31.92 |
| 039656 | NGC 4260 | 281.56 | 67.63 | 1.0 | .30 | 12.17 | .06 | 2.388 | .024 | 1695 | 6.91 | 48.36 |
| 039724 | NGC 4274 | 191.40 | 82.62 | 1.4 | .44 | 10.58 | .17 | 2.357 | .015 | 891 | 17.43 | 21.40 |
| 039738 | NGC 4273 | 282.53 | 66.96 | 5.5 | .21 | 11.74 | .09 | 2.243 | .031 | 2228 | 7.56 | 38.19 |
| 039886 | NGC 4289 | 284.38 | 65.49 | 4.9 | 1.00 | 12.72 | .09 | 2.232 | .010 | 2381 | 9.01 | 56.26 |
| 039907 | NGC 4293 | 262.85 | 78.82 | 1.3 | .28 | 10.70 | .13 | 2.229 | .022 | 839 | 6.45 | 16.04 |
| 039974 | NGC | 272.52 | 75.68 | 5.3 | .81 | 10.96 | .14 | 2.236 | .009 | 1005 | 3.17 | 25.28 |
| 040033 | NGC | 280.58 | 70.63 | 3.1 | .66 | 11.65 | .07 | 2.253 | .012 | 956 | 4.00 | 31.54 |
| 040119 | NGC | 280.72 | 70.95 | 4.7 | .70 | 12.27 | .08 | 2.159 | .012 | 1119 | 3.68 | 37.60 |
| 040153 | NGC | 271.14 | 76.90 | 4.6 | .09 | 9.65 | .11 | 2.277 | .083 | 1483 | 3.97 | 15.44 |
| 040251 | NGC | 283.56 | 68.77 | 2.4 | .53 | 12.26 | .18 | 2.221 | .009 | 867 | 5.73 | 32.21 |
| 040284 | NGC 4348 | 289.61 | 58.71 | 4.2 | .66 | 11.94 | .15 | 2.244 | .007 | 1815 | 15.93 | 39.95 |
| 040507 | NGC | 281.94 | 71.82 | 2.6 | .24 | 12.03 | .14 | 2.175 | .045 | 839 | 2.75 | 30.48 |
| 040566 | IC 3322A16 | 284.72 | 69.17 | 6.0 | .89 | 11.87 | .14 | 2.115 | .012 | 852 | 5.33 | 28.77 |
| 040581 | NGC | 279.12 | 74.34 | 2.9 | .55 | 10.76 | .11 | 2.329 | .006 | 2401 | 1.32 | 25.67 |
| 040621 | UGC 7522 | 287.43 | 65.53 | 5.3 | .95 | 12.75 | .12 | 2.161 | .013 | 1265 | 9.04 | 47.15 |
| 040644 | NGC | 278.79 | 74.78 | 4.4 | .51 | 11.54 | .19 | 2.152 | .008 | 120 | 1.41 | 25.97 |
| 040692 | NGC 4414 | 174.55 | 83.18 | 5.1 | .23 | 10.28 | .11 | 2.342 | .033 | 694 | 18.87 | 24.56 |
| 040914 | NGC | 280.35 | 74.83 | 2.9 | .47 | 10.08 | .16 | 2.231 | .018 | -36 | 1.02 | 14.43 |
| 040988 | NGC 4448 | 195.35 | 84.67 | 2.0 | .43 | 11.22 | .12 | 2.266 | .009 | 618 | 16.25 | 22.51 |
| PGC | Name | |||||||||||
|---|---|---|---|---|---|---|---|---|---|---|---|---|
| (1) | (2) | (3) | (4) | (5) | (6) | (7) | (8) | (9) | (10) | (11) | (12) | (13) |
| 041024 | NGC | 273.91 | 78.64 | 1.8 | .12 | 10.48 | .07 | 2.413 | .047 | 1862 | 4.74 | 23.75 |
| 041317 | NGC 4480 | 289.67 | 66.58 | 5.2 | .31 | 12.36 | .06 | 2.226 | .017 | 2288 | 8.13 | 46.90 |
| 041517 | NGC | 282.33 | 76.51 | 4.1 | .27 | 9.56 | .12 | 2.476 | .018 | 2172 | 2.05 | 24.87 |
| 041719 | NGC | 289.17 | 71.05 | 6.3 | .09 | 11.96 | .06 | 2.146 | .189 | 1087 | 3.77 | 32.59 |
| 041789 | NGC 4527 | 292.60 | 65.18 | 3.4 | .41 | 10.47 | .13 | 2.264 | .014 | 1571 | 9.76 | 18.86 |
| 041812 | NGC | 290.07 | 70.64 | 4.8 | .12 | 10.19 | .16 | 2.311 | .062 | 1821 | 4.26 | 21.69 |
| 041934 | NGC | 285.70 | 76.83 | 2.8 | .08 | 10.58 | .11 | 2.291 | .078 | 379 | 2.37 | 21.34 |
| 042038 | NGC 4565 | 230.77 | 86.44 | 3.6 | .86 | 8.90 | .19 | 2.414 | .004 | 1181 | 13.66 | 15.54 |
| 042064 | NGC 4567 | 289.78 | 73.75 | 5.2 | .14 | 11.58 | .09 | 2.243 | .070 | 2145 | 1.75 | 34.28 |
| 042069 | NGC | 289.82 | 73.73 | 5.2 | .34 | 10.82 | .09 | 2.274 | .010 | 2134 | 1.77 | 26.25 |
| 042089 | NGC | 288.47 | 75.62 | 2.7 | .35 | 9.51 | .17 | 2.369 | .021 | -355 | 1.61 | 16.07 |
| 042168 | NGC | 290.40 | 74.35 | 2.2 | .08 | 10.12 | .09 | 2.471 | .047 | 1399 | 1.72 | 23.50 |
| 042319 | NGC 4591 | 294.54 | 68.68 | 3.0 | .30 | 13.26 | .12 | 2.200 | .027 | 2282 | 6.68 | 57.43 |
| 042476 | NGC 4602 | 297.89 | 57.63 | 5.1 | .47 | 10.99 | .17 | 2.309 | .008 | 2351 | 17.68 | 31.18 |
| 042741 | NGC | 294.30 | 75.98 | 3.3 | .19 | 11.68 | .07 | 2.254 | .052 | 888 | 3.01 | 32.06 |
| 042791 | NGC 4642 | 298.57 | 62.16 | 4.6 | .53 | 12.32 | .11 | 2.132 | .050 | 2476 | 13.37 | 35.79 |
| 042816 | NGC | 295.75 | 74.34 | 5.4 | .08 | 11.53 | .14 | 2.127 | .048 | 1298 | 3.15 | 24.54 |
| 042833 | NGC | 293.07 | 79.12 | 5.1 | .18 | 10.81 | .10 | 2.358 | .031 | 711 | 5.05 | 32.73 |
| 042857 | NGC | 295.43 | 75.89 | 5.4 | .22 | 10.46 | .10 | 2.218 | .037 | 926 | 3.23 | 19.14 |
| 043147 | NGC 4682 | 301.23 | 52.79 | 4.4 | .32 | 12.37 | .10 | 2.191 | .018 | 2126 | 22.81 | 42.25 |
| 043186 | NGC | 299.08 | 76.61 | 5.0 | .08 | 11.20 | .10 | 2.148 | .073 | 1508 | 4.30 | 22.30 |
| 043254 | NGC 4698 | 300.57 | 71.35 | 1.4 | .16 | 11.00 | .12 | 2.404 | .054 | 872 | 5.77 | 29.45 |
| 043331 | NGC 4701 | 301.54 | 66.25 | 4.6 | .07 | 12.41 | .08 | 2.106 | .127 | 571 | 10.05 | 34.79 |
| 043451 | NGC 4725 | 295.09 | 88.36 | 2.1 | .18 | 9.57 | .15 | 2.380 | .042 | 1160 | 13.89 | 14.29 |
| 043601 | NGC | 303.39 | 74.95 | 3.9 | .53 | 12.29 | .06 | 2.208 | .020 | 1667 | 5.10 | 42.62 |
| 043784 | NGC 4771 | 304.03 | 64.14 | 4.9 | .65 | 11.59 | .13 | 2.109 | .013 | 969 | 12.41 | 24.04 |
| 043798 | NGC 4772 | 304.15 | 65.03 | 1.0 | .23 | 11.52 | .15 | 2.394 | .041 | 884 | 11.63 | 36.43 |
| 043939 | NGC 4793 | 101.55 | 88.05 | 5.4 | .27 | 11.57 | .12 | 2.248 | .030 | 2466 | 17.45 | 34.58 |
| 044191 | NGC 4818 | 305.21 | 54.32 | 2.8 | .43 | 11.18 | .10 | 2.136 | .017 | 867 | 21.87 | 18.56 |
| 044254 | UGC 8067 | 305.92 | 61.13 | 4.4 | .73 | 12.75 | .10 | 2.154 | .017 | 2668 | 15.51 | 45.58 |
| 044392 | NGC 4845 | 306.74 | 64.40 | 2.3 | .61 | 11.12 | .16 | 2.292 | .007 | 1073 | 12.70 | 23.05 |
| 045170 | NGC 4939 | 308.10 | 52.40 | 3.8 | .36 | 11.07 | .10 | 2.369 | .020 | 2908 | 24.17 | 37.42 |
| 045311 | NGC 4961 | 44.51 | 86.76 | 5.8 | .17 | 13.41 | .15 | 2.118 | .043 | 2513 | 17.37 | 58.94 |
| 045643 | NGC 4995 | 310.78 | 54.76 | 3.0 | .16 | 11.42 | .12 | 2.350 | .041 | 1578 | 22.38 | 36.80 |
| 045749 | NGC 5005 | 101.61 | 79.25 | 3.0 | .30 | 9.92 | .12 | 2.460 | .009 | 967 | 26.24 | 24.77 |
| 045948 | NGC 5033 | 98.06 | 79.45 | 5.1 | .42 | 9.76 | .16 | 2.341 | .010 | 896 | 26.02 | 19.28 |
| 046441 | NGC 5073 | 312.94 | 47.48 | 3.7 | .75 | 12.08 | .18 | 2.281 | .014 | 2533 | 29.74 | 47.06 |
| 046671 | NGC 5112 | 96.06 | 76.76 | 5.3 | .13 | 12.12 | .09 | 2.112 | .067 | 1003 | 28.67 | 30.93 |
| 048130 | NGC 5248 | 335.93 | 68.75 | 4.1 | .11 | 10.44 | .18 | 2.283 | .083 | 1048 | 16.70 | 22.23 |
| 049555 | NGC 5364 | 340.71 | 63.03 | 5.4 | .18 | 10.56 | .19 | 2.239 | .043 | 1128 | 22.28 | 21.20 |
| 050782 | NGC 5506 | 339.15 | 53.81 | 3.7 | .57 | 11.65 | .19 | 2.174 | .015 | 1679 | 29.79 | 28.98 |
| 051233 | NGC 5566 | 349.27 | 58.56 | 1.3 | .46 | 10.66 | .18 | 2.378 | .040 | 1408 | 28.30 | 23.49 |
With these criteria we found 96 galaxies within tabulated in Table 1, where in columns (1) and (2) we give the PGC number and name (the superscript after some galaxies will be explained in Sect. 4). In columns (3) and (4) the galactic coordinates in degrees are given. In column (5) we give the morphological type code and in column (6) we give the logarithm of the axis ratio at , . The total B-magnitude corrected according to RC3 (de Vaucouleurs et al. deVaucouleurs91 (1991))111Except for galactic extinction which is adopted from RC2 (de Vaucouleurs et al. deVaucouleurs76 (1976)) and the corresponding weighted mean error are given in columns (7) and (8). In columns (9) and (10) we give the logarithm of the maximum rotational velocity with the weighted mean error. In column (11) we give the observed velocity by which – as in Paper II – we mean the mean observed heliocentric velocity corrected to the centroid of the Local Group according to Yahil et al. (Yahil77 (1977)). Finally, in columns (12) and (13) we have the angular distance in degrees between a galaxy and the centre and the distance in Mpc from us calculated using the direct TF-relation given below. The data in columns (1) – (11) were extracted from the Lyon-Meudon extragalactic database LEDA.
Our direct TF-parameters for the B-band magnitudes were taken from Theureau et al. (Theureau97 (1997)). The slope for the relation is and the zero-points corrected for the type-effect are given in Table 2.
| Hubble type code | zero-point |
|---|---|
| 1,2 | |
| 3 | |
| 4 | |
| 5 | |
| 6 | |
| 7,8 |
The calibration of the zero-points was based on a sample of galaxies with Cepheid distances given in Table 1 in Theureau et al. (Theureau97 (1997)). This calibration corresponded to a Hubble constant .
Finally we comment on our notation on velocities. We use systemic velocity in the same sense as in Paper II, i.e. the systemic velocity is a combination of the cosmological velocity and the velocity induced by Virgo with the assumption that the virgocentric motions dominate. When we refer to observed systemic velocity we call it and when to model prediction, . If we make no distinction, we use .
3 The vs. diagram for the TF-sample
In Paper II we found a TB-solution using a simple density law , which fitted data quite well. Here is the distance from the origin of the TB-metric, is the density gradient and the density contrast. Because an Einstein-deSitter universe was assumed, the background density equals the critical cosmological density, . The relevant quantity, the mass within a radius , the radius in units of Virgo distance, was expressed as (cf. Eq. 9 in Paper II). Here is the mass excess within a sphere having a radius of one Virgo distance.
Unfortunately, the sample of galaxies with distances from the extragalactic Cepheid -relation did not reach well enough behind the LSC. Our present sample is clearly deep enough to reveal the backside infall signal. In Paper I it was well seen how in the front the differences between different TB-models were not large, in contrast to the background, where the model predictions progressively deviate from each other.
In the formalism developed by Ekholm (Ekholm96 (1996)) and adopted in Paper II, the quantity given by Eq. 8 in Paper II, , which is needed for solving the development angle, is no longer an explicit function of . There are – however – still rather many free parameters, which we shortly discuss below:
-
1.
The deceleration parameter . In Paper II we considered given, restricting our analysis to the Einstein-deSitter universe (). In Paper I it was concluded that has a minor influence on the vs. curves and on the Virgo mass (though it has a large effect on total mass inside the LG sphere).
-
2.
The density gradient and the relative mass excess at , . We remind that in our formalism does not depend on but only on the amount by which the LG’s expansion velocity with respect to centre of LSC has slowed down. In our two-component model (Sect. 5) will depend also on .
-
3.
The velocities , and . As in Papers I and II, we presume Virgo to be at rest with cosmological background: . We feel that our choices for the infall velocity of the Local Group and for the observed velocity of Virgo are relatively safe.
We would also like to remind that our solutions in Paper II had an implicit dependence on the Hubble constant , because we fixed our distance to Virgo kinematically from by adopting . This global value was based on SNe Ia (Lanoix Lanoix99 (1999)) and agrees also with the more local results of the KLUN (Kinematics of the Local Universe) project (Theureau et al. Theureau97 (1997); Ekholm et al. 1999b ) and with the findings of Federspiel et al. (Federspiel98 (1998)). Here we allow the distance of Virgo, or equivalently the Hubble constant , vary keeping the cosmological velocity of Virgo fixed. This choice is justified because even though the estimates for have converged to the reported errors are not small and the different values are still scattered (-).
In this section we examine how well the present TB-sample agrees with the Model 1 of Paper II, which constitutes of a density excess embedded in a FRW universe with and . The model parameters are and , which predict for the Virgo cluster () a mass , where is the virial mass of the Virgo cluster derived by Tully & Shaya (Tully84 (1984)) . Because of fixed infall velocity of the Local Group (LG) into the centre of LSC and because was fixed from external considerations the distance to centre of LSC became to be . For further details of the TB-model adopted cf. Paper II. Additional discussion can be found in Paper I, Ekholm & Teerikorpi (Ekholm94 (1994)) and Ekholm (Ekholm96 (1996)).
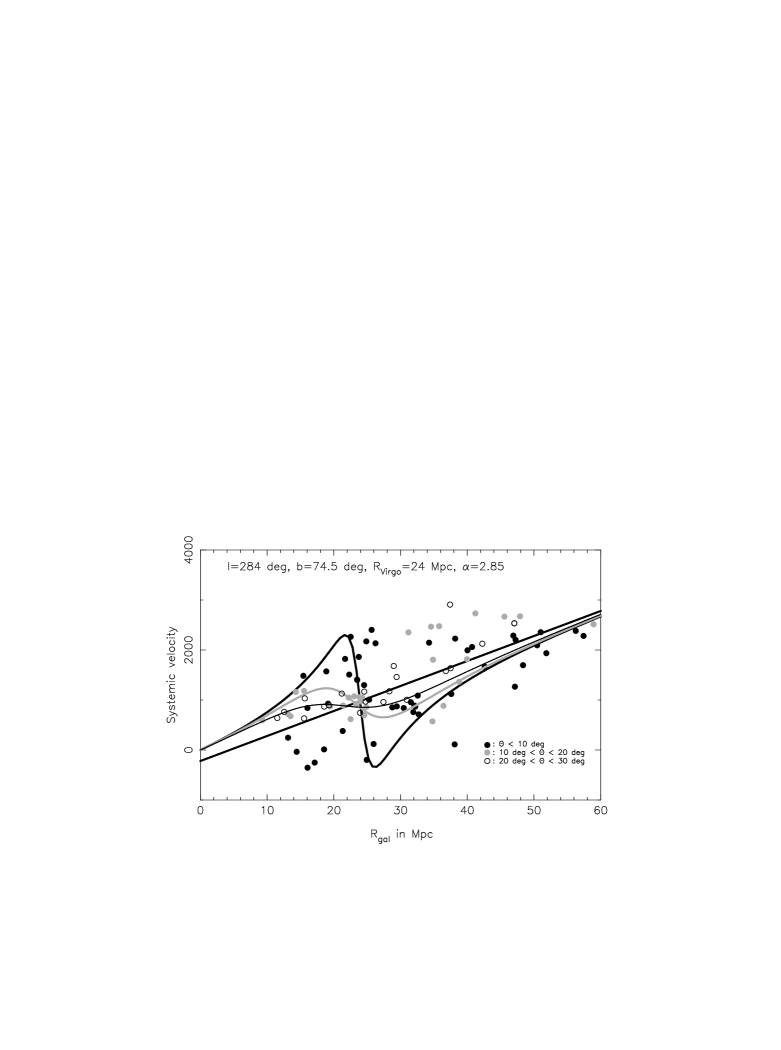
The observed systemic velocity vs. distance diagrams are presented in Figs. 1-5. In the first four figures galaxies belonging to a cone are shown for different angular intervals: galaxies having are shown as black bullets, galaxies having as grey bullets and galaxies having as circles. The TB-curves are given for the mean angular distance, , for each angular interval as thick black curve for , as thick grey curve for and as thin black curve for . Comparison between the data and the mean predictions were made for different presumed distances to the centre of LSC: (Fig. 1), (Fig. 2), (Fig. 3) and (Fig. 4). We remind that our model is formulated in terms of the relative distance . So the TB-curves show different behaviour depending on the normalization.
The thick black line in each figure corresponds to the Hubble law based on , , and , respectively. The line is drawn through the centre of LSC in order to emphasize our basic assumption that the centre is at rest with respect to the cosmological background. This also allows one to appreciate the infall of the Local Group with an assumed velocity .
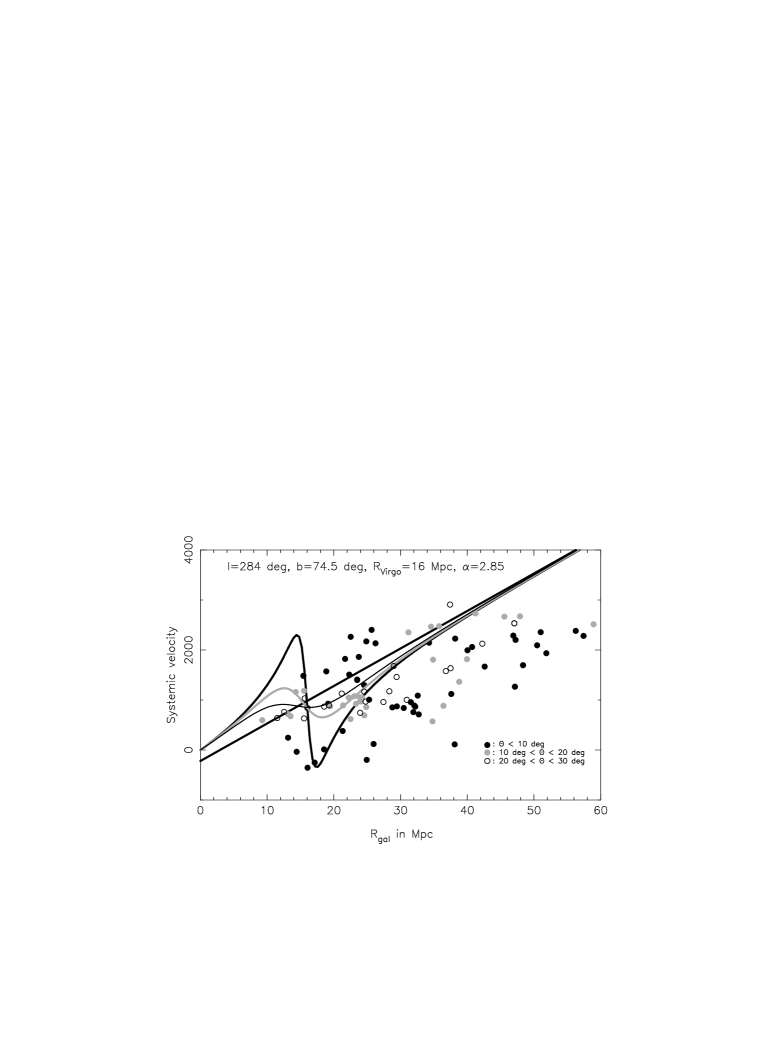
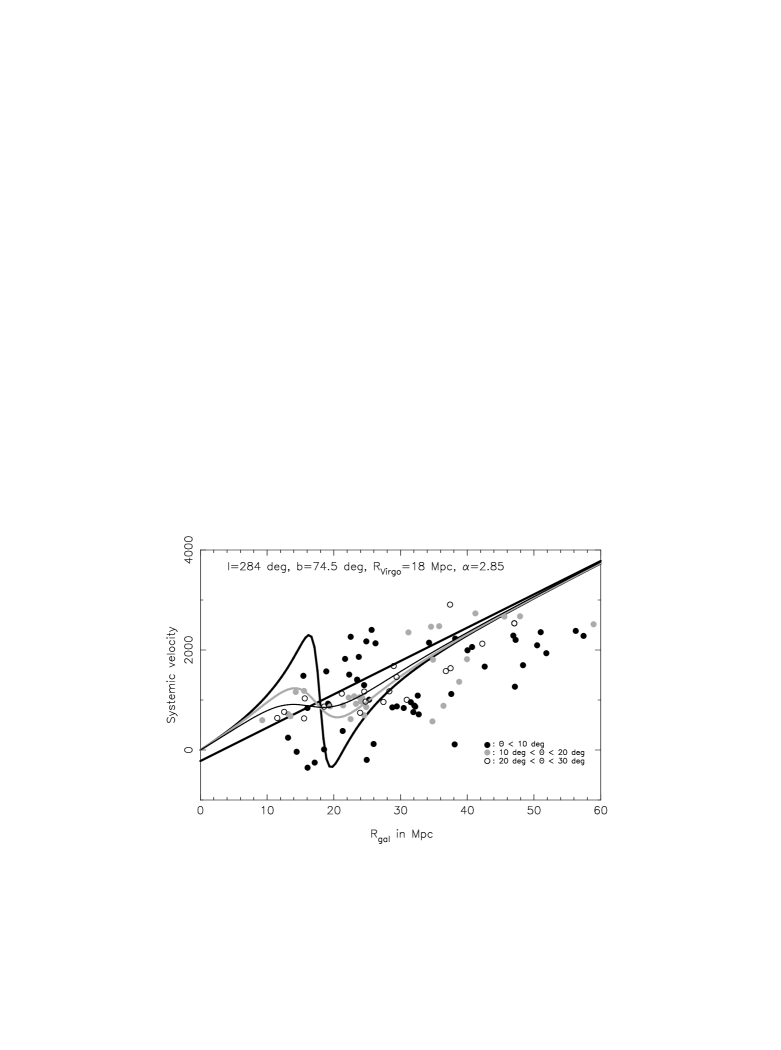
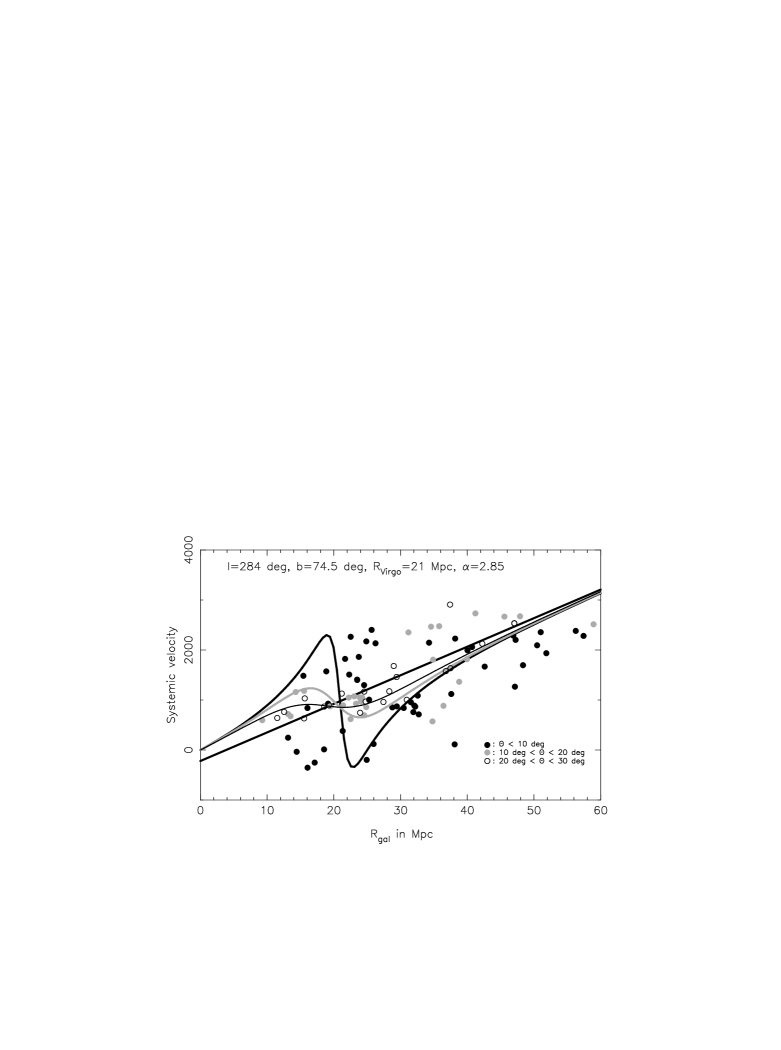
Figs. 1 and 2 immediately reveal that the shorter distances are not acceptable because the background galaxies fall far below the expected curves. Correction for any residual Malmquist bias would make situation even worse. Neither is , the distance found favourable in Paper II, totally satisfying. Although the clump of galaxies at and in Fig. 3 follow the prediction as some other galaxies, the maximum of the velocity amplitude is clearly behind the presumed centre.

This led us to test a longer distance to Virgo. The result is shown in Fig. 4. It is rather remarkable that such a distance gives better fit than the shorter ones. On the other hand together with the adopted cosmological velocity bring about . Such a small value has for decades been advocated by Sandage and his collaborators and is within the error bars of our determinations (Theureau et al. Theureau97 (1997); Ekholm et al. 1999b ) as well. It is encouraging that galaxies outside the cone follow well the Hubble law for this . Virgo has only a weak influence on them, and if the Malmquist bias is present these galaxies should predict larger value for . The dashed line in Fig. 5 is the Hubble law for . It is clearly an upper limit thus giving us a lower limit for the distance to Virgo: .
4 Have we found the true TB signature of Virgo?
So far we have studied the vs. diagram in a simple way by moving the curves for the TB-solution by choosing different normalizing distances to Virgo. The best agreement with the maximum observed amplitude and the curves was found at a rather large distance, namely . Such a long distance leads one to ask whether we have actually found Virgo. We examine this question by comparing our sample given in Table 1 with the sample given by Federspiel et al. (Federspiel98 (1998)) from which they found . We found 33 galaxies in common when requiring . We present these galaxies in Fig. 6. For an easy reference each galaxy is assigned a number given also as a superscript after the name in Table 1.
We give each galaxy a symbol following the classification of Federspiel et al. (Federspiel98 (1998)). Following Binggeli et al. (Binggeli93 (1993)) galaxies were divided into subgroup “big A” for galaxies close to M87 (‘A’) and into “B” for galaxies within of M49 (‘B’). They also examined whether a galaxy is within the X-ray isophote based on ROSAT measurements of diffuse X-ray emission of hot gas in the Virgo cluster (Böhringer et al. Bohringer94 (1994)) (‘A,X’, ‘B,X’). Galaxies belonging to subgroup A and within the X-ray contour are labelled in Fig. 6 as bullets and outside the contour with an open circle. Similarly, galaxies in subgroup B are labelled with a filled or open triangle. Federspiel et al. also listed galaxies within the X-ray contour but not classified as members of A or B. The galaxies are marked with a filled square. They also included in their Table 3 some galaxies which fall outside A and B and the X-ray contour (we label them with an open square).
We also give an error estimate for the TF-distance for each galaxy calculated from the error in the distance modulus:
| (3) |
The error in the corrected total B-band magnitude is taken from column (8) in our Table 1 and the intrinsic dispersion of the absolute magnitude for each , is estimated to be .
The straight solid line is the Hubble law for shifted downwards by in order to make the line go through the centre at which is presumed to be at rest with respect to the cosmological background. The TB-curves are given for (thick black curve), (thick grey curve) and (thin black curve), respectively.
To begin with, there are 22 galaxies (67 %) which agree with the TB-solution within in . Only four galaxies (1,3,19,26; 12 %) 222Also NGC 4216 (7) should probably be counted to this group, because it differs by and clearly belongs to the same substructure as the other four disagreeing galaxies. In other words, 15 % of the sample does not agree with the model within . do not agree with the model within . Though we have not reached the traditional 95 % confidence level, the agreement is, at the statistical level found, satisfying enough. Furthermore, we find in the range nine galaxies out of which seven were classified by Federspiel et al. (Federspiel98 (1998)) as ‘A,X’ galaxies hence presumably lying in the very core of Virgo. The remaining two galaxies are ‘A’ galaxies. In the range we find only three ‘A,X’ galaxies and one ‘A’ galaxy. Federspiel et al. (Federspiel98 (1998)) following Guhathakurta et al. (Guhathakurta88 (1988)) listed five galaxies (17, 18, 19, 20 and 26 in Table 1) as HI-deficient. If these galaxies are removed one finds four ‘A,X’ and two ‘A’ galaxies in the range , and one ‘A,X’ and one ‘A’ galaxy in the range . The numbers are still clearly more favorable for a long distance to Virgo.
Four galaxies in this sample have also distances from the extragalactic -relation (Lanoix Lanoix99 (1999); Lanoix et al. 1999a , 1999b , 1999c ). These galaxies are NGC 4321 (13) with , NGC 4535 (23) with , NGC 4548 (24) with and NGC 4639 (28) with . These positions are shown as diamonds in Fig. 6. The mean distance to Virgo using the ‘A,X’ galaxies 13, 21, 24, 27, 28, 29 and 32 (i.e. the HI-deficient galaxies excluded) with TF-distance moduli is or and when using the -distance moduli available for the three galaxies (13, 24 and 28) or . The difference is not large, and in both cases these Virgo core galaxies predict a distance .
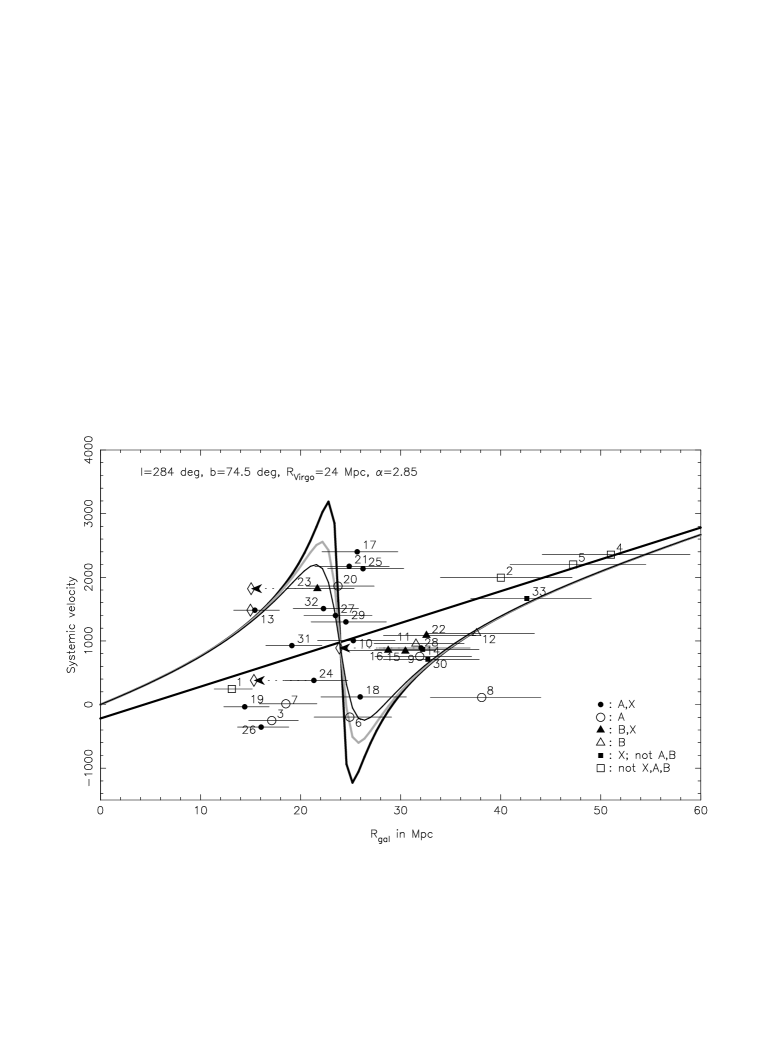
We find also some other interesting features in Fig. 6. There are three galaxies (15, 16 and 22) which Federspiel et al. (Federspiel98 (1998)) classified as ‘B,X’ and two (11,12) classified as ‘B’. Together they form a clearly distinguishable substructure. It is the region D of Paper I, there interpreted as a tight background concentration. The mean distance for ‘B,X’ galaxies is corresponding to . This region is more distant than our presumed centre. We find this result satisfying because Federspiel et al. (Federspiel98 (1998)) estimated that the subgroup ‘B’ (region D in Paper I) is, on average, about farther distance than subgroup ‘A’. That our sample brings about approximately the correct relative distance between these subgroups lends additional credence to the distance estimation made in the previous section.
The region B of Paper I described as an expanding component is also conspicuously present in Fig. 6 333 That such galaxies with negative velocity may be within a small angular distance from the Virgo cluster and still be well in the foreground was explained in Paper I as due to two things: 1) The expansion velocity must decrease away from the massive Virgo, and 2) because of projection effects , the largest negative velocities, belonging to galaxies at small distances from Virgo, are seen close to the Virgo direction.. There is, however, no clear trace of the region C of Paper I (galaxies of high velocities but lying behind the centre; cf. Fig. 8 in Paper I) unless NGC 4568 (25) actually lies at the same distance as NGC 4567 (). It should be remembered that NGC 4567/8 is classified as an interacting pair. There are, however, in Fig. 4 many galaxies at larger angular distances around NGC 4567. It is possible that they form the region C. In Paper I region C was divided into two subregions, C1 and C2. C1 was interpreted as the symmetrical counterpart to the region B (these galaxies behind Virgo are expanding away from it) and C2 was considered as a background contamination. Galaxies in region A (galaxies with high velocities lying in front of the centre) were proposed in Paper I to be presently falling into Virgo. As regards regions A and C1 it is now easy to understand that they are not separate regions but reflect the behaviour of the TB-curve: A is on the rising part and C1 on the declining part of the curve in front of the structure.
We conclude that from the expected distance-velocity pattern we have accumulated quite convincing evidence for a claim that the distance to the Virgo cluster is – or in terms of the distance modulus – . is within uncertainty of our TF-sample.
5 The velocity field as seen from the centre of LSC
In the first part of this paper we have approached the problem of the dynamical behaviour of LSC in a more or less qualitative manner. We now proceed to present the results in a physically more relevant manner. The main difficulty in the presentation used e.g. in Figs. 1- 4 is that the systemic velocity depends not only on the distance from LG but also on the angular distance from the centre. Basically, for each galaxy there is a unique “S-curve” depending on .
Formally, the -dependence is removed if the velocity-distance law is examined from the origin of the metric instead of from LG, as was done in Sect. 4.5 of Paper I. The velocity as seen from Virgo for a galaxy is solved from:
| (4) |
The relative distance from the centre , where is the distance between the galaxy considered and the centre of Virgo, is solved from Eq. 14 of Paper II and the sign is for and otherwise.
There are, however, some difficulties involved. We are aware that the calculation of the virgocentric velocity is hampered by some sources of error. Suppose that the cosmological fluid has a perfect radial symmetry about the origin of the TB-metric. Also, the fluid elements do not interact with each other, i.e. each element obeys exactly the equations of motion of the TB-model. It follows that the measured line-of-sight velocity is a genuine projection of the element’s velocity with respect to the origin. It is presumed that the observer has made the adequate corrections for the motions induced by his immediate surroundings (e.g. Sun’s motion with respect to the Galaxy, Galaxy’s motion with respect to the LG).
Now, in practice, is bound to contain also other components than simply the TB-velocity. We may also have mass shells which have travelled through the origin and are presently expanding near it instead being falling in. Such a shell has experienced strong pressures (in fact, a singularity has formed to the origin) i.e. there is no causal connection to the rest of the TB-solution. Also, shells may have crossed. Again singularity has formed and the TB-solution fails (recall that TB-model describes a pressure-free cosmological fluid). Incorrect distance (and the scaling length ) will cause an error in even when could be considered as a genuine projection of .
5.1 The two-component mass model
So far we have used a rather simple density model. From hereon we use the “two-component” model of Paper I. In this model one assumes that mass within at Virgo distance () is proportional to the Virgo virial mass and that outside this region the mass is evaluated from the simple density law (Eq. 9 in Paper II):
| (5) |
The important quantity is the parameter (Eq. 6 in Paper II). Following Ekholm (Ekholm96 (1996)) we now proceed to express it in terms of the relative distance “measured” from the origin of the metric and the deceleration parameter . In terms of it reads:
| (6) |
Because (cf. Eq. 9 in Paper II)
| (7) |
we find
| (8) | |||||
Now, using , (e.g. the function for ) and , Eq. 8 takes its final form
| (9) | |||||
where .
5.2 vs. diagram for
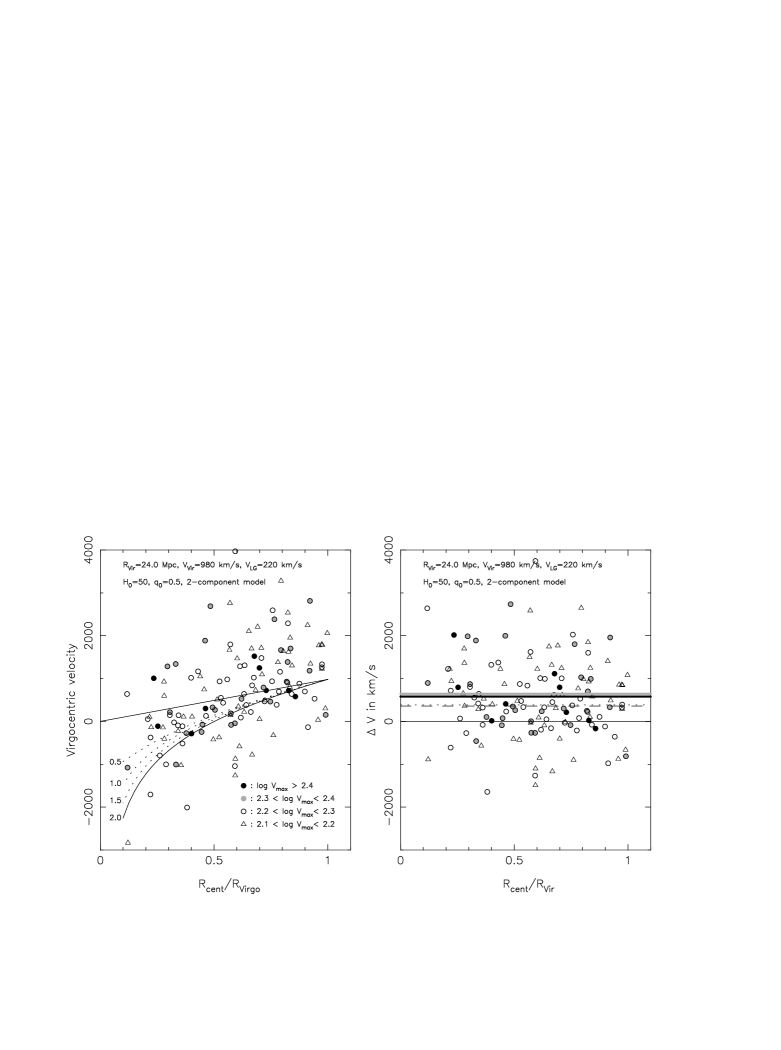
We show the virgocentric diagram for in the left panel of Fig. 7. The galaxies are now selected in the following manner. From the initial sample we take galaxies having but make no restriction on . In this way we get a symmetric sample around the centre. Because the angular dependence is no longer relevant, we show the data for different ranges of : black bullets are for , grey bullets for , circles for and triangles for . The straight line is Hubble law as seen from the centre and the curves (predicted velocity vs. ) correspond to different solutions to the two-component model. We have assumed and solved the TB-equations with Eq. 9 for , , and yielding mass excesses , , and , respectively.
Because the gradient of the -curve gets quite steep as , it is easier to study the difference between calculated and predicted velocities
| (10) |
as a function of . This is shown in the right panel of Fig. 7. The model values were based on . In this panel we also show the mean for each range. For (, ) it is given as a black thick line, for (, ) as a grey thick line, for (, ) as a dashed line, and for (, ) as a dotted line. We note that our sample is clearly divided into two subgroups by . The slower rotators show a better fit to our chosen model. In general, galaxies in this sample have on average higher velocities than the model predicts, possibly due to some residual Malmquist bias (cf. also Figs. 5 – 6 of Paper I). It is, however, clear that the overall TB-pattern is seen in the left panel of Fig. 7 as a general decrease in when one approaches the centre.


5.3 Evidence from galaxies with -distances
How do the galaxies with -distances behave in this virgocentric representation? When selected in a similar fashion as above we find 23 galaxies shown in Fig. 8. We saw that was a rather high value for them but now together with and brings about a remarkable accordance. This is particularly important in the light of the complications mentioned in the introduction to this section. It seems that at least when using high quality distances such as -distances those difficulties do not hamper the diagrams significantly. When this result is compared with the findings of Paper II, the distance estimate given there seems to be more and more acceptable.
There are four galaxies which show anomalous behaviour. NGC 2541 is a distant galaxy as seen from Virgo (, , ) and is also close to the tangential point where small errors in distance cause large projection errors in velocity. We tested how much one needs to move this galaxy in order to find the correct predicted velocity. At , and with . Note also that even a shift of to will yield , which is quite acceptable. When NGC 4639 (, , ) is moved to , one finds and with . What is interesting in this shift is that in Paper II most of the galaxies tended to support except this galaxy and NGC 4548. Now NGC 4639 fits perfectly. Recently Gibson et al. (Gibson99 (1999)) reanalyzed some old HST measurements finding for NGC 4639: or . As regards the two other discordant galaxies (NGC 4414 and NGC 4548) the shift to remove the discrepancy would be too large to be reasonable. At this point we cannot explain their behaviour except by assuming that they are region B galaxies of Paper I (cf. below).
Also, when galaxies with TF-distances were selected according to this normalizing distance we find better concordance with the model than for (cf. Fig. 9). Note also that now only the fastest rotators differ from the rest of the sample: for : , (black thick line), for : , (grey thick line), for : , (dashed line) and for : , (dotted line). At relatively large distances from the centre the points in the right panel of Fig. 9 follow on average well a horizontal trend. As one approaches the centre one sees how the velocity difference gets larger and larger. This systematic increase explains why the mean values are so high. Note that also the Cepheid galaxies NGC 4414 and NGC 4548 (and NGC 4639 if one accepts the larger distance) show a similar increasing tendency towards the centre.
Because the inward growth of appears for both distance indicators one suspects that this behaviour is a real physical phenomenon (we cannot explain it in terms of a large scatter in the TF-relation). Neither can we explain it by a bad choice of model parameters: the effect is much stronger than the variations between different models. A natural explanation is an expanding component (referred to above as region B): galaxies with very high are on mass shells which have fallen through the origin in past and have re-emerged as a “second generation” of TB-shells. The very quick decay of the positive velocity residuals supports this picture. The mass of the Virgo cluster is expected to slow down these galaxies quite fast (Sect. 6 in Paper I), so the effect appears at small .
6 Discussion
We found using the two-component mass model (Eq. 5) and the high quality -distances (Fig. 8) an acceptable fit with parameters and . Our larger TF-sample did not disagree with this model though the scatter for these galaxies is rather large. gives the Virgo cluster mass estimate in terms of the virial mass given by Tully & Shaya (Tully84 (1984)). With a distance it is . By allowing some tolerance ( – ) we get an estimate:
| (11) |
6.1 The Virgo cluster mass, , and behaviour of
We have confirmed the large value of the mass-luminosity ratio for the Virgo cluster (Tully & Shaya Tully84 (1984); Paper I):
| (12) |
With – and , ranges from 350 to 700. Note that some calculations of Paper I for different (e.g. Table 2), which were based on and , remain valid when and . For example, Fig. 7 of Paper I shows that if applies everywhere, rather high values of ( – ) are favoured. A very small , say 0.01, would require that outside of Virgo is several times smaller than in Virgo, i.e. the density of dark matter drops much more quickly than the density of luminous matter.
This happens also – though less rapidly – with used in this paper. This is seen from
| (13) |
The surroundings is defined as . The luminosity ratio is (Tully Tully82 (1982)). The mass ratio is calculated using the two-component mass model (Eq. 5) with the help of Eq. 18 of paper II. For the parameters needed are , , and , which yield and . We find . Both masses are given in units of the Virgo virial mass. The mass-luminosity ratio becomes . When and when .444The total mass within is 6.018 for , 6.019 for and 6.020 for . The Model 1 of Paper II ( and ) gives 6.017 as the total mass. Thus our computational scheme works correctly because the total mass should not depend on how we distribute the matter within our mass shell. This means that with a Virgo mass slightly larger than the virial mass there is a case where the mass-luminosity ratio is constant in and outside Virgo.
How would luminous matter distribute itself? Consider the following simple exercise. Suppose the luminous matter follows a power law and that the mass ratio is:
| (14) |
With the luminosity ratio given above one derives for the galaxies , indeed smaller than our preferred value of 2.5. Is such a steep value at all reasonable in the light of theoretical work on structure formation?
6.2 Comparison with the universal density profile
Tittley & Couchman (Tittley99 (1999)) discussed recently the hierarchical clustering, the universal density profile, and the mass-temperature scaling law of galaxy clusters. Using simulated clusters they studied the dark matter density profile in a Einstein-deSitter universe with , and . They assumed . Different profiles fitted their simulated data equally well. It is their discontinuous form in the first derivative which interests us:
| (15) |
They connect the overdensities as
| (16) |
Because the characteristic length , where is the radius where the density contrast equals 200, the near field governed by is not important to us. With and in our model the mass excess . This translates into in the density law of Paper II: . is the background density equal to the critical density when . At the defined boundary of the Virgo cluster ( or ) we have a density excess . For , and , and for , and . Also, because as comparison between our and the of Tittley & Couchman is acceptable. For hierarchical clustering they find and for the non-hierarchical case . The density profile fitting dynamical behaviour of the galaxies with -distances is within these limits. Our mass estimate tends to be closer to the maximum values Tittley & Couchman give in their Table 3.
7 Summary and conclusions
In this third paper of our series we have extended the discussion of Ekholm et al. (1999a ; Paper II) to the background of Virgo cluster by selecting galaxies with as good distances as possible from the direct B-band magnitude Tully-Fisher (TF) relation. In the following list we summarize our main results:
-
1.
Although having a rather large scatter the TF-galaxies reveal the expected Tolman-Bondi (TB) pattern well. We compared our data with TB-solutions for different distances to the Virgo cluster. It turned out that when the background galaxies fell clearly below the predicted curves. Hence the data does not support such distance scale (cf. Figs. 1 and 2).
-
2.
When we examined the Hubble diagram for galaxies outside the Virgo cone (Fig. 5) we noticed that is a clear upper limit for these galaxies. Together with our preferred cosmological velocity of Virgo () we concluded that is a lower limit.
-
3.
In both cases any residual Malmquist bias would move the sample galaxies further away and thus make the short distances even less believable.
-
4.
We compared our sample galaxies with with the Table 3 of Federspiel et al. (Federspiel98 (1998)) and found 33 galaxies in common. We established a plausible case for corresponding to (cf. Fig. 6). The difference between and is – in terms of the distance moduli – only , which is within the scatter of the TF-relation. Due to this scatter it is not possible to resolve the distance to Virgo with higher accuracy. Hence we claim that – .
-
5.
Some of the kinematical features identified in Paper I were revealed also here, in particular the concentration of galaxies in front with very low velocities (interpreted as an expanding component; region B in Paper I) and the tight background concentration (region D in Paper I). The symmetric counterpart of region B (region C1) may actually be part of the primary TB-pattern.
-
6.
The need for a better distance indicator (e.g. the I-band TF-relation) is imminent. As seen e.g. from Fig.9, the scatter in the B-band TF-relation is disturbingly large. It is also necessary to re-examine the calibration of the TF-relation with the new, and better, -distances. It seems that the -distances and the TF-distances from Theureau et al. (Theureau97 (1997)) are not completely consistent. The former tend to be somewhat smaller. This is also seen from Figs. 6 and 8. TF-distances support and -distances . It is, however, worth reminding that our dynamical conclusions are insensitive to the actual distance scale.
-
7.
When we examined the Hubble diagram as it would be seen from the origin of the TB-metric, galaxies with distances from the extragalactic -relation fitted best to a solution with in concordance with Paper II and with Federspiel et al. (Federspiel98 (1998)). We are, however, not yet confident enough to assign any error bars to this value.
- 8.
-
9.
These high quality galaxies also clearly follow the expected velocity-distance behaviour in the virgocentric frame with much smaller scatter than for galaxies in Paper I or for the TF-galaxies used in this paper. The zero-velocity surface was detected at .
- 10.
-
11.
Our results indicate that the density distribution of luminous matter is shallower than that of the total gravitating matter. The preferred exponent in the density power law, , agrees with the theoretical work on the universal density profile of dark matter clustering (Tittley & Couchman Tittley99 (1999)) in the Einstein-deSitter universe.
Acknowledgements.
This work has been partly supported by the Academy of Finland (project 45087: “Galaxy Streams and Structures in the nearby Universe” and project “Cosmology in the Local Galaxy Universe”). We have made use of the Lyon-Meudon Extragalactic Database LEDA and the Extragalactic Cepheid Database. We would like to thank the referee for useful comments.References
- (1) Binggeli, B., Popescu, C. C., Tammann, G. A., 1993, A&AS 98, 275
- (2) Böhringer, H., Briel, U. G., Schwartz, R. A. et al., 1994, Nat 368, 828
- (3) Bondi, H., 1947, MNRAS, 107, 410
- (4) Ekholm, T., 1996 A&A 308, 7
- (5) Ekholm, T., Teerikorpi, P., 1994, A&A 284, 369
- (6) Ekholm, T., Lanoix, P., Teerikorpi, P. et al., 1999a, A&A 351, 827 (Paper II)
- (7) Ekholm, T., Teerikorpi, P., Theureau, G. et al., 1999b, A&A 347, 99
- (8) Federspiel, M., Tammann, G. A., Sandage, A., 1998, ApJ 495, 115
- (9) Gamow, G., 1946, Nature 379, 549
- (10) Gibson, B. K., Stetson, P. B., Freedman, W. L. et al., 1999, ApJ, in press (astro-ph/9908149)
- (11) Gouguenheim, L., 1969, A&A 3, 281
- (12) Guhathakurta, P., van Gorkum, J. H., Kotanyi, C. G., Balkowski, C., 1988, AJ 96, 851
- (13) Hoffman, G. L., Olson, D. W., Salpeter, E. E., 1980, ApJ 242, 861
- (14) Humason, M. L., Mayall, N. U., Sandage, A., 1956, AJ 61, 97
- (15) Lanoix, P., 1999, PhD Thesis, University of Lyon 1
- (16) Lanoix, P., Paturel, G., Garnier, R., 1999a, MNRAS 308, 969
- (17) Lanoix, P., Garnier, R., Paturel, G. et al., 1999b, Astron. Nach., 320, 21
- (18) Lanoix, P., Paturel, G., Garnier, R., 1999c, ApJ 516, 188
- (19) Ogorodnikov, K. F., 1952, Problems of Cosmogony 1, 150
- (20) Olson, D. W., Silk, J., 1979, ApJ 233, 395
- (21) Peebles, J., 1976, ApJ 205, 318
- (22) Rubin, V. C., 1951, AJ 56, 47
- (23) Rubin, V. C., 1988 in World of Galaxies, eds. H. C. Corwin and L. Bottinelli, New York: Springer, 431
- (24) Silk, J., 1974, ApJ 193, 525
- (25) Teerikorpi, P., 1997, ARA&A 35, 101
- (26) Teerikorpi, P., Bottinelli, L., Gouguenheim, L., Paturel, G., 1992, A&A 260, 17 (Paper I)
- (27) Theureau, G., Hanski, M., Ekholm, T. et al., 1997, A&A 322, 730
- (28) Tittley, E. R., Couchman, H. M. P., 1999, astro-ph/9911365
- (29) Tolman, R. C., 1934, Proc. Nat. Acad. Sci (Wash), 20, 169
- (30) Tully, R. B., Fisher, J. R., 1977, A&A 54, 661
- (31) Tully, R. B., 1982, ApJ 257, 389
- (32) Tully, R. B., Shaya, E. J., 1984, ApJ 281, 31
- (33) Vaucouleurs, G. de, 1953, AJ 58, 30
- (34) Vaucouleurs, G. de, 1958, AJ 63, 253
- (35) Vaucouleurs, G. de, Vaucouleurs, A. de, Corwin, H. G., 1976, Second Reference Catalogue of Bright Galaxies, University of Texas Press, Austin (RC2)
- (36) Vaucouleurs, G. de, Vaucouleurs, A. de, Corwin, H. G. et al, 1991, Third Reference Catalogue of Bright Galaxies, Springer-Verlag (RC3)
- (37) Yahil, A., Tammann, G. A., Sandage, A., 1977, ApJ 217, 903