The Mid-Infrared Spectra of Normal Galaxies
Abstract
The mid-infrared spectra (2.5 to 5 and 5.7 to 11.6) obtained by ISO-PHOT reveal the interstellar medium emission from galaxies powered by star formation to be strongly dominated by the aromatic features at 6.2, 7.7, 8.6 and 11.3. Additional emission appears in-between the features, and an underlying continuum is clearly evident at 3–5. This continuum would contribute about a third of the luminosity in the 3 to 13 range. The features together carry 5 to 30% of the 40-to-120“FIR” luminosity. The relative fluxes in individual features depend very weakly on galaxy parameters such as the far-infrared colors, direct evidence that the emitting particles are not in thermal equilibrium. The dip at 10 is unlikely to result from silicate absorption, since its shape is invariant among galaxies. The continuum component has a shape between 3 and 5, and carries 1 to 4% of the “FIR” luminosity; its extrapolation to longer wavelengths falls well below the spectrum in the 6 to 12 range. This continuum component is almost certainly of non-stellar origin, and is probably due to fluctuating grains without aromatic features. The spectra reported here typify the integrated emission from the interstellar medium of the majority of star-forming galaxies, and could thus be used to obtain redshifts of highly extincted galaxies up to z=3 with SIRTF.
1 Introduction
The Infrared Space Observatory (ISO; Kessler et al. 1996) has provided a unique opportunity for infrared spectroscopy at wavelengths and sensitivities inaccessible to sub-orbital platforms. Mid-infrared spectroscopy has been an important tool in characterizing star formation and the interstellar medium in galaxies since the mid-seventies (Willner et al. 1977; Roche et al. 1991), and has taken a major leap forward thanks to the sensitivity and unimpeded spectral coverage of ISO.
This is a first report on mid-infrared spectroscopy of galaxies using ISO-PHOT (Lemke et al. 1996) obtained as part of the ISO Key Project under NASA Guaranteed Time on the interstellar medium of normal galaxies (Helou et al. 1996). This Key Project used ISO to derive the physical properties of the interstellar gas, dust and radiation field in a broad sample of “normal” galaxies, defined as systems whose luminosity is derived from stars. This sample includes sixty objects comprising all morphological types, with visible-light luminosities ranging from to , infrared-to-blue ratios from 0.1 to 100, and IRAS colors between 0.3 and 1.2. The sample is not statistically complete, but is designed to capture the great diversity among galaxies, especially in terms of the ratio of current to long-term average star formation rate.
2 The Spectra
The PHT-S module of the ISO-PHOT instrument (Lemke et al. 1996) has a aperture on the sky, pointed with an accuracy (Kessler et al. 1996). The instrument has two 64-element linear Si:Ga detector arrays covering the range 2.5 – 4.9 with per element, and the range 5.9 – 11.7 with 0.1 per element. The elements are sized to match the image of the entrance aperture, thereby determining the spectral resolution. The FWHM of an unresolved line varies between 1.5 and 2 elements depending on the centering of the line with respect to pixel boundary. Each galaxy was observed for a total of 512 seconds, split evenly between galaxy and sky, using a double-sided chopping scheme for sky subtraction. The PHT-S spectra were derived from the Edited Raw Data using the ISO-PHOT Interactive Analysis (PIA) V.7 in a standard way. The flux calibration was done using a mean, signal-dependent “detector response function” derived directly from chopped observations of standard stars with known spectra. Our final spectra are the integral under the PHT-S beam profile of the surface brightness distribution of the source, expressed as a flux density. The combined uncertainties of the relative calibration across the spectrum and the absolute flux scale should be 30% according to the PHT-S calibration report as well as our own cross-calibration with the CAM photometry at 6.7 in Silbermann et al. (2000).
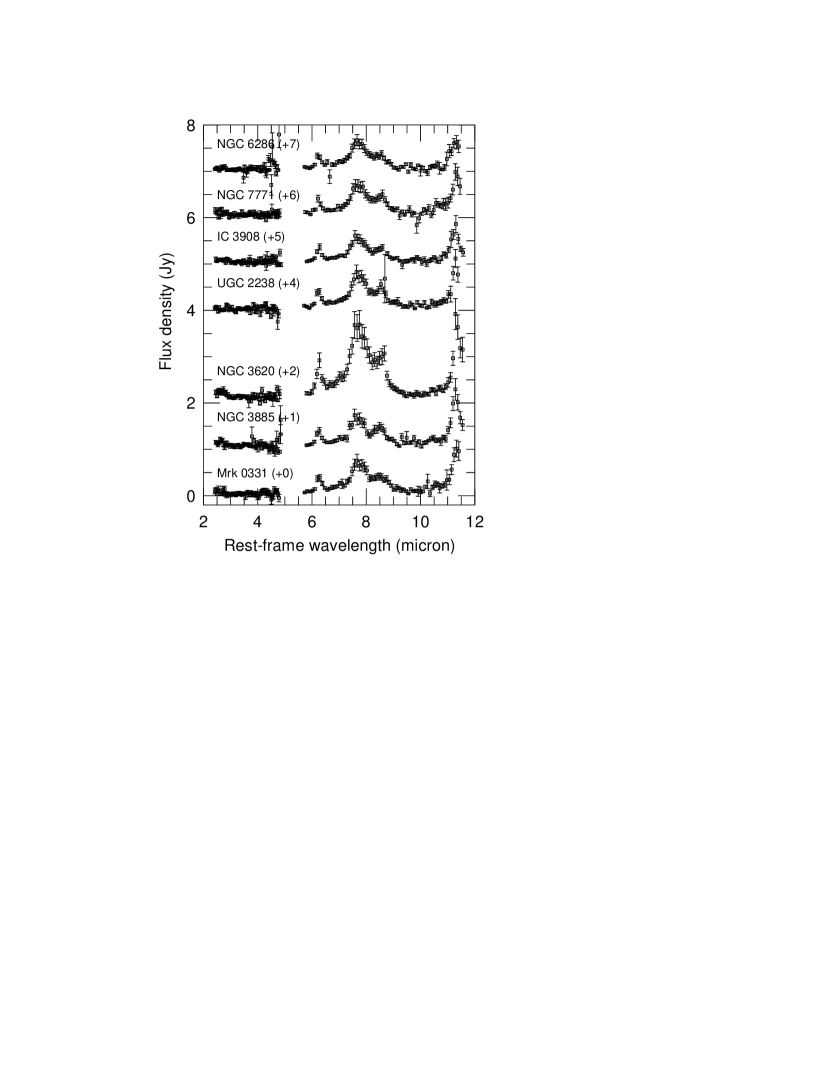
Of the 45 galaxies eventually observed in total with PHT-S, figure 1 shows spectra for seven galaxies selected so that most of their flux is contained within the PHT-S aperture (Table 1). This selection is based on broadband images at 6.75 () obtained with ISO-CAM (Césarsky et al 1996) and described elsewhere (Silbermann et al 2000). Table 1 lists the galaxies and illustrates the large spread in their basic properties. Column (1) gives the name, (2) the IRAS color ratio , and (3) the optical morphology. Column (4) gives the fraction of 6.75 flux within the PHT-S aperture, (5) the infrared-to-blue ratio, (6) the luminosity in solar units within the FIR synthetic band (42.5 to 122.5) defined in Helou et al. (1988), and (7) the mid-infrared morphology from Silbermann et al. (2000).
The mid-infrared spectra of all these galaxies are dominated by emission features which appear in two main groups, one stretching from 5.5 to 9, and the other starting at 11 and extending beyond the spectral range of these data (see Boulanger et al. 1996 for a similar spectrum at longer wavelengths of a molecular cloud region). The shape and relative strengths of the features are quite similar to “Type A sources” which are the most common non-stellar objects in the Milky Way: reflection nebulae, planetary nebulae, molecular clouds, diffuse atomic clouds, and HII regions (Geballe 1997, Tokunaga 1997, and references therein). While there is good evidence to link these features to Polycyclic Aromatic Hydrocarbons (PAH) or similar compounds, there is no rigorous spectral identification (Puget & Léger 1989; Allamandola et al. 1989). It is generally agreed however that the emitters are small structures, 100 atoms typically, transiently excited to high internal energy levels by single photons. The identification issue will not be discussed further here, and the spectral features will be referred to as “aromatic features in emission” (AFE). Quantitatively similar spectra have been reported from spectroscopic observations with PHT-S, ISO-CAM CVF or ISO-SWS on a variety of Galactic sources and a number of galaxies (Tielens et al. 1999 review, Vigroux et al. 1996, Metcalfe et al. 1996). However, interstellar dust can manifest mid-infrared spectra of fundamentally different appearance in environments such as the Galactic Center (Lutz et al. 1996), supernova remnants (Tuffs 1998), compact HII regions (Césarsky et al. 1996a) and AGNs (Lutz et al. 1998; Roche et al. 1985). Such sources are thus obviously not major contributors to the integrated spectra of normal galaxies.
ISO-SWS spectra with greater spectral resolution show AFEs with the same shape, a clear indication that they are spectrally resolved in our PHT-S data. The non-detection of the 3.3 feature in individual spectra is not surprising, since it is known to amount to 1% or less of the luminosity carried by the mid-infrared AFEs in “Type A sources” (Tokunaga 1997; Willner et al. 1977 for M82) and would therefore be below the 1 level in our individual spectra.
Finally, an important consequence of the invariant shape of the spectrum up to 11 is that the 10 trough is best interpreted as a gap between AFE rather than a silicate absorption feature. An absorption feature would become more pronounced in galaxies with larger infrared-to-blue ratios, and that is not observed (see also Sturm et al. 2000).
3 The Average Spectrum
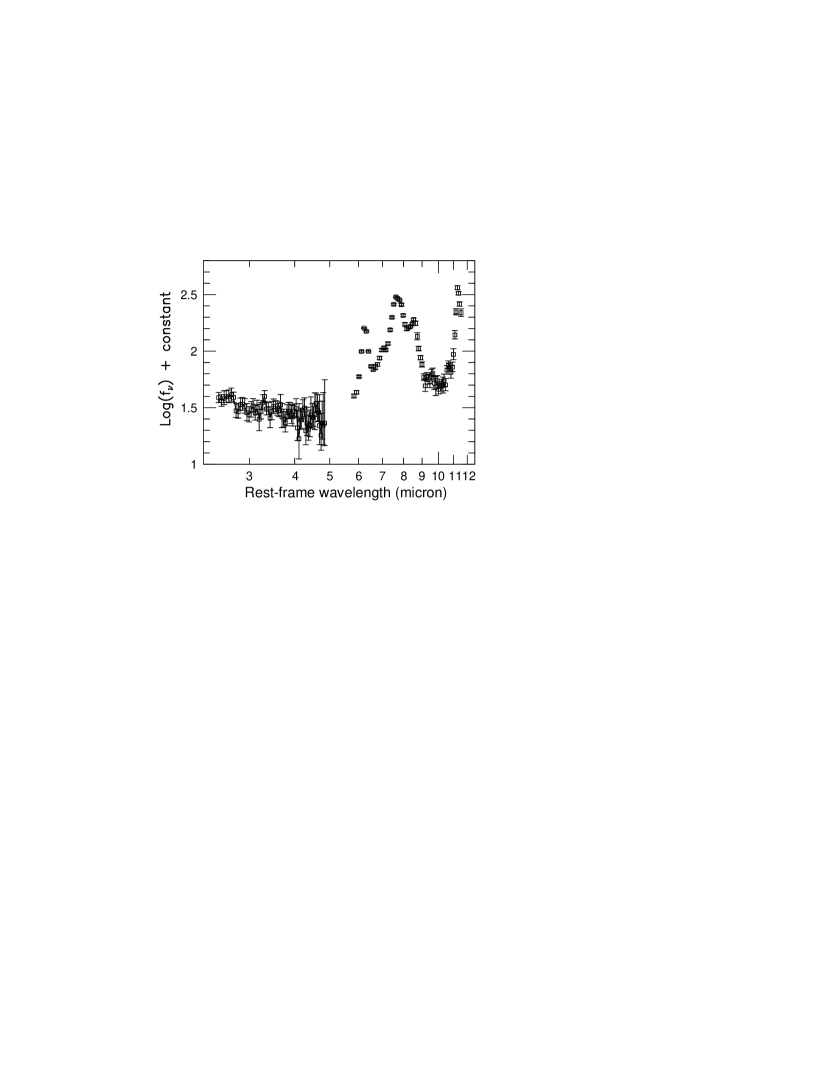
The seven objects in Table 1 are among 45 galaxies observed by ISO for the Key Project, most of which display similar spectra, regardless of the relative sizes of aperture and galaxy. The only significant exception are NGC 4418, which is known to harbor an AGN, and NGC 5866, an early-type galaxy discussed in detail by Lu et al. (2000). Thus the mid-infrared spectral shape varies little or only weakly with galaxy attributes. Relative to each other, various feature luminosities are constant to within the signal-to-noise ratio, or . One exception is the relative strength of the 11.3 feature which varies among galaxies by as much as 40%, to be discussed in more detail elsewhere (Lu et al. 1996, Lu et al. 2000). Figure 2 shows a composite spectrum obtained by averaging the data from 28 galaxies, including the seven in Figure 1, after normalizing each spectrum to the integrated flux between 6 and 6.6. The 28 galaxies are a random subset of the Key Project sample with diverse properties, ranging for instance from 0.28 to 0.88 in . This composite spectrum should be a reliable representation of the emission from the ISM of normal galaxies.
The spectrum in Figure 2 is consistent with earlier data in this spectral range, including early M82 spectra by Willner et al. (1977), ground-based surveys (Roche et al. 1991), and IRAS-LRS data (Cohen & Volk 1989). However, it reveals new details and establishes the universality of the AFE. A striking aspect of the composite spectrum is the smooth continuum stretching from 3 to 5, and apparently underlying the AFE at longer wavelengths (see §5 below).
Madden (1996) and Boselli & Lequeux (1996) show spectra of elliptical galaxies dominated by stellar photosphere emission, which drop off between 2 and 5 like . This component appears negligible in the composite spectrum at , since the continuum has at 35. The well known 3.3 aromatic feature is detected at the expected wavelength, carrying about 0.5% of the power in the AFE longwards of 5, a significantly smaller fraction than observed in M82 (Willner et al. 1977).
The small bump at 7 is a significant signal, carrying about 0.65% of the total AFE power, and might include the [Ar II] and the S(5) pure rotational line () of H2 . In well resolved ISO-SWS spectra, e.g. M82 or the line of sight to the Galactic Center (Lutz et al. 1996), [Ar II] clearly dominates. The 0.65% fraction of AFE power, or about 0.1% of the FIR luminosity, approaches the most luminous lines in the far infrared, [OI] and [CII] (Malhotra et al. 1998). Although no dust related feature has been identified reliably at this wavelength, the high luminosity suggests that such a feature may contribute in addition to the [Ar II]+H2 blend. The smaller bump at 9.6 coincides with the S(3) pure rotational line () of H2 , but it is too luminous to be due to that line alone, scaling from well studied galaxies (Valentijn et al. 1996).
4 The Energetics
The fraction of starlight processed through AFE has been under debate since the IRAS mission (Helou, Ryter & Soifer 1991), and can now be directly estimated using the new ISO data for the sample described above. The various AFE are measured by integrating the spectrum in the intervals 6 to 6.5, 7 to 9, and 11 to 11.5. The contribution from an extrapolation of the 4 continuum is completely negligible, below the 1% level. The 11.3 feature merges into a complex that extends to about 13. We estimate the total power of this complex by extending our composite spectrum using the mean, continuum-subtracted spectrum from Boulanger et al. (1996) and Césarsky et al. (1996b). This extension amounts to a 12% adjustment to the AFE emission within the PHT-S range. The result is that AFE account for about 65% of the total power between 3 and 13, and about 90% of the power between 6 and 13. The AFE carry 25 to 30% of L(FIR) in quiescent galaxies in our sample. This fraction gradually drops to less than 10% in the most actively star forming galaxies, i.e. those with the greatest L(IR)/L(B) ratio or , following the trend already noted in Helou, Ryter & Soifer (1991). In a typical quiescent galaxy, AFE might carry 12% of the total infrared dust luminosity between 3 and 1 mm, whereas all dust emission at come up to % of the total dust luminosity.
In the individual galaxy spectra, the power integrated between 7 and 9 runs at 2.5 to 3 times that between 6 and 7; these integrals include the plateau between the features. From the composite spectrum, we find the integrals from 5.8 to 6.6, 7.2 to 8.2, and 8.2 to 9.3 to be in the ratio 1:2:1.
5 The 4-Micron Continuum
Even though it lies an order of magnitude below the AFE peaks, the continuum level shortward of 5 is unexpectedly strong (see for instance the model of Désert et al. 1990). The reliability of this continuum is not in question, since it was detected in several individual galaxies with the same relative strength, and was confirmed by ISO PHT-S staring observations of a few galaxies. However, the calibration of such weak signals may be uncertain by more than the nominal 30%; comparison with ISO-CAM data show a 30% difference, with PHT-S on the high side.
The 4 continuum flux density is positively correlated with the AFE flux, strong evidence linking the continuum to dust rather than stellar photospheres. It appears to follow a power law between 3 and 5, with an uncertainty of 0.15 on the power-law index. Its extrapolation runs three times weaker than the observed , leaving open the nature of the connection between the 4 continuum and the carriers of the AFE. Bernard et al. (1994) have reported evidence for continuum emission from the Milky Way ISM in COBE-DIRBE broad-band data at these wavelengths, with comparable amplitude.
Extrapolating the 4- continuum to longer wavelengths, and assuming the AFE are superposed on it, one finds that the continuum contributes about a third of the luminosity between 3 and 13, the balance being due to AFE. In the range between 6 and 13, that fraction drops to about 10%. Against this extrapolated continuum, the AFE, defined again as the emission from 5.8 to 6.6, 7.2 to 8.2, and 8.2 to 9.3, would have equivalent widths of about 4 or Hz, 18 or Hz, and 13 or Hz, respectively.
The natural explanation for the 4- continuum is a population of small grains transiently heated by single photons to apparent temperatures K. Such a population was invoked by Sellgren et al. (1984) to explain the 3 emission in reflection nebulae, and by other authors to explain the IRAS 12 emission in the diffuse medium (e.g. Boulanger et al. 1988). Small particles with ten to a hundred atoms have sufficiently small heat capacities that a single UV photon can easily propel them to 1000 K equivalent temperature (Draine & Anderson 1985). Such a population is a natural extension of the AFE carriers, though it is not clear from these data whether it is truly distinct, or whether the smooth continuum is simply the non-resonant emission from the AFE carriers. While the current data cannot rule out other contributions, the shape does rule out a simple extension of the photospheric emission from main sequence stars. Red supergiants and Asymptotic Giant Branch stars may contribute, though the level would have to be fortuitously comparable to the dust emission at 10, and the superposition of emission spectra would have to mimick a spectrum.
6 Summary and Discussion
The mid-infrared spectra of normal star forming galaxies are dominated by interstellar dust emission. They are well described between 3 and 13 as a combination of Aromatic Features in Emission and an underlying continuum, with the Features carrying about 65% of the luminosity between 3 and 13. One can reliably assume this is a universal spectral signature of dust.
The constant spectral shape against changing heating conditions from galaxy to galaxy is strong evidence for particles transiently excited by individual photons rather than in thermal equilibrium. This explanation is especially compelling because it accounts for both the aromatic features and the continuum. Transient heating obtains only within a finite range of ISM phases, namely from the translucent molecular regions, through the atomic, and up to weakly ionized regions. In denser regions, AFE carriers may be insufficiently illuminated (Beichman et al. 1988, Boulanger et al. 1990), or condensed onto larger grains (Draine 1985), whereas in HII regions they would be destroyed by ionizing radiation (Césarsky et al. 1996b). Therefore the AFE flux may be approximated as the integral over the appropriate ISM phases in each galaxy of the product of the AFE carrier cross-section and the heating intensity. Helou, Ryter & Soifer (1991) showed that the mid-infrared carries a diminishing fraction of the dust luminosity as the star formation activity increases in a galaxy. While this has been interpreted as the result of generally depressed AFE carrier abundance throughout the whole galaxy, it is more likely to result primarily from relatively smaller AFE carrier niches, presumably overtaken by HII regions where harder and more intense radiation destroys AFE carriers.
The mid-infrared spectral shape is sufficiently uniform among galaxies that it can be used for redshift determinations, using for instance the SIRTF InfraRed Spectrometer (Roellig et al. 1998): galaxies can be readily detected out to z=0.1 in about an hour of integration time, whereas ultraluminous galaxies may be detectable out to z=3 in a comparable amount of time depending on the AFE-to-far-infrared ratio assumed (Weedman, private communication). For galaxies with known redshifts, AFE detection would be an unmistakable dust signature, and thus instantly distinguish between thermal and non-thermal mid-infrared emission, or quantify their relative importance (Lutz et al. 1998).
References
- (1) Allamandola, L. J, Tielens, A. G. G. M., & Barker, J. R. 1989, ApJS, 71, 733
- (2) Beichman, C.A., Wilson, R.W., Langer, W.D., & Goldsmith, P.F. 1988, ApJL, 332, 81.
- (3) Bernard, J.-P., Boulanger, F., Désert, F.X., Giard, M., Helou, G. & Puget, J.-L. 1994, A&A, 291, L5
- (4) Boulanger, F., Falgarone, E., Puget, J.-L., & Helou, G. 1990, ApJ, 364, 136.
- (5) Boulanger, F. et al. 1988, ApJL, 332, 328.
- (6) Boulanger, F. et al. 1996, A&AL, 315, L325.
- (7) Césarsky, C. et al. 1996, A&AL, 315, L32.
- (8) Césarsky, D. et al. 1996a, A&AL, 315, L305.
- (9) Césarsky, D. et al. 1996b, A&AL, 315, L309.
- (10) Cohen, M., & Volk, K. 1989, AJ, 98, 1563.
- (11) Désert, F.X., Boulanger, F. & Puget, J.L. 1990, A&A, 273, 315.
- (12) Draine, B.T. 1985, Protostars and Planets II, ed. D.C. Black & M.S. Matthews (Tucson: University of Arizona), p. 621.
- (13) Draine, B.T, & Anderson, N. 1985, ApJ, 292, 494.
- (14) Geballe, T.R. 1997, From Stardust to Planetesimals: Contributed Papers, ed. M.E. Kress, A.G.G.M. Tielens, & Y.J. Pendleton, NASA Conference publication 3343 (Moffett Field: NASA ARC), p. 119.
- (15) Helou, G., Khan, I., Malek, L. & Boehmer, L. 1988, ApJS, 68, 151.
- (16) Helou, G., Ryter, C. & Soifer, B.T. 1991, ApJ, 376, 505.
- (17) Helou et al. 1996, A&AL, 315, L157.
- (18) Kessler, M.F. et al. 1996, A&AL, 315, L27.
- (19) Lemke, D. et al. 1996, A&AL, 315, L64.
- (20) Lu, N., Helou, G., Beichman, C.A. et al. 1996, BAAS, 28, 1356.
- (21) Lu, N. Y., et al. , 2000 (in preparation).
- (22) Lutz, D. et al. 1996, A&A, 315, L269.
- (23) Lutz, D. Spoon, H.W.W., Rigopoulou, D., Moorwood, A.F.M. & Genzel, R. 1998, ApJ, 505, L103.
- (24) Malhotra, S., Helou, G., Stacey, G. et al. 1998, ApJ, 491, L27.
- (25) Metcalfe et al. 1996, A&AL, 315, L105.
- (26) Puget, J.-L. & Léger, A. 1989, ARA&A, 27, 161.
- (27) Roche, P.F., Aitken, D.K., Phillips, M.M. & Whitmore, B. 1985, MNRAS, 207, 35.
- (28) Roche, P.F., Aitken, D.K., Smith, C.H. & Ward, .J. 1991, MNRAS, 248, 606.
- (29) Roellig, T.L., Houck, J.R., Van Cleve, J. et al. 1997, SPIE.
- (30) Sellgren, K. 1984, ApJ, 277, 623.
- (31) Silbermann, N. et al. 1996, BAAS, 189, 6701.
- (32) Silbermann, N. et al. 2000, in preparation.
- (33) Sturm, E. et al. , 2000, in preparation
- (34) Tokunaga, A.T. 1997, in From Stardust to Planetesimals: Contributed Papers, ed. M.E. Kress, A.G.G.M. Tielens, & Y.J. Pendleton, NASA Conference publication 3343 (Moffett Field: NASA ARC).
- (35) Tuffs, R. 1998, in preparation.
- (36) Valentijn, E.A., van der Werf, P.P., de Graauw, T. & de Jong, T. 1996, A&A, 315, L145.
- (37) Vigroux, L., et al. 1996, A&A, 315, L93.
- (38) Willner, S., Soifer, B., Russell, R., Joyce, R., & Gillett, F. 1977, ApJ, 217, L121.
| Galaxy | Morphology | faper | L(FIR)/L(B) | [L(FIR)/L☉] | Mid-IR Morphology | |
|---|---|---|---|---|---|---|
| (1) | (2) | (3) | (4) | (5) | (6) | (7) |
| NGC 6286 | 0.32 | Sb | 0.69 | 9 | 10.3 | inclined disk |
| NGC 7771 | 0.47 | SBa | 0.52 | 7 | 10.4 | warped disk |
| IC 3908 | 0.52 | SBd | 0.53 | 5 | 9.0 | inclined disk |
| UGC 02238 | 0.52 | Im? | 0.80 | 11 | 10.4 | just resolved |
| NGC 3620 | 0.68 | SBab | 0.75 | 100 | 10.0 | faint disk, central peak |
| NGC 3885 | 0.75 | S0/a | 0.82 | 3 | 9.4 | just resolved |
| Mkn 0331 | 0.81 | S? | 0.76 | 27 | 10.5 | just resolved |