High–resolution radio observations of Seyfert galaxies in the extended 12–micron sample – I. The observations.
Abstract
We present 8.4 GHz VLA A–configuration observations of 87 sources from the mid–infrared–selected AGN sample of ?. These 0.25 arcsec resolution observations allow elongated radio structures tens of parsecs in size to be resolved and enable radio components smaller than 3.5 arcsec to be isolated from diffuse galactic disc emission. When combined with previous data, matched radio observations covering ninety percent of the sample have been collected and these represent the largest sub–arcsecond–resolution radio imaging survey of a homogeneously–selected sample of Seyfert galaxies to date.
We use our observations to identify 5 radio–loud AGN in the sample. The nature of the radio emission from Seyfert nuclei will be discussed in subsequent papers.
keywords:
galaxies: active – galaxies: Seyfert – galaxies: statistics – infrared: galaxies – radio continuum: galaxies.1 Introduction
Exceptional amounts of energy are being released at the centres of a few percent of all galaxies. These Active Galactic Nuclei (AGN) are among the most luminous objects in the Universe and may emit more radiation than an entire galaxy from a region thought to be around ten thousand times as small. Seyfert nuclei, which are usually found in nearby spiral galaxies, are an important class of AGN because of the high quality and wide variety of information we may obtain about them and their host galaxies: they are sufficiently close and sufficiently luminous to be observed with good linear resolution using a variety of important techniques. For these reasons, samples of Seyfert galaxies may be defined more selectively than other classes of AGN and permit detailed comparisons of a wider range of properties.
Radio studies of several Seyferts show highly–collimated structures similar to those found in radio galaxies e.g. Markarian 3 (?), Markarian 6 (?), Markarian 463 (?), NGC 1068 (?), and NGC 4151 (?). Hubble Space Telescope images have confirmed that small–scale radio structures are often associated with individual narrow–line–region features (?; ?), as previously suspected from ground–based spectroscopy (?; ?) and it is now clear that the outflows which cause collimated radio structures have a direct influence on the narrow–line emission we observe (see models by ? and ?). Despite this, the importance of collimated outflows from Seyfert nuclei is often overlooked. In order to incorporate the radio properties of Seyfert nuclei into models of their activity and provide the context for studies of well–known individual Seyfert galaxies, it is necessary to document their generic radio properties.
Early statistical studies of the radio properties of Seyfert galaxies were carried out by ? and ?. The radio properties of the following samples of Seyferts have been studied subsequently; Seyferts from the lists of Markarian (?; ?), distance–limited samples (?; ?; ?), an X–ray flux–limited sample (?), the CfA Seyfert sample (?; ?; ?), samples selected from the literature (?; ?), far–infrared–selected samples (?; ?; ?) and the mid–infrared–selected extended 12 m sample (?). Large, unbiased samples are required to compare the properties of the two types of Seyfert galaxy, but the definition of such samples is problematic. Ideally, all physically–similar objects within a certain volume of space should be selected, however this is extremely difficult to achieve. In practice the selection criteria together with observational limitations tend to bias samples towards certain classes of object.
In this paper we present observations of the extended 12 m AGN sample of ? using an observing technique which has been chosen to optimize sensitivity to small–scale radio structures i.e. the VLA in A–configuration at 8.4 GHz. This sample is one of the largest homogeneously–selected samples of Seyfert galaxies available and contains well–matched populations of type 1 and type 2 sources. The paper is organized as follows; in Section 2 we briefly describe the sample, in Section 3 we describe the observations and data reduction, in Section 4 we present the results and in Section 5 we explain how 5 radio–loud objects from the sample may be identified. An analysis of the radio properties of the sample will be carried out in subsequent papers.
A value of H∘ = 75 km s-1Mpc-1 is assumed throughout.
2 THE EXTENDED 12–MICRON SAMPLE
The extended 12 m AGN sample of ? is an extension of the original 12 m AGN sample of ? to fainter flux levels using the IRAS Faint Source Catalogue Version 2 (?). From an initial sample of 893 mid–infrared–bright sources, AGN catalogues were used to define a subsample of active galaxies which contains 118 objects, the majority of which are Seyfert galaxies. The sample was selected at 12 m in order to minimize wavelength–dependent selection effects. ? proposed that this wavelength carries an approximately constant fraction, around 20%, of the bolometric flux for quasars and both types of Seyfert.
Previous radio observations of part of the extended 12 m AGN sample have been made by ? who observed 16 sources with the same resolution as the observations presented in this paper and ? who presented lower resolution observations of the original 12 m sample which includes 51 sources from the extended sample. The hard X–ray properties of the sample have been studied by ? and the host galaxies of the sample have been studied by ?.
3 THE OBSERVATIONS
We have made new observations of 87 sources and when combined with matched observations of 19 sources from the CfA Seyfert sample (?) these observations cover 91% of the AGN sample of ?. Of the 12 sources not observed, 10 are unobservable at the VLA due to their low declination and two are well–studied radio sources (3C 120 and 3C 273).
An almost identical observing strategy to that used by ? was followed for all observations. The Very Large Array111Operated by Associated Universities Inc. under contract with the National Science Foundation. ? give instrumental details. (VLA) was used in A–configuration at 8.4 GHz in snapshot mode with approximately 16 minutes on each source and approximately 6 minutes on a corresponding phase calibrator. J2000 co–ordinates were used, with phase calibrators selected from the A–category NRAO list and the list of ?. In theory the positional accuracy of the final images is 0.005 arcsec, but to allow for atmospheric fluctuations we adopt a conservative estimate of 0.05 arcsec. Due to an on–line computer failure during the initial observing run, the 87 new sources observed were split between two separate observing runs. The final radio database will therefore contain data from 3 separate epochs; 15th July 1995 (63 sources), 25th November 1996 (24 sources) and June 1991 (19 sources from the CfA sample). The epoch of each new observation is indicated in Table 1.
Between the 1995 run and the 1996 run, the two default VLA observing frequencies changed from 8.415 and 8.464 GHz to 8.435 and 8.485 GHz to avoid interference. The mean 1– noise level for all maps was 5320 Jy; 5616 Jy for the 1995 maps compared with 4426 Jy beam-1 for the 1996 maps. Table 1 gives the noise levels for individual maps. Mean noise values have been calculated using only those thermal–noise–limited sources (peak flux 100 mJy beam-1) observed at high elevation (axial ratio of beam 5), errors represent the standard deviation of the mean.
All data processing, including calibration and mapping, was performed using the Astronomical Image Processing System (AIPS) in the standard way. The data were Fourier–transformed using a natural weighting scheme in order to maximize sensitivity. After CLEAN deconvolution, the maps were restored with a 0.25 arcsec FWHM Gaussian beam. The largest detectable angular size in this configuration is 3.5 arcsec. Seventeen strong sources, whose peak flux density exceeded 10 mJy, were subjected to several cycles of self–calibration. In the final maps the sensitivity approached thermal noise levels (1– 120 Jy beam-1) for all except 5 sources, these were either bright ( 100 mJy beam-1) or observed at low elevation (axial ratio of beam 5).
4 RESULTS AND ANALYSIS
4.1 Observational results
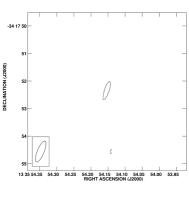
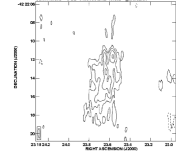
Contour maps of all detected sources are shown in Figure 1. The ellipse in the lower left–hand corner shows the shape of the restoring beam at half power. Optical nuclear positions are marked by a cross where they are available from ?, ? and ?; the diameter of the cross shows the 2– positional uncertainty.
Descriptions of the radio maps are shown in Table 1 which is arranged as follows; Column 1: Galaxy name, a dagger () indicates data from the July 1995 observing run and an asterisk () indicates data from the November 1996 observing run. Column 2: Beam major axis, . Column 3: Beam minor axis, . Column 4: Beam position angle in degrees, PA. Column 5: Peak flux density, Speak (mJy/beam). Column 6: The root mean square noise, , measured at the edge of the field where no deconvolution techniques were applied (Jy/beam). Column 7: Contour levels for each map (Jy/beam). Where possible the base contour level was set at 3– however in 28% of the maps instrumental ‘side–lobes’ were present and the base contour level was set at a level which excluded obvious spurious features. Side–lobes result from the incomplete coverage of the uv–plane of the interferometer. They are usually removed by deconvolution techniques such as CLEAN but can remain strong when the original data are of poor quality or badly calibrated, or when the target source is particularly bright or observed at low elevation.
| Galaxy | (′′) | (′′) | PA(∘) | Speak(mJy/B) | 1–(Jy/B) | Contour levels (Jy/B) |
|---|---|---|---|---|---|---|
| ∗Mrk 938 | 0.39 | 0.25 | 11 | 6.2 | 35 | 3–-1,1,2,4,8,16,32 |
| ∗NGC 262 | 0.28 | 0.20 | -76 | 310.3 | 187 | 3–-1,1,2,4,8,16,32,64,128,256,512 |
| ∗E541 | 0.46 | 0.25 | 12 | 0.4 | 28 | 3–-1,1,2,4 |
| ∗NGC 424 | 0.85 | 0.25 | 1 | 7.0 | 69 | 12–-1,1,2,4,8 |
| ∗NGC 526A | 0.73 | 0.24 | 3 | 3.9 | 48 | 3–-1,1,2,4,8,16 |
| ∗NGC 513 | 0.30 | 0.25 | -67 | 0.8 | 30 | 3–-1,1,2,4,8 |
| †F01475-0740 | 0.48 | 0.24 | 39 | 132.0 | 65 | 6–-1,1,2,4,8,16,32,64,128,256 |
| †Mrk 1034 | 0.29 | 0.26 | 57 | 2.9 | 44 | 3–-1,1,2,4,8,16 |
| †MCG-3-7-11 | 0.67 | 0.24 | 37 | 2.0 | 50 | 3–-1,1,2,4,8 |
| †NGC 1056 | 0.70 | 0.26 | 1 | 0.4 | 51 | 3–-1,1,2 |
| †NGC 1097 | 0.59 | 0.25 | 2 | 2.8 | 49 | 3–-1,1,2,4,8,16 |
| ∗NGC 1125 | 0.42 | 0.27 | -7 | 4.2 | 32 | 3–-1,1,2,4,8,16,32 |
| †NGC 1194 | 0.58 | 0.25 | 51 | 0.7 | 51 | 3–-1,1,2,4 |
| ∗NGC 1241 | 0.36 | 0.27 | -13 | 5.3 | 46 | 4–-1,1,2,4,8,16,32 |
| †NGC 1320 | 0.60 | 0.25 | 51 | 0.7 | 55 | 3–-1,1,2,4 |
| †NGC 1365 | 0.76 | 0.25 | -1 | 1.5 | 59 | 3–-1,1,2,4,8 |
| †NGC 1386 | 0.78 | 0.25 | -7 | 5.6 | 52 | 15–-1,1,2,4 |
| †F03362-1642 | 1.01 | 0.26 | -48 | 0.7 | 46 | 3–-1,1,2,4 |
| ∗F03450+0055 | 0.32 | 0.27 | -17 | 4.2 | 31 | 3–-1,1,2,4,8,16,32 |
| ∗Mrk 618 | 0.38 | 0.27 | -14 | 1.7 | 26 | 3–-1,1,2,4,8,16 |
| †F04385-0828 | 0.75 | 0.26 | -50 | 4.7 | 43 | 6–-1,1,2,4,8,16 |
| †NGC 1667 | 0.64 | 0.26 | -50 | 0.4 | 48 | 3–-1,1,2 |
| †MCG-5-13-17 | 0.65 | 0.25 | 8 | 1.4 | 70 | 3–-1,1,2,4 |
| ∗F05189-2524 | 0.53 | 0.27 | -8 | 5.0 | 57 | 6–-1,1,2,4,8 |
| †E253-G3 | 1.49 | 0.24 | 2 | 5.7 | 485 | 3–-1,1 |
| †F05563-3820 | 0.85 | 0.26 | 4 | 5.1 | 107 | 15–-1,1,2 |
| †Mrk 6 | 0.46 | 0.24 | -85 | 12.8 | 36 | 3–-1,1,2,4,8,16,32 |
| †Mrk 9 | 0.55 | 0.24 | -71 | 0.4 | 40 | 3–-1,1,2 |
| †Mrk 79 | 0.27 | 0.26 | -41 | 0.8 | 49 | 3–-1,1,2,4 |
| ∗F07599+6508 | 0.34 | 0.29 | 61 | 5.0 | 35 | 3–-1,1,2,4,8,16,32 |
| †NGC 2639 | 0.26 | 0.26 | 0 | 90.6 | 67 | 9–-1,1,2,4,8,16,32,64,128 |
| †OJ 287 | 0.31 | 0.26 | -1 | 1515.3 | 1175 | 9–-1,1,2,4,8,16,32,64,128 |
| †F08572+3915 | 0.26 | 0.25 | 80 | 2.6 | 54 | 6–-1,1,2,4 |
| †Mrk 704 | 0.27 | 0.26 | 21 | 0.7 | 62 | 3–-1,1,2 |
| ∗UGC 5101 | 0.30 | 0.21 | 63 | 29.0 | 97 | 3–-1,1,2,4,8,16,32,64 |
| †NGC 2992 | 0.37 | 0.26 | -8 | 3.9 | 57 | 3–-1,1,2,4,8,16 |
| †Mrk 1239 | 0.31 | 0.26 | 7 | 6.8 | 90 | 6–-1,1,2,4,8,16 |
| ∗NGC 3031 | 0.32 | 0.20 | 60 | 221.2 | 133 | 3–-1,1,2,4,8,16,32,64,128,256,512 |
| †3C 234 | 0.26 | 0.25 | 68 | 33.5 | 67 | 4–-1,1,2,4,8,16,32,64 |
| †NGC 4579 | 1.32 | 0.26 | 56 | 33.9 | 59 | 15–-1,1,2,4,8,16,32 |
| †NGC 4593 | 0.65 | 0.25 | 49 | 1.0 | 45 | 3–-1,1,2,4 |
| †NGC 4594 | 0.94 | 0.25 | 50 | 84.7 | 53 | 3–-1,1,2,4,8,16,32,64,128,256,512 |
| †TOL1238 | 0.90 | 0.30 | -17 | 1.4 | 102 | 3–-1,1,2 |
| †MCG-2-33-34 | 0.38 | 0.26 | 13 | 0.6 | 55 | 3–-1,1,2 |
| †PGC 044896 | 0.45 | 0.26 | 65 | 5.0 | 69 | 6–-1,1,2,4,8,16 |
| †NGC 4941 | 0.45 | 0.26 | 41 | 1.9 | 48 | 3–-1,1,2,4,8 |
| †NGC 4968 | 0.47 | 0.26 | 1 | 2.8 | 47 | 6–-1,1,2,4,8 |
| †NGC 5005 | 0.56 | 0.26 | 64 | 1.2 | 46 | 3–-1,1,2,4,8 |
| †MCG-3-34-63 | 0.41 | 0.26 | -8 | 24.5 | 64 | 12–-1,1,2,4,8,16,32 |
| †NGC 5194 | 0.54 | 0.26 | 68 | 0.3 | 47 | 3–-1,1,2 |
| †MCG-6-30-15 | 0.82 | 0.24 | -22 | 0.4 | 68 | 3–-1,1 |
| †F13349+2438 | 0.38 | 0.25 | 66 | 4.0 | 52 | 3–-1,1,2,4,8,16 |
| †NGC 5256 | 0.57 | 0.26 | 67 | 3.5 | 39 | 3–-1,1,2,4,8,16 |
| †Mrk 273 | 0.55 | 0.26 | 69 | 22.2 | 38 | 6–-1,1,2,4,8,16,32,64 |
| †IC 4329A | 0.70 | 0.26 | -21 | 4.9 | 91 | 3–-1,1,2,4,8,16 |
| †NGC 5347 | 1.00 | 0.26 | 58 | 0.7 | 59 | 3–-1,1,2 |
| †Mrk 463 | 0.63 | 0.25 | 58 | 38.2 | 43 | 3–-1,1,2,4,8,16,32,64,128,256 |
| †NGC 5506 | 0.35 | 0.26 | -31 | 50.8 | 77 | 3–-1,1,2,4,8,16,32,64,128 |
| †Mrk 817 | 0.67 | 0.26 | 61 | 2.9 | 58 | 3–-1,1,2,4,8,16 |
| †F15091-2107 | 0.45 | 0.26 | -6 | 6.0 | 68 | 3–-1,1,2,4,8,16 |
| †NGC 5953 | 0.89 | 0.26 | 57 | 0.4 | 55 | 3–-1,1,2 |
| †Arp 220 | 0.86 | 0.26 | 58 | 54.6 | 41 | 24–-1,1,2,4,8,16,32 |
| †MCG-2-40-4 | 0.38 | 0.26 | -13 | 1.6 | 42 | 3–-1,1,2,4,8 |
| †F15480-0344 | 0.33 | 0.26 | -6 | 9.5 | 85 | 3–-1,1,2,4,8,16,32 |
| †NGC 6890 | 1.35 | 0.24 | 5 | 0.6 | 53 | 3–-1,1,2 |
| ∗Mrk 509 | 0.40 | 0.25 | 20 | 1.8 | 32 | 3–-1,1,2,4,8,16 |
| ∗Mrk 897 | 0.42 | 0.26 | 48 | 1.7 | 30 | 3–-1,1,2,4,8,16 |
| †NGC 7130 | 0.74 | 0.24 | 8 | 8.9 | 98 | 6–-1,1,2,4,8 |
| †NGC 7172 | 0.65 | 0.24 | 10 | 2.0 | 59 | 3–-1,1,2,4,8 |
| ∗F22017+0319 | 0.37 | 0.26 | 41 | 0.7 | 28 | 3–-1,1,2,4 |
| †NGC 7213 | 1.71 | 0.24 | -1 | 132.2 | 183 | 3–-1,1,2,4,8,16,32,64,128,256 |
| ∗3C 445 | 0.35 | 0.25 | 24 | 56.3 | 36 | 3–-1,1,2,4,8,16,32,64,128,256,512 |
| ∗NGC 7314 | 0.53 | 0.25 | -2 | 0.8 | 41 | 3–-1,1,2,4 |
| ∗MCG-3-58-7 | 0.44 | 0.24 | -1 | 0.3 | 31 | 3–-1,1,2 |
| ∗NGC 7496 | 1.17 | 0.24 | -1 | 3.2 | 56 | 3–-1,1,2,4,8,16 |
| ∗NGC 7582 | 1.09 | 0.25 | 2 | 2.4 | 80 | 3–-1,1,2,4,8 |
| ∗CG 381 | 0.37 | 0.26 | 40 | 0.3 | 29 | 3–-1,1,2 |


4.2 Description of sources
A brief description of those sources with unusual radio morphologies is given below (all positions are given in J2000 co–ordinates).
NGC 34 (Markarian 938): This infrared–luminous galaxy is in the advanced stage of a merger with two nuclei separated by approximately 6 kpc. The weak [O III] emission and strong Hα emission, which is distributed over the entire galaxy, indicate that this galaxy is more properly classified as a starburst galaxy rather than a Seyfert galaxy (?).
Note that NGC 34 contains a bright radio source more luminous than two–thirds of the Seyferts observed (P8.4GHz=11022 WHz-1) and slightly resolved with a deconvolved size of 0.4 arcsec (150 pc) and position angle of 140∘. High–resolution mid–infrared images show a double source separated by approximately 1.2 arcsec, with the fainter source at a position angle of around 180∘ from the brighter source (?). Radio observations by ? show a faint southern radio extension, not found in our map, which is consistent with the infrared structure.
NGC 526A: NGC 526A is strongly interacting with a galaxy to the east. The position of the slightly resolved radio source is closer to the peak in the optical continuum than to the apex of the putative emission–line wedge identified by ?; whereas the emission–line wedge has a position angle of 123∘, that of the radio source is 43∘.
Markarian 1034 (V Zw 233): Markarian 1034 is an interconnected pair of Seyfert 1 galaxies, MCG+05-06-035 (PGC 0009071) at =02h 23m 18.84s, =+32∘ 11′ 18.2′′ and MCG+05-06-036 (PGC 0009074) at =02h 23m 21.99s, =+32∘ 11′ 49.6′′; positions are taken from the NASA/IPAC Extragalactic Database (NED) as described by ?. The new observations show MCG +05-06-036. This source has extended ‘wings’ of radio emission symmetrical about a central bright component.
NGC 1125: The radio source has a clear linear structure with 3 aligned compact components at a position angle of 120∘. The radio structure is not aligned with the slightly resolved [O III] emission at a position angle of 56∘ (?).
NGC 1365: There is no alignment between the four compact radio components observed and none is co–incident with the photographic position of the nucleus which lies at =03h 33m 35.57s, =-36∘ 08′ 22.9′′ (NED), or either of the two infrared sources observed by ?, the brightest of which lies at =03h 33m 36.17s, =-36∘ 08′ 25.9′′ (positional error of 1.5 arcsec).
IRAS F04385-0828: We detect another weak radio source to the west at a projected linear separation of 15.4 kpc, it has an integrated flux of 2.05 mJy and lies at =04h 40m 51.45s, =-08∘ 22′ 23.85′′. This weak source is well beyond the optical radius of the host galaxy, which extends westwards approximately 6 kpc, and is unlikely to be related to the Seyfert nucleus.
Markarian 6 (UGC 3547): This source contains a central, well–collimated radio structure. On larger scales, features suggestive of shells or bubbles are seen at varying position angles (?; ?).
Markarian 79 (UGC 3973): This large radio source shows a linear structure with 3 clearly aligned components. Lower resolution measurements, at lower frequency, show that the southern component is stronger than the northern component (?), whereas in our image these components are almost equally bright.
NGC 2639 (UGC 4544): The source has a bright core and symmetrical east–west ‘wings’. In our map, the core–to–wings brightness ratio is an order of magnitude higher than in the 6 cm map of ?; probably due to core variability. NGC 2639 displays the rare properties of H2O megamaser emission (?) and VLBI–scale radio emission (?). It has also been classified as a LINER.
NGC 2992 (Arp 245): This edge–on, interacting galaxy has unusual ‘loops’ of diffuse radio emission (?; ?).
NGC 4922A/B: NGC 4922 is a system of 3 galaxies situated at =13h 01m 24.50s, =+29∘ 18′ 29.9′′ (Seyfert 2), =13h 01m 24.67s, =+29∘ 18′ 33.0′′ and =13h 01m 25.26s, =+29∘ 18′ 49.58′′ (PGC 044896/FIRST J130125.2+291849); positions are taken from NED. We have detected PGC 044896 (an unresolved 7.8 mJy source at =13h 01m 25.26s, =29∘ 18′ 49.53′′, shown in Figure 1), but not the nearby Seyfert nucleus.
NGC 5135: Despite the bright radio flux of the nucleus at lower resolutions and frequencies (?), no radio emission is observed at the nucleus in the current observations. ? have suggested that, “most of the radio emission of this Seyfert galaxy emanates from structures on either side of the nucleus rather than from the nucleus itself”. We detect a weak component with a flux density of 2.33 mJy at =13h 25m 44.9s, =-29∘ 50′ 16.17′′, but it is unlikely to be related to the active nucleus (see Section 4.3).
Markarian 273 (UGC 8696, I Zw 071): This double–nucleus source is one of the most ultra–luminous infrared galaxies known. The radio continuum shows two compact radio components separated by approximately 600 pc. The radio structure has been mapped previously by ?, who classify it as a compact starburst, and ?.
Markarian 463 (UGC 8850): Three aligned north–south radio components are detected in this well–studied double–nucleus galaxy. North–south radio structures have previously been observed from VLBI–scales (?; ?) to up to 18 kpc south of the nucleus (?). The new observations match the 6 cm radio structure observed by ? with the exception of the weak central radio component which appears to coincide with a bright knot in the aligned optical jet (?). This is the second most radio–luminous Seyfert in the extended 12 m sample.
NGC 5506: This edge–on galaxy has a compact core surrounded by a diffuse halo. The ‘loop’ identified by ? is just traceable to the north–west of the core (see also ?).
UGC 9913 (Arp 220): The two closely separated radio components are the nuclei of this well–known double–nucleus galaxy. The nature of its activity is uncertain. Despite being the 7th most radio–luminous radio–quiet source in the extended 12 m sample, recent VLBI observations by ? provide strong evidence that the radio emission from the north–western component originates in a compact nuclear starburst.
IRAS F22017+0319: If the weak northernmost component is included, this source is a linearly aligned triple radio source.
NGC 7314: This variable X–ray source is a north–south radio double.
MCG-03-58-007: A north–south radio double.
NGC 7582: The source has a diffuse radio structure consistent with the lower–resolution observations of ?.
4.3 Radio properties
| Galaxy | Type | z | RA(J2000) | Dec(J2000) | S(mJy) | (′′) | D(pc) | Trad | PA(∘) |
|---|---|---|---|---|---|---|---|---|---|
| Mrk335∗ | 1 | 0.02586 | 00 06 19.541 | 20 12 10.63 | 2.1 | 0.1 | 50 | U | |
| NGC34(Mrk938) | sb(2) | 0.01919 | 00 11 06.553 | -12 06 27.71 | 14.5 | 0.4 | 149 | S | 140 |
| NGC262(Mrk348) | 2 | 0.01509 | 00 48 47.144 | 31 57 25.07 | 346.0 | 0.1 | 29 | U | |
| IZW1∗ | 1 | 0.06039 | 00 53 34.938 | 12 41 35.96 | 0.9 | 0.1 | 117 | U | |
| E541-IG12 | 2 | 0.05636 | 01 02 17.381 | -19 40 08.52 | 0.8 | 0.2 | 219 | U | |
| NGC424(TOL0109) | 2 | 0.01169 | 01 11 27.647 | -38 05 00.72 | 11.9 | 0.3 | 68 | U | |
| NGC526A | 1 | 0.01905 | 01 23 54.382 | -35 03 55.68 | 7.1 | 0.3 | 111 | S | 43 |
| NGC513 | 2 | 0.01949 | 01 24 26.803 | 33 47 58.24 | 1.2 | 0.1 | 38 | U | |
| F01475-0740 | 2 | 0.01739 | 01 50 02.696 | -07 25 48.53 | 129.8 | 0.2 | 67 | U | |
| Mrk1034 | 1 | 0.03797 | 02 23 21.965 | 32 11 48.90 | 11.6 | 2.1 | 1546 | L | 65 |
| MCG-3-7-11 | 1 | 0.03378 | 02 24 40.546 | -19 08 30.50 | 1.9 | 2.1 | 1376 | L | 34 |
| 02 24 40.587 | -19 08 29.48 | †0.2 | |||||||
| Total | 2.1 | ||||||||
| NGC931(Mrk1040) | 1 | 0.01639 | 0.4 | ||||||
| NGC1056(Mrk1183) | 2 | 0.00520 | 02 42 48.483 | 28 34 25.69 | 0.6 | 0.2 | 20 | U | |
| NGC1068∗ | 2 | 0.00384 | 02 42 40.608 | -00 00 51.52 | †30.3 | 10.0 | 745 | L | 65 |
| 02 42 40.718 | -00 00 47.58 | 282.4 | |||||||
| 02 42 40.724 | -00 00 47.40 | 252.6 | |||||||
| 02 42 40.916 | -00 00 43.07 | 70.4 | |||||||
| Total | 762.4 | ||||||||
| NGC1097 | L(2) | 0.00430 | 02 46 18.955 | -30 16 28.43 | 3.1 | 0.2 | 17 | U | |
| NGC1125 | 2 | 0.03178 | 02 51 40.438 | -16 39 02.33 | †3.0 | 0.8 | 493 | L | 120 |
| 02 51 40.458 | -16 39 02.53 | 3.7 | |||||||
| 02 51 40.487 | -16 39 02.74 | 5.3 | |||||||
| Total | 11.7 | ||||||||
| NGC1143/4∗ | 2 | 0.02880 | 02 55 12.233 | -00 11 00.73 | †2.3 | 7.5 | 4189 | L | 62 |
| 02 55 12.487 | -00 10 59.03 | 1.6 | |||||||
| 02 55 12.560 | -00 10 57.03 | 3.1 | |||||||
| 02 55 12.653 | -00 10 57.22 | 0.9 | |||||||
| Total | 10.5 | ||||||||
| MCG-2-8-39 | 2 | 0.03008 | 0.3 | ||||||
| NGC1194 | 2 | 0.01339 | 03 03 49.106 | -01 06 13.63 | 0.9 | 0.2 | 52 | U | |
| NGC1241 | 2 | 0.00720 | 03 11 14.618 | -08 55 18.88 | 6.8 | 0.1 | 14 | U | |
| NGC1320(Mrk607) | 2 | 0.00989 | 03 24 48.675 | -03 02 32.38 | 1.0 | 0.2 | 38 | U | |
| NGC1365 | 1 | 0.00550 | 03 33 36.036 | -36 08 28.25 | 2.1 | 13.2 | 1407 | A | |
| 03 33 36.402 | -36 08 18.46 | †2.0 | |||||||
| 03 33 36.647 | -36 08 28.19 | 1.8 | |||||||
| 03 33 36.765 | -36 08 18.49 | 3.3 | |||||||
| Total | 9.3 | ||||||||
| NGC1386 | sb(2) | 0.00310 | 03 36 46.197 | -35 59 57.41 | 6.8 | 0.3 | 18 | U | |
| F03362-1642 | 2 | 0.03598 | 03 38 33.557 | -16 32 18.40 | 1.5 | 0.3 | 209 | U | |
| F03450+0055 | 1 | 0.03098 | 03 47 40.193 | 01 05 13.97 | 6.8 | 0.3 | 180 | S | 19 |
| Mrk618 | 1 | 0.03468 | 04 36 22.299 | -10 22 34.03 | 2.9 | 0.2 | 134 | S | 87 |
| F04385-0828 | 2 | 0.01519 | 04 40 54.964 | -08 22 22.08 | 6.0 | 0.3 | 88 | U | |
| NGC1667 | 2 | 0.01529 | 04 48 37.168 | -06 19 11.97 | 1.5 | 0.2 | 59 | U | |
| MCG-5-13-17 | 1 | 0.01249 | 05 19 35.794 | -32 39 28.23 | †1.0 | 1.3 | 315 | S | 27 |
| 05 19 35.815 | -32 39 27.82 | 1.4 | |||||||
| Total | 3.24 | ||||||||
| F05189-2524 | 2 | 0.04147 | 05 21 01.405 | -25 21 45.30 | 6.9 | 0.4 | 322 | S | 177 |
| E253-G3 | 2 | 0.04067 | 2.4 | ||||||
| F05563-3820 | 1 | 0.03438 | 05 58 01.725 | -38 20 04.11 | 3.7 | 24.3 | 16200 | A | |
| 05 58 01.814 | -38 19 58.37 | 1.6 | |||||||
| 05 58 02.030 | -38 20 04.34 | 6.9 | |||||||
| 05 58 02.273 | -38 20 01.59 | 1.6 | |||||||
| 05 58 02.288 | -38 19 49.04 | 4.0 | |||||||
| 05 58 02.384 | -38 20 02.29 | 2.1 | |||||||
| 05 58 02.676 | -38 20 12.86 | †2.6 | |||||||
| Total | 22.4 | ||||||||
| Mrk6 | 2(1) | 0.01849 | 06 52 12.331 | 74 25 37.05 | †27.9 | 2.4 | 860 | L | 170 |
| 06 52 12.327 | 74 25 38.13 | 10.9 | |||||||
| Total | 38.8 | ||||||||
| Mrk9 | 1 | 0.00630 | 07 36 57.016 | 58 46 13.48 | †0.6 | 0.9 | 110 | L | 105 |
| 07 36 56.900 | 58 46 13.72 | 0.2 | |||||||
| Total 0.8 |
| Galaxy | Type | z | RA(J2000) | Dec(J2000) | S(mJy) | (′′) | D(pc) | Trad | PA(∘) |
|---|---|---|---|---|---|---|---|---|---|
| Mrk79 | 1 | 0.02208 | 07 42 32.809 | 49 48 34.90 | 1.2 | 3.5 | 1499 | L | 12 |
| 07 42 32.841 | 49 48 36.64 | 1.1 | |||||||
| 07 42 32.790 | 49 48 33.67 | †0.8 | |||||||
| Total | 3.1 | ||||||||
| F07599+6508 | 1 | 0.15000 | 08 04 30.465 | 64 59 52.85 | 5.8 | 0.1 | 291 | U | |
| NGC2639 | 1 | 0.01079 | 08 43 38.077 | 50 12 19.99 | 118.0 | 1.6 | 335 | L | 109 |
| OJ287 | 1 | 0.30579 | 08 54 48.876 | 20 06 30.59 | 1520.7 | ||||
| F08572+3915 | 2 | 0.05826 | 09 00 25.379 | 39 03 54.15 | 3.8 | 0.1 | 113 | U | |
| Mrk704 | 1 | 0.02928 | 09 18 25.995 | 16 18 19.65 | 0.9 | 0.1 | 57 | U | |
| UGC5101 | 1 | 0.03997 | 09 35 51.605 | 61 21 11.74 | 45.1 | 0.2 | 155 | S | 88 |
| NGC2992 | 2(1) | 0.00769 | 09 45 41.945 | -14 19 34.60 | 5.5 | 8.2 | 1223 | D | |
| Total | 40.3 | ||||||||
| Mrk1239 | 1 | 0.01989 | 09 52 19.096 | -01 36 43.46 | 10.5 | 0.1 | 39 | U | |
| NGC3031(M81) | L(1) | 0.00110 | 09 55 33.174 | 69 03 55.04 | 221.0 | 0.1 | 2 | U | |
| NGC3079∗ | 2 | 0.00371 | 10 01 57.801 | 55 40 47.24 | 93.3 | 0.1 | 7 | U | |
| 3C234 | Q(1) | 0.18477 | 10 01 44.908 | 28 46 52.28 | 38.8 | ||||
| 10 01 46.098 | 28 46 54.17 | 162.3 | |||||||
| 10 01 46.930 | 28 46 40.10 | 11.6 | |||||||
| 10 01 47.280 | 28 47 18.67 | 7.7 | |||||||
| 10 01 49.522 | 28 47 08.89 | 38.8 | |||||||
| 10 01 53.824 | 28 47 38.97 | 63.8 | |||||||
| Total | 323.0 | ||||||||
| NGC3227∗ | 1 | 0.00390 | 10 23 30.574 | 19 51 54.24 | 12.2 | 0.5 | 38 | S | 173 |
| NGC3511 | 1 | 0.00370 | 0.3 | ||||||
| NGC3516∗ | 1 | 0.00883 | 11 06 47.466 | 72 34 07.30 | 3.1 | 0.1 | 17 | U | |
| M+0-29-23 | 2 | 0.02488 | 0.3 | ||||||
| NGC3660 | 2 | 0.01229 | 0.3 | ||||||
| NGC3982∗ | 2 | 0.00396 | 11 56 28.134 | 55 07 30.95 | 0.8 | 0.2 | 15 | U | |
| NGC4051∗ | 1 | 0.00204 | 12 03 09.605 | 44 31 52.73 | 0.6 | 0.1 | 4 | U | |
| UGC7064 | 1 | 0.02498 | 0.3 | ||||||
| NGC4151∗ | 1 | 0.00323 | 12 10 32.424 | 39 24 20.69 | 8.0 | 5.0 | 314 | L | 77 |
| 12 10 32.508 | 39 24 20.89 | †10.9 | |||||||
| 12 10 32.545 | 39 24 21.03 | 17.7 | |||||||
| 12 10 32.582 | 39 24 21.09 | 30.5 | |||||||
| 12 10 32.658 | 39 24 21.35 | 5.2 | |||||||
| Total | 72.3 | ||||||||
| Mrk766∗ | 1 | 0.01279 | 12 18 26.517 | 29 48 46.50 | 8.7 | 0.3 | 74 | S | 27 |
| NGC4388∗ | 2 | 0.00848 | 12 25 46.735 | 12 39 41.87 | †1.4 | 3.3 | 543 | L | 23 |
| 12 25 46.780 | 12 39 43.68 | 3.4 | |||||||
| Total | 9.4 | ||||||||
| NGC4501 | 2 | 0.00769 | 0.2 | ||||||
| NGC4579 | 1 | 0.00500 | 12 37 43.511 | 11 49 05.42 | 36.5 | 0.4 | 39 | U | |
| NGC4593 | 1 | 0.00829 | 12 39 39.445 | -05 20 39.02 | 1.9 | 0.2 | 32 | U | |
| NGC4594 | 1 | 0.00380 | 12 39 59.435 | -11 37 23.11 | 86.6 | 0.3 | 22 | U | |
| NGC4602 | 1 | 0.00849 | 0.2 | ||||||
| TOL1238-364 | 2 | 0.00120 | 12 40 52.783 | -36 45 20.63 | 3.5 | 2.4 | 56 | A | |
| 12 40 52.841 | -36 45 21.22 | †2.3 | |||||||
| Total | 9.6 | ||||||||
| MCG-2-33-34 | 1 | 0.01389 | 12 52 12.479 | -13 24 53.31 | 1.5 | 0.1 | 27 | U | |
| Mrk231(UGC8058)∗ | 1 | 0.04096 | 12 56 14.238 | 56 52 25.21 | 234.5 | 0.1 | 79 | U | |
| NGC4922A/B | 2 | 0.02368 | 0.3 | ||||||
| NGC4941 | 2 | 0.00370 | 13 04 13.096 | -05 33 05.69 | 1.7 | 1.0 | 72 | S | 127 |
| 13 04 13.109 | -05 33 05.91 | †2.1 | |||||||
| Total | 4.8 | ||||||||
| NGC4968 | 2 | 0.00989 | 13 07 05.915 | -23 40 36.83 | †2.1 | 1.3 | 249 | L | 25 |
| 2 | 0.00989 | 13 07 05.928 | -23 40 36.47 | 3.7 | |||||
| Total | 5.8 | ||||||||
| NGC5005 | 2 | 0.00400 | 13 10 56.258 | 37 03 32.88 | 8.8 | 0.7 | 54 | S | 155 |
| NGC5033∗ | 1 | 0.00297 | 13 13 27.469 | 36 35 37.93 | 2.1 | 0.1 | 6 | U | |
| MCG-3-34-63 | 2 | 0.01719 | 13 22 24.465 | -16 43 42.45 | 42.2 | 1.3 | 433 | S | 30 |
| NGC5135 | 2 | 0.01369 | 2.3 | ||||||
| NGC5194(M51) | 2 | 0.00160 | 13 29 52.704 | 47 11 42.79 | 0.5 | 0.2 | 6 | U | |
| MCG-6-30-15 | 1 | 0.00769 | 0.3 |
| Galaxy | Type | z | RA(J2000) | Dec(J2000) | S(mJy) | (′′) | D(pc) | Trad | PA(∘) |
|---|---|---|---|---|---|---|---|---|---|
| F13349+2438 | 1 | 0.10693 | 13 37 18.722 | 24 23 03.32 | 4.7 | 0.2 | 415 | U | |
| NGC5256(Mrk266) | 2 | 0.02748 | 13 38 17.238 | 48 16 43.94 | 1.3 | 12.8 | 6821 | A | |
| 13 38 17.241 | 48 16 32.18 | 4.6 | |||||||
| 13 38 17.600 | 48 16 35.67 | †2.9 | |||||||
| 13 38 17.789 | 48 16 41.09 | 5.7 | |||||||
| Total | 14.5 | ||||||||
| Mrk273(UGC8696) | 2 | 0.03727 | 13 44 42.127 | 55 53 13.49 | †30.5 | 0.8 | 578 | L | 149 |
| 13 44 42.179 | 55 53 12.77 | 2.7 | |||||||
| Total | 33.5 | ||||||||
| IC4329A | 1 | 0.01609 | 13 49 19.263 | -30 18 34.09 | †10.4 | 23.0 | 7177 | A | |
| 13 49 19.271 | -30 18 36.70 | 1.8 | |||||||
| 13 49 20.427 | -30 18 19.29 | 1.5 | |||||||
| 13 49 20.686 | -30 18 40.52 | 1.9 | |||||||
| Total | 15.5 | ||||||||
| NGC5347 | 2 | 0.00779 | 13 53 17.803 | 33 29 26.77 | 0.8 | 0.3 | 45 | U | |
| Mrk463 | 2 | 0.05047 | 13 56 2.886 | 18 22 18.68 | †43.6 | 1.2 | 1174 | L | 177 |
| 13 56 2.890 | 18 22 17.46 | 3.6 | |||||||
| 13 56 2.895 | 18 22 17.85 | 0.4 | |||||||
| Total | 47.2 | ||||||||
| NGC5506 | 2 | 0.00580 | 14 13 14.880 | -03 12 27.68 | 67.6 | 3.2 | 360 | D+U | |
| NGC5548∗ | 1 | 0.01728 | 14 17 59.541 | 25 08 12.65 | 2.2 | 0.1 | 34 | U | |
| Mrk817 | 1 | 0.03148 | 14 36 22.084 | 58 47 39.38 | 2.8 | 0.2 | 122 | U | |
| F15091-2107 | 1 | 0.04457 | 15 11 59.803 | -21 19 01.52 | 7.8 | 0.2 | 173 | S | 2 |
| NGC5929∗ | 2 | 0.00835 | 15 26 06.109 | 41 40 14.05 | †9.1 | 1.3 | 210 | L | 60 |
| 15 26 06.167 | 41 40 14.42 | 1.1 | |||||||
| 15 26 06.208 | 41 40 14.68 | 6.5 | |||||||
| Total | 16.8 | ||||||||
| NGC5953 | 2 | 0.00660 | 15 34 32.382 | 15 11 37.44 | 1.1 | 0.3 | 38 | U | |
| UGC9913(Arp220) | sb(2) | 0.01819 | 15 34 57.267 | 23 30 12.13 | 77.2 | 1.0 | 353 | L | 100 |
| 15 34 57.336 | 23 30 11.96 | †63.0 | |||||||
| Total | 140.3 | ||||||||
| MCG-2-40-4 | 2 | 0.02438 | 15 48 24.962 | -13 45 27.22 | †2.4 | 0.8 | 378 | L | 121 |
| 15 48 25.006 | -13 45 27.61 | 0.6 | |||||||
| Total | 3.0 | ||||||||
| F15480-0344 | 2 | 0.03038 | 15 50 41.498 | -03 53 18.06 | 12.4 | 0.1 | 59 | U | |
| NGC6890 | 2 | 0.00809 | 20 18 16.467 | -44 48 36.50 | 0.6 | 22.7 | 3563 | A | |
| 20 18 17.346 | -44 48 17.30 | 0.4 | |||||||
| 20 18 18.092 | -44 48 21.78 | †0.5 | |||||||
| Total | 1.5 | ||||||||
| Mrk509 | 1 | 0.03458 | 20 44 9.744 | -10 43 24.73 | 2.2 | 0.1 | 67 | U | |
| UGC11680(Mrk897) | 2 | 0.02638 | 21 07 45.858 | 03 52 40.45 | 3.5 | 0.1 | 51 | U | |
| NGC7130(IC5135) | 2 | 0.01619 | 21 48 19.522 | -34 57 04.79 | 18.1 | 0.6 | 188 | S | 165 |
| NGC7172 | 2 | 0.00859 | 22 02 1.888 | -31 52 10.47 | 4.7 | 0.4 | 67 | S | 18 |
| F22017+0319 | 2 | 0.06595 | 22 04 19.141 | 03 33 52.17 | 0.2 | 2.1 | 2686 | L | 163 |
| 22 04 19.163 | 03 33 51.22 | 0.6 | |||||||
| 22 04 19.184 | 03 33 50.12 | †1.2 | |||||||
| Total | 2.0 | ||||||||
| NGC7213 | 1 | 0.00590 | 22 09 16.200 | -47 09 58.86 | 183.8 | 0.6 | 69 | U | |
| 3C445 | 1 | 0.05616 | 22 23 49.540 | -02 06 12.87 | 58.1 | ||||
| NGC7314 | 1 | 0.00480 | 22 35 46.155 | -26 02 57.87 | 1.0 | 3.8 | 353 | L | 173 |
| 22 35 46.191 | -26 03 01.60 | †0.7 | |||||||
| Total | 1.7 | ||||||||
| MCG-3-58-7 | 2 | 0.03158 | 22 49 37.106 | -19 16 23.23 | 0.5 | 3.2 | 1960 | L | 169 |
| 22 49 37.148 | -19 16 26.34 | †0.4 | |||||||
| Total | 0.9 | ||||||||
| NGC7469∗ | 1 | 0.01598 | 23 03 15.616 | 08 52 26.12 | 16.0 | 0.2 | 62 | S | 107 |
| NGC7496 | 2 | 0.00550 | 23 09 47.282 | -43 25 40.05 | 3.8 | 0.4 | 43 | U | |
| NGC7582 | 2 | 0.00530 | 23 18 23.638 | -42 22 13.35 | 51.8 | 10.2 | 1046 | D | |
| NGC7590 | 2 | 0.00500 | 0.2 | ||||||
| NGC7603(Mrk530)∗ | 1 | 0.02957 | 23 18 56.653 | 00 14 37.96 | 3.3 | 0.2 | 115 | U | |
| NGC7674(Mrk533)∗ | 2 | 0.02899 | 23 27 56.680 | 08 46 44.33 | †12.8 | 0.8 | 450 | L | 117 |
| 23 27 56.712 | 08 46 44.13 | 27.0 | |||||||
| Total | 39.8 | ||||||||
| CGCG381-051 | 2 | 0.03048 | 23 48 41.709 | 02 14 23.25 | 0.6 | 0.1 | 59 | U |
Radio parameters for all observed sources from the extended 12 m AGN sample are given in Table 2; radio parameters derived by ? for 19 sources which belong to the CfA sample have also been included. The table is organized as follows; Column 1: Galaxy name. An asterisk () is used to indicate those sources whose radio parameters are taken from ?. Column 2: Seyfert type. For this paper objects are classified simply as type 1 or type 2 following ? except where alternative classifications have been proposed by ? (9 sources) and ? (NGC 34). Reclassified sources are labeled using the following the abbreviations; Q for Quasar, L for LINER and sb for Starburst. For these sources, the classification given by Rush et al is given in parenthesis. Column 3: Redshift, as taken from ?. Columns 4 and 5: Right ascension, RA (h, m, s), and declination, Dec (deg, arcmin, arcsec), of each radio component in J2000 co–ordinates. Positions were determined by Gaussian fitting. For point–like sources the accuracy of fit, estimated by comparing the modelled and measured flux densities, was found to be around 5%. Column 6: Integrated flux density of each component, S (mJy/beam). The mean flux density of each component was measured directly from the map. Care was taken to ensure that the effects of non–zero background levels were taken into account. The uncertainty on each flux measurement may be estimated by combining the calibration error (? estimated a value of around 4%) and the map error for each source (around 4% for strong sources and 14% for weak sources). For those sources which were not detected an upper limit on their radio flux of 5– has been assumed. In multiple component sources the component nearest the photographic position (taken from NED) is labeled with a dagger symbol (). Ninety–three percent of the sources had at least one radio component within 2– of the available photographic position; of the others, four show close alignment between the radio position and the galactic centre as judged from Palomar Sky Survey images (MCG-3-7-11, NGC 5194 = M51, NGC 5033 and NGC 5005) and 2 have been excluded from further analysis (NGC 4922A/B and NGC 5135). The sky density of sources above the average 3– detection threshold of 159 Jy at 8.4 GHz has been estimated by ? and implies a 2% probability of detecting an unrelated source within the 51 51 arcsec2 field–of–view. Column 7: Maximum angular size of radio structure in arcseconds, . For unresolved sources an upper limit to the angular size was taken as one third of the major axis of the beam. For slightly resolved sources the angular size was taken as the length of the major axis of the nominal deconvolution222The nominal deconvolution is obtained when the Gaussian fit to a component is deconvolved from the CLEAN beam for single Gaussian fits, or the maximum separation of the peaks for multiple Gaussian fits. For all other sources the maximum size measured was either the maximum peak separation (for those sources with point–like components) or the maximum size at the lowest contour (for those sources with diffuse components). Column 8: Maximum linear size in parsecs, D, assuming H∘ = 75 km s-1Mpc-1. Column 9: Type of radio structure, Trad, according to the notation used by ?: U for single unresolved sources, S for single slightly–resolved sources, A for sources with ambiguous structures, D for sources with diffuse structures and L for sources with possible linear structures (sources with two components, sources with three or more aligned components or sources with extended linear components). Gaussian fitting was used to distinguish between types U and S, type S sources had a signal to noise ratio greater than 20 and a nominal deconvolution size greater than one third of the beam at FWHM. Column 10: Position angle of radio structure, PA, measured North to East from 0∘ to 180∘. For partially resolved sources (type S) the position angle of the nominal deconvolution was used. The position angle of clearly resolved linear sources (type L) was measured directly from the map.
5 THE IDENTIFICATION OF RADIO-LOUD SOURCES

The distinction between ‘radio–loud’ and ‘radio–quiet’ AGN (?; ?) is widely accepted and usually thought to result from truly distinguishable physical processes (e.g. ?). In this section we describe the identification of five radio–loud objects in the extended 12 m AGN sample (OJ 287, 3C 120, 3C 234, 3C 273 and 3C 445); these sources will be excluded from further statistical analysis and henceforth the remaining sources will be referred to as the extended 12 m Seyfert sample.
We have chosen to use the radio to far–infrared luminosity ratio as the main diagnostic of ‘radio–loudness’. This has been done by using IRAS FSC 60 m luminosities and our newly–measured 8.4 GHz (3.6 cm) radio luminosities; single–dish radio observations from ? were used for the two unobserved radio–loud objects, 3C 120 and 3C 273, and 3C 445 for which the majority of the flux is outside the field–of–view of the new observations. The radio to far–infrared luminosity ratio is probably a more useful indicator of radio–loudness than the radio luminosity alone given that the bolometric luminosities of the sources in the sample are likely to span several orders of magnitude. Figure 2 is a histogram showing the frequency of sources in the extended 12 m AGN sample per logarithmic radio to far–infrared luminosity ratio interval log(L3.6cm/L60μm) = 0.4; the L3.6cm/L60μm ratio for each detected source is given in Table 5. The 5 excluded sources have the highest radio to far–infrared luminosity ratios of the sample; all have log(L3.6cm/L60μm) ratios greater than -4.6, whereas log(L3.6cm/L60μm) ratios are less than -5.1 for the Seyferts. These values are in agreement with the radio to far–infrared luminosity ratios used by ? to identify 3 of the same radio–loud sources in the original 12 m AGN sample (OJ287, 3C 120 and 3C 273). The mean ratio between the 8.4 GHz A–configuration flux to the 5 GHz D–configuration flux for those sources observed by ? is around 0.3; this ratio is consistent with a mean radio spectral index of = -0.7 (?) and a A–configuration to D–configuration flux ratio of around 0.5. Using this flux ratio, the radio to far–infrared luminosity ratios used by ? translate to -4.7 log(L3.6cm/L60μm) -2.3 for radio–loud sources and -6.3 log(L3.6cm/L60μm) -4.8 for radio–quiet sources.
Note that there is no clear evidence for a bimodal distribution of the radio to far–infrared luminosity ratio, possibly because of the infrared flux-limit used to define the sample. As well as having the highest radio to far–infrared luminosity ratios, the radio–loud sources we have identified are also the 5 most radio luminous sources in the sample, being the only sources more luminous than L3.6cm 1024 WHz. They are all well–known objects with powerful jets; three show super–luminal motions in their jet components (OJ287, 3C120 and 3C273, as cited by ?) and the other two are classical FR–II radio galaxies with radio structures hundreds of kiloparsecs in size (see ? and ? for images of 3C234 and 3C445 respectively). A strong reason for excluding these sources is that they are broad–line objects which, when grouped with the Seyfert 1 subsample, would systematically affect comparisons between the two Seyfert types.
| Source | log(Lrad/Lir) | Source | log(Lrad/Lir) |
|---|---|---|---|
| 3C 273 | -3.10 | Mrk 1034 | -7.29 |
| 3C 120 | -4.15 | Mrk 509 | -7.32 |
| OJ 287 | -4.31 | NGC 1241 | -7.33 |
| 3C 234 | -4.39 | F22017+0319 | -7.35 |
| 3C 445 | -4.54 | Mrk 273 | -7.35 |
| Mrk 348 | -5.14 | NGC 3516 | -7.35 |
| F01475-0740 | -5.45 | F03362-1642 | -7.36 |
| NGC 7213 | -5.69 | NGC 3227 | -7.36 |
| F05563-3820 | -5.75 | MGC-3-7-11 | -7.40 |
| NGC 2639 | -5.76 | Arp 220 | -7.41 |
| Mrk 6 | -6.03 | Mrk 817 | -7.43 |
| Mrk 231 | -6.10 | MGC-2-33-34 | -7.45 |
| Mrk 463 | -6.19 | UGC 11680 | -7.45 |
| NGC 4594 | -6.21 | NGC 1386 | -7.47 |
| NGC 4151 | -6.41 | Mrk 9 | -7.48 |
| F15480-0344 | -6.47 | Mrk 618 | -7.49 |
| NGC 5506 | -6.51 | NGC 7130 | -7.49 |
| F03450+0055 | -6.63 | TOL1238-364 | -7.50 |
| IC 4329A | -6.67 | NGC 1194 | -7.52 |
| NGC 7674 | -6.67 | NGC 7582 | -7.53 |
| MGC-3-34-63 | -6.69 | NGC 4388 | -7.57 |
| Mrk 1239 | -6.72 | NGC 34 | -7.58 |
| NGC 4579 | -6.74 | E541-IG12 | -7.59 |
| Mrk 335 | -6.75 | NGC 7172 | -7.61 |
| NGC 424 | -6.75 | MGC-2-40-4 | -7.66 |
| F13349+2438 | -6.78 | NGC 7469 | -7.77 |
| F15091-2107 | -6.83 | NGC 4593 | -7.79 |
| NGC 3031 | -6.83 | NGC 5347 | -7.80 |
| UGC 5101 | -6.93 | F05189-2524 | -7.81 |
| NGC 1068 | -6.94 | F08572+3915 | -7.81 |
| NGC 2992 | -6.95 | NGC 1320 | -7.85 |
| F07599+6508 | -7.00 | NGC 5005 | -7.93 |
| NGC 1125 | -7.02 | I ZW 1 | -7.94 |
| NGC 526A | -7.04 | NGC 7496 | -7.95 |
| NGC 513 | -7.07 | NGC 6890 | -7.96 |
| Mrk 704 | -7.11 | CGCG381-051 | -7.99 |
| NGC 4941 | -7.11 | MGC-3-58-7 | -8.00 |
| NGC 7603 | -7.11 | NGC 7314 | -8.01 |
| MGC-5-13-17 | -7.12 | NGC 1667 | -8.13 |
| NGC 4968 | -7.15 | NGC 5033 | -8.44 |
| Mrk 766 | -7.17 | NGC 3982 | -8.46 |
| NGC 5548 | -7.20 | NGC 1365 | -8.48 |
| F04385-0828 | -7.21 | NGC 1056 | -8.50 |
| Mrk 79 | -7.22 | NGC 5953 | -8.55 |
| NGC 5256 | -7.22 | NGC 1097 | -8.71 |
| NGC 1143/4 | -7.23 | NGC 4051 | -8.77 |
| NGC 3079 | -7.26 | NGC 5194 | -9.86 |
| NGC 5929 | -7.28 |
6 SUMMARY
The maps presented in this paper reveal for the first time the sub–arcsecond radio structures of Seyferts contained in the extended 12 m AGN sample. They provide a large and homogeneously–selected database for investigating the generic properties of compact radio cores in Seyfert nuclei.
Seventy–five of the 87 sources observed were detected; 36 contain single unresolved radio sources, 13 contain single slightly–resolved radio sources, 9 contain radio sources with diffuse or ambiguous structures, 8 contain radio sources with two distinguishable components and 9 contain radio sources with three or more linearly–aligned components or extended linear structures. Subsequent papers will discuss the statistical properties of the sample in detail, paying particular attention to comparisons of the radio powers and radio morphologies of the two Seyfert types.
7 ACKNOWLEDGMENTS
AHCT would like to acknowledge the receipt of a studentship from the Particle Physics and Astronomy Research Council and a visit funded by the STScI visitor program. Part of this research was supported by the European Commission, TMR Programme, Research Network Contract ERBFMRXCT96-0034 “CERES”. We have made use of NASA’s Astrophysics Data System Abstract Service, the NASA/IPAC Extragalactic database (NED), which is operated by the Jet Propulsion Laboratory.
References
- [Argyle & Eldridge¡1990¿] Argyle R. W., Eldridge P., 1990, MNRAS, 243, 504
- [Barcons et al.¡1995¿] Barcons X., Franceschini A., De Zotti G., Danese L., Miyaji T., 1995, ApJ, 455, 480
- [Baum et al.¡1993¿] Baum S. A., O’Dea C. P., Dallacasa D., de Bruyn A., Pedlar A., 1993, ApJ, 419, 553
- [Bicknell et al.¡1998¿] Bicknell G. V., Dopita M. A., Tsvetanov Z. I., Sutherland R. S., 1998, ApJ, 495, 680
- [Capetti et al.¡1999¿] Capetti A., Axon D. J., Macchetto F. D., Marconi A., Winge C., 1999, ApJ, 516, 187
- [Clements¡1981¿] Clements E. D., 1981, MNRAS, 197, 829
- [Clements¡1983¿] Clements E. D., 1983, MNRAS, 204, 811
- [Colbert et al.¡1996¿] Colbert E., Baum S., Gallimore J., O’Dea C., Christensen J., 1996, ApJ, 467, 551
- [Condon et al.¡1991¿] Condon J., Huang Z.-P., Yin Q., Thuan T., 1991, ApJ, 378, 65
- [de Bruyn & Wilson¡1976¿] de Bruyn A. G., Wilson A. S., 1976, A&A, 53, 93
- [Dopita et al.¡1998¿] Dopita M. A., Heisler C., Lumsden S., Bailey J., 1998, ApJ, 498, 570
- [Edelson¡1987¿] Edelson R. A., 1987, ApJ, 313, 651
- [Falcke et al.¡1998¿] Falcke H., Wilson A. S., Simpson C., 1998, ApJ, 502, 199
- [Ghosh & Soundararajaperumal¡1995¿] Ghosh K. K., Soundararajaperumal S., 1995, ApJS, 100, 37
- [Giuricin et al.¡1990¿] Giuricin G., Mardirossian F., Mezzetti M., Bertotti G., 1990, ApJS, 72, 551
- [Giuricin et al.¡1996¿] Giuricin G., Fadda D., Mezzetti M., 1996, ApJ, 468, 475
- [Haniff et al.¡1988¿] Haniff C., Wilson A., Ward M., 1988, ApJ, 334, 104
- [Helou et al.¡1995¿] Helou G., Madore B., Schmitz M., Wu X., Corwin H., LaGue Jr. C. Bennett J., Sun H. in Egret D., Albrecht M. A., eds, Information and On-Line Data in Astronomy, p. 95, Kluwer, Dordrecht, 1995
- [Hummel et al.¡1982¿] Hummel E., Fanti C., Parma P., Schilizzi R. T., 1982, A&A, 114, 400
- [Hunt & Malkan¡1999¿] Hunt L. K., Malkan M. A., 1999, ApJ, 516, 660
- [Kellerman et al.¡1989¿] Kellerman K. I., Sramek R., Schmidt M., Shaffer D. B., Green R., 1989, AJ, 98, 1195
- [Knapen et al.¡1997¿] Knapen J. H., Laine S., Yates J., Richards A., Doyon R., Nadeau D., 1997, ApJ, 490, L29
- [Kukula et al.¡1993¿] Kukula M. J., Ghosh T., Pedlar A., Schilizzi R. T., Miley G. K., de Bruyn A. G., Saikia D. J., 1993, MNRAS, 264, 893
- [Kukula et al.¡1995¿] Kukula M. J., Pedlar A., Baum S. A., O’Dea C. P., 1995, MNRAS, 276, 1262
- [Kukula et al.¡1996¿] Kukula M. J., Holloway A., Pedlar A., Meaburn J., Lopez J. A., Axon D. J., Schilizzi R. T., 1996, MNRAS, 280, 1283
- [Kukula et al.¡1999¿] Kukula M. J., Ghosh T., Pedlar A., Schilizzi R. T., 1999, ApJ, 518, 117
- [Leahy et al.¡1986¿] Leahy J. P., Pooley G. G., Riley J. M., 1986, MNRAS, 222, 753
- [Leahy et al.¡1997¿] Leahy J. P., Black A. R. S., Dennett-Thorpe J., Hardcastle M. J., Komissarov S., Perley R. A., Riley J. M., Scheuer P. A. G., 1997, MNRAS, 291, 20
- [Mazzarella et al.¡1991¿] Mazzarella J., Gaume R., Soifer B., Graham J., Neugebauer G., Matthews K., 1991, AJ, 102, 1241
- [Meurs & Wilson¡1984¿] Meurs E. J., Wilson A. S., 1984, A&A, 136, 206
- [Miles et al.¡1996¿] Miles J., Houck J., Hayward T., Ashby L., 1996, ApJ, 465, 191
- [Miller et al.¡1990¿] Miller L., Peacock J., Mead A., 1990, MNRAS, 244, 207
- [Moshir¡1991¿] Moshir M. et al. Explanatory Supplement to the IRAS Faint Source Survey, Version 2. 1991, (Pasadena:JPL)
- [Mulchaey et al.¡1996¿] Mulchaey J. S., Wilson A. S., Tsvetanov Z., 1996, ApJS, 102, 309
- [Nagar et al.¡1999¿] Nagar N. M., Wilson A. S., Mulchaey J. S., Gallimore J. F., 1999, ApJS, 120, 209
- [Patnaik et al.¡1992¿] Patnaik A., Browne I. W. A., Wilkinson P. N., Wrobel J. W., 1992, MNRAS, 254, 665
- [Pedlar et al.¡1993¿] Pedlar A., Kukula M. J., Longley D. P. T., Muxlow T. W. B., Axon D. J., Baum S., O’Dea C. P., Unger S. W., 1993, MNRAS, 263, 471
- [Roy et al.¡1994¿] Roy A., Norris R. P., Kesteven M. J., Troup E. R., Reynolds J. E., 1994, ApJ, 432, 496
- [Roy et al.¡1998¿] Roy A., Norris R. P., Kesteven M. J., Troup E. R., Reynolds J. E., 1998, MNRAS, 301, 1019
- [Rush et al.¡1993¿] Rush B., Malkan M. A., Spinoglio L., 1993, ApJS, 89, 1
- [Rush et al.¡1996¿] Rush B., Malkan M. A., Edelson R., 1996, ApJ, 473, 130
- [Smith et al.¡1998¿] Smith H., Lonsdale C., Lonsdale C., Diamond P., 1998, ApJ, 493, L17
- [Spinoglio & Malkan¡1989¿] Spinoglio L., Malkan M. A., 1989, ApJ, 342, 83
- [Steffen et al.¡1997¿] Steffen W., Gómez J. L., Raga A. C., Williams R., 1997, ApJ, 491, L73
- [Telesco et al.¡1993¿] Telesco C., Dressel L., Wolstencroft R., 1993, ApJ, 414, 120
- [Thompson et al.¡1980¿] Thompson A., Clark B., Wade C. M., Napier P. J., 1980, ApJS, 44, 151
- [Ulvestad & Wilson¡1984a¿] Ulvestad J. S., Wilson A. S., 1984a, ApJ, 278, 544
- [Ulvestad & Wilson¡1984b¿] Ulvestad J. S., Wilson A. S., 1984b, ApJ, 285, 439
- [Ulvestad & Wilson¡1989¿] Ulvestad J. S., Wilson A. S., 1989, ApJ, 343, 659
- [Ulvestad et al.¡1987¿] Ulvestad J., Neff S., Wilson A., 1987, AJ, 93, 22
- [Unger et al.¡1987¿] Unger S., Lawrence A., Wilson A., Elvis M., Wright A., 1987, MNRAS, 228, 521
- [Uomoto et al.¡1993¿] Uomoto A., Cagnof S., Ford H., Rosenblatt E., Antonucci R., Evans I., Cohen R., 1993, AJ, 105, 1308
- [Wade¡1968¿] Wade C., 1968, AJ, 73, 876
- [Wehrle & Morris¡1987¿] Wehrle A., Morris M., 1987, ApJ, 313, L43
- [Wehrle & Morris¡1988¿] Wehrle A., Morris M., 1988, AJ, 95, 1689
- [Weiler et al.¡1986¿] Weiler K. W., Sramek R. A., Pangia N., van der Hulst J. M., Salvati M., 1986, ApJ, 301, 790
- [Whittle et al.¡1988¿] Whittle M., Pedlar A., Meurs E., Unger S., Axon D., Ward M., 1988, ApJ, 326, 125
- [Whittle¡1992¿] Whittle M., 1992, ApJS, 79, 49
- [Wilson & Colbert¡1995¿] Wilson A. S., Colbert E. J. M., 1995, ApJ, 438, 62
- [Wilson et al.¡1995¿] Wilson A., Braatz J. A., Henkel C., 1995, ApJ, 455, L129
- [Windhorst et al.¡1993¿] Windhorst R. A., Fomalont E. B., Partridge R. B., Lowenthal J. D., 1993, ApJ, 405, 498
- [Wright et al.¡1991¿] Wright A., Wark R., Troup E., Otrupcek R., Jennings D., Hunt A., Cooke D., 1991, MNRAS, 251, 330
- [Wynn-Williams & Becklin¡1993¿] Wynn-Williams C., Becklin E., 1993, ApJ, 412, 535