DUSTY TORI OF SEYFERT NUCLEI
1. INTRODUCTION
Dusty tori around active galactic nuclei (AGNs) play an important role in the classification of Seyfert galaxies. (Antonucci & Miller 1985; see also Antonucci 1993 for a review). Seyfert galaxies observed from a face-on view of the torus are recognized as type 1 Seyferts (S1s) while those observed from an edge-on view are recognized as type 2 Seyferts (S2s). Therefore, physical properties of dusty tori are of great interest. We briefly introduce three statistical studies investigating properties of dusty tori; 1) physical sizes of dusty tori based on water-vapor maser emission (Taniguchi & Murayama 1998), 2) ionization condition of the inner wall of tori based on high-ionization emission lines (Murayama & Taniguchi 1998a,b), and 3) viewing angle toward dusty tori based on mid-infrared color (Murayama, Mouri, & Taniguchi 2000). Please see references for detailed discussion.
2. Dusty Tori of Seyfert Nuclei Posed by the Water Vapor Maser Emission
2.1. Water Vapor Maser Emission in Active Galactic Nuclei
The recent VLBI/VLBA measurements of the H2O maser emission of the nearby AGNs, NGC 1068 (Gallimore et al. 1996; Greenhill et al. 1996; Greenhill & Gwinn 1997), NGC 4258 (Miyoshi et al. 1995; Greenhill et al. 1995a, 1995b), and NGC 4945 (Greenhill, Moran, & Herrnstein 1997), have shown that the masing clouds are located at distances of 0.1 – 1 pc from the nuclei. These distances are almost comparable to those of molecular/dusty tori which are the most important ingredient to explain the observed diversity of AGN (Antonucci & Miller 1985; Antonucci 1993). It is therefore suggested that the masing clouds reside in the tori themselves (e.g., Greenhill et al. 1996). Therefore, the H2O maser emission provides a useful tool to study physical properties of dusty tori which are presumed to be the fueling agent onto the supermassive black hole (cf. Krolik & Begelman 1988; Murayama & Taniguchi 1997).
2.2. A Statistical Size of the Dusty Tori Inferred from the Frequency of Occurrence of H2O Masers
The recent comprehensive survey of the H2O maser emission for 350 AGNs by Braatz et al. (1997; hereafter BWH97) has shown that the H2O maser emission has not yet been observed in S1s and that the S2s with the H2O maser emission have the higher H I column densities toward the central engine. It is hence suggested strongly that the maser emission can be detected only when the dusty torus is viewed from almost edge-on views. This is advocated by the ubiquitous presence of so-called the main maser component whose velocity is close to the systemic one whenever the maser emission is observed because this component arises from dense molecular gas clouds along the line of sight between the background amplifier (the central engine) and us (see, e.g., Miyoshi et al. 1995; Greenhill et al. 1995b).
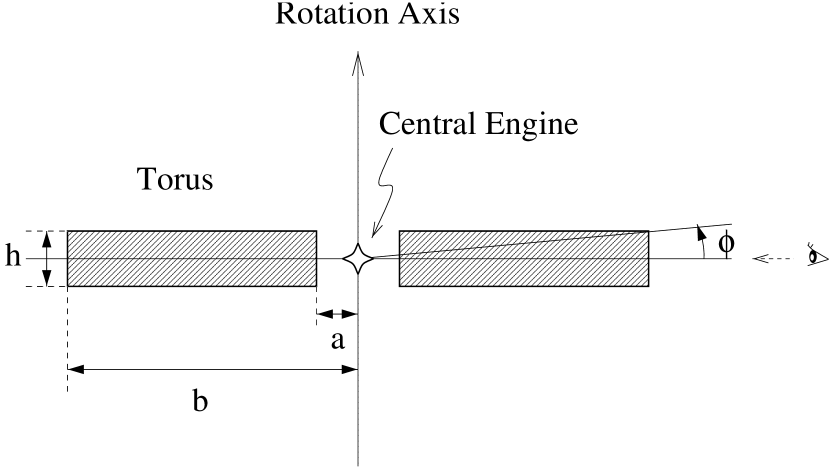
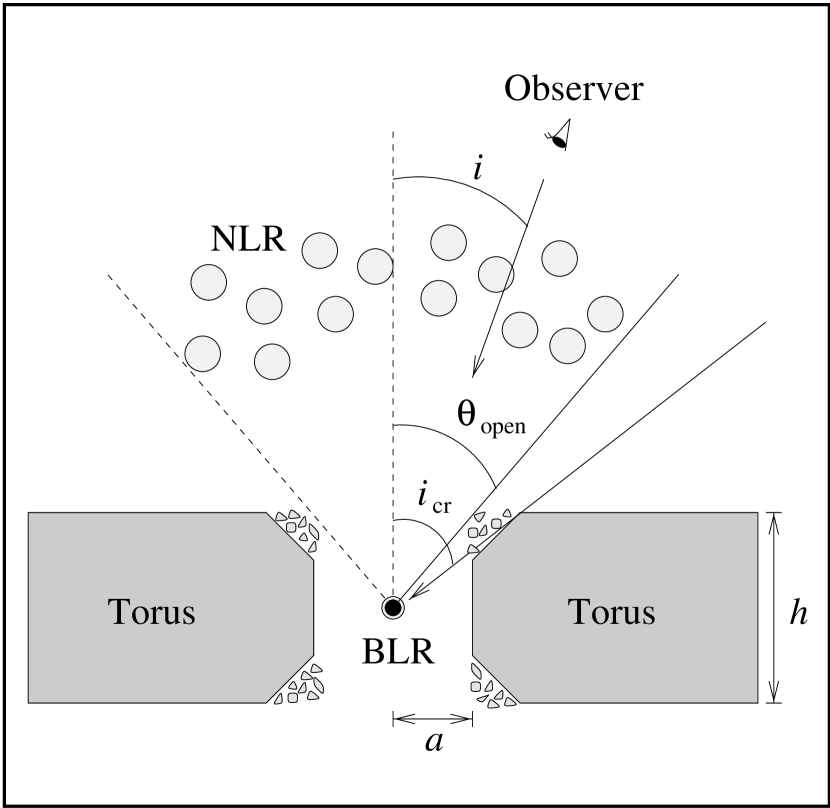
Since the high H I column density is achieved only when we see the torus within the aspect angle, (see Figure 1), we are able to estimate because the detection rate of H2O maser, , emission can be related to the aspect angle as, where and are the numbers of AGN with the H2O maser emission and without the H2O maser emission, respectively. This relation gives the outer radius, . Table 1 shows that a typical detection rate is 0.05. However, this value should be regarded as a lower limit because some special properties of may be necessary to cause the maser emission (Wilson 1998). If we take account of new detections of H2O maser emission from NGC 5793 (Hagiwara et al. 1997) and NGC 3735 (Greenhill et al. 1997b) which were discovered by two other maser surveys independent from BWH97, the detection rate may be as high as 0.1 (Wilson 1998). Therefore, we estimate values for the two cases; 1) = 0.05, and = 0.1. These two rates correspond to the aspect angles, and , respectively. In Table 2, we give the estimates of for three cases, = 0.1, 0.5, and 1 pc. If 1 pc, the H I column density becomes lower than cm-1 given . Therefore, it is suggested that the inner radius may be in a range between 0.1 pc and 0.5 pc for typical Seyfert nuclei. The inner radii of the H2O masing regions in NGC 1068, NGC 4258, and NGC 4945 are indeed in this range (Greenhill et al. 1996; Miyoshi et al. 1997; Greenhill et al. 1997a). We thus obtain possible sizes of the dusty tori; () = (0.1 – 0.5 pc, 1.67 – 8.35 pc, 0.33 – 1.67 pc) for , and () = (0.1 – 0.5 pc, 3.29 – 16.5 pc, 0.33 – 1.67 pc) for . All the cases can achieve cm-1, being consistent with the observations (BWH97).
| Sample | (%) | ||
|---|---|---|---|
| Distance-limited | |||
| All (S1+S2+L) | 15 | 278 | 5.4 |
| Seyfert (S1+S2) | 10 | 198 | 5.1 |
| S2 | 10 | 141 | 7.1 |
| Magnitude-limited | |||
| All (S1+S2+L) | 13 | 241 | 5.4 |
| Seyfert (S1+S2) | 8 | 166 | 4.8 |
| S2 | 8 | 112 | 7.1 |
| (pc) | (pc) | aaThe radius of the hot part in the torus; . (pc) | (pc) | (cm-2) | (pc) | (cm-2) |
|---|---|---|---|---|---|---|
| 0.1 | 0.33 | 0.43 | 3.29 | 1.67 | ||
| 0.5 | 1.67 | 2.17 | 16.5 | 8.35 | ||
| 1 | 3.30 | 4.30 | 32.9 | 16.7 | ||
3. High-Ionization Nuclear Emission-Line Regions on the Inner Surface of Dusty Tori
3.1. High-Ionization Emission Lines in Seyfert Galaxies
Optical spectra of active galactic nuclei (AGN) show often very high ionization emission lines such as [Fe VII], [Fe X], and [Fe XIV] (the so-called coronal lines). According to the current unified models (Antonucci & Miller 1985; Antonucci 1993), it is generally believed that a dusty torus surrounds both the central engine and the BLR. Since the inner wall of the torus is exposed to intense radiation from the central engine, it is naturally expected that the wall can be one of the important sites for the HINER (Pier & Voit 1995). If the inner wall is an important site of HINER, it should be expected that the S1s would tend to have more intense HINER emission because the inner wall would be obscured by the torus itself in S2s.
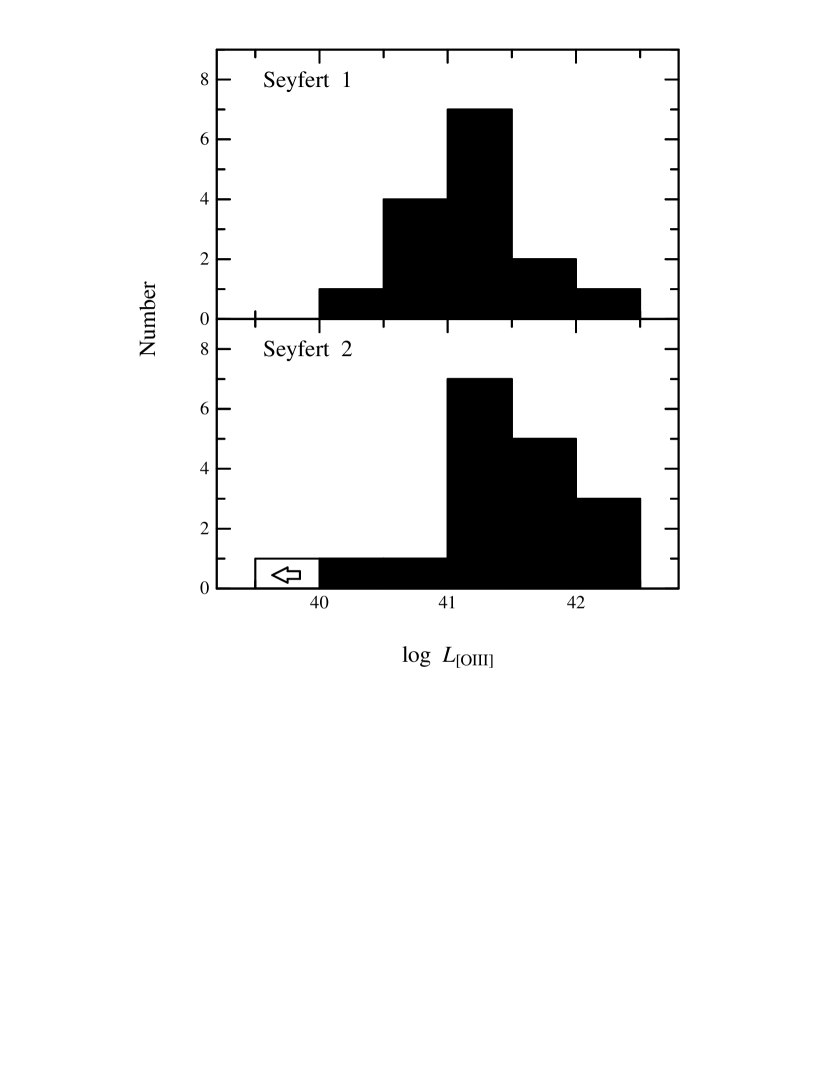
In order to examine whether or not the S1s tend to have the excess HINER emission, we study the frequency distributions of the [Fe VII] 6087/[O III] 5007 intensity ratio between S1s and S2s. The data were compiled from the literature (Osterbrock 1977, 1985; Koski 1978; Osterbrock & Pogge 1985; Shuder & Osterbrock 1981) and our own optical spectroscopic data of one S1 (NGC 4051) and four S2s (NGC 591, NGC 5695, NGC 5929, and NGC 5033). In total, our sample contains 18 S1s and 17 S2s. The result is shown in Figure 2. It is shown that the S1s are strong [Fe VII] emitters than the S2s. In order to verify that this difference is really due to the excess [Fe VII] emission, we compare the [O III] luminosity between the S1s and S2s and find that the [O III] luminosity distribution is nearly the same between the S1s and the S2s (Figure 3). Therefore, we conclude that the higher [Fe VII]/[O III] intensity ratio in the S1s is indeed due to the excess [Fe VII] emission rather than the weaker [O III] emission in the S1s. The presence of an excess [Fe VII] emission in S1s can only be explained if there is a fraction of the inner HINER that cannot be seen in the S2s. The height of the inner wall is of order 1 pc (Gallimore et al. 1997; Pier & Krolik 1992, 1993). Therefore, given that the torus obscures this HINER from our line of sight, the effective height of the torus should be significantly higher than 1 pc.

3.2. Three-Component HINER
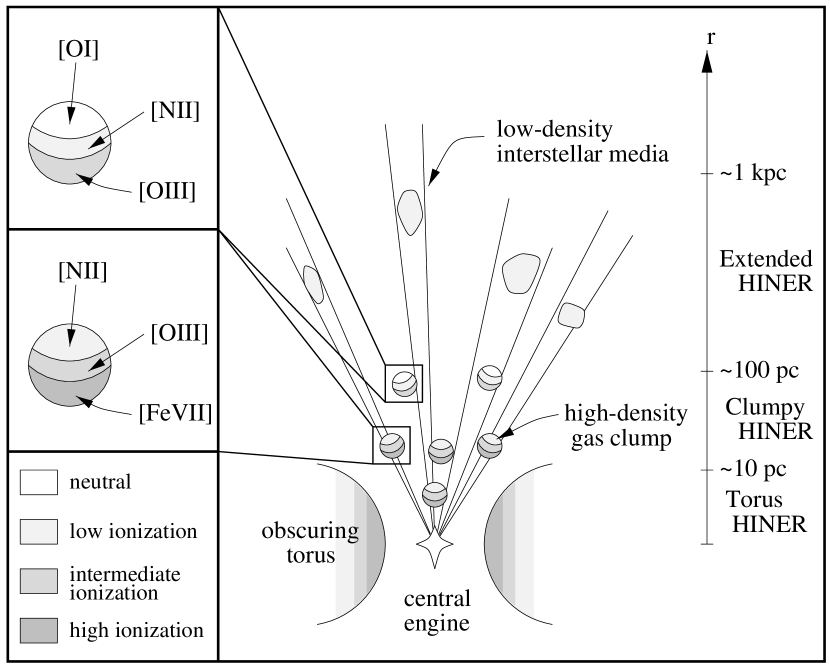
Although our new finding suggests strongly that part of the HINER emission arises from the inner walls of dusty tori, it is remembered that a number of S2s have the HINER. In fact, the fraction of Seyfert nuclei with the HINER is nearly the same between the S1s and the S2s (Osterbrock 1977; Koski 1978). If the HINER was mostly concentrated in the inner 1 pc region, we would observe the HINER only in the S1s. Therefore the presence of HINER in the S2s implies that there is another HINER component which has no viewing-angle dependence. A typical dimension of such a component is of order 100 pc like that of the NLR. In addition, it is also known that some Seyfert nuclei have an extended HINER whose size amounts up to 1 kpc (Golev et al. 1994; Murayama, Taniguchi, & Iwasawa 1998). The presence of such extended HINERs is usually explained as the result of very low-density conditions in the interstellar medium ( cm-3) makes it possible to achieve higher ionization conditions (Korista & Ferland 1989).
The arguments described here suggest strongly that there are three kinds of HINER; 1) the torus HINER ( pc), 2) the HINER associated with the NLR ( pc), and 3) the very extended HINER ( 1 kpc). A schematic illustration of the HINER is shown in Figure 4.
3.3. Dual-Component Photoionization Calculations for HINER
Any single-component photoionization models underpredict higher ionization emission lines (see Murayama & Taniguchi 1998b and references therein). We therefore proceed to construct dual-component models in which the inner surface of a torus is introduced as a new ionized-gas component in addition to the traditional NLR component with the photoionization code CLOUDY (Ferland 1996). The single-cloud model suggests that the ionization parameter lies in the range of – . As for the electron density, it is often considered that the inner edges of tori have higher electron densities, e.g., cm-3 (Pier & Voit 1995). Because the largest [Fe VII]/[O III] ratio of the observed data is , [Fe VII]/[O III] of the torus component must be greater than 0.5. However, we find that ionization-bounded models cannot explain the observed large [Fe VII]/[O III] values by simply increasing electron densities up to cm-3. Further, such very high-density models yield unusually strong [O I] emission with respect to [O III]. We therefore assume “truncated” clouds with both large [Fe VII]/[O III] ratios and little low-ionization lines for the HINER torus. The calculations were stopped at a hydrogen column density when [Fe VII]/[O III] . We performed photoionization calculations described above and we finally adopted the model with cm-3 and representative model for the HINER torus with taking [Fe X]/[Fe VII] ratios predicted by the calculations into account.
Now we can construct dual-component models combining this torus component model with the NLR models. In Figure 5, we present the results of the dual-component models. Here the lowest dashed line shows the results of the NLR component models with , , as a function of from 1 cm-3 to cm-3. If we allow the contribution from the torus component to reach up to % in the Seyferts with very high [Fe VII]/[O III] ratios, we can explain all the data points without invoking the unusual iron overabundance. Note that the majority of objects can be explained by simply introducing a % contribution from the HINER torus.

4. New Mid-Infrared Diagnostic of the Dusty Torus Model for Seyfert Nuclei
4.1. The New MIR Diagnostic
The current unified model of active galactic nuclei (AGNs) has introduced the dusty torus around the central engine (Antonucci 1993). Therefore, it is urgent to study the basic properties of dusty tori (e.g., Pier & Krolik 1992). Utilizing the anisotropic property of dusty torus emission, we propose a new MIR diagnostic to estimate a critical viewing angle of the dusty torus between type 1 and 2 AGNs.
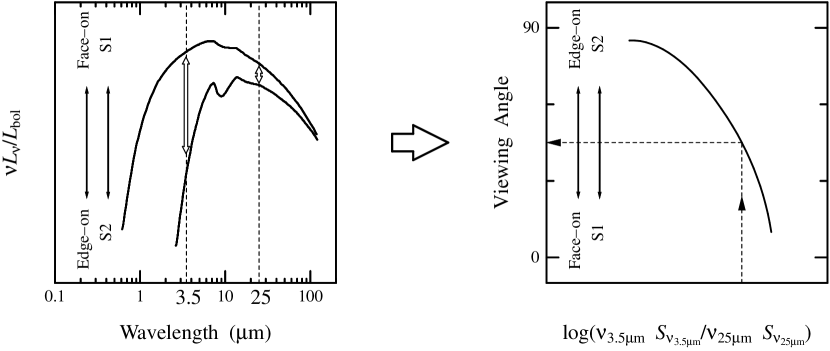
Because of the anisotropic properties of the dusty torus emission, the emission at 10 m is systematically stronger in type 1 AGNs than in type 2s while that at 20 m is not significantly different between type 1 and type 2 AGNs. Therefore the luminosity ratio between 3.5 m and 25 m is expected to be highly useful to distinguish between type 1 and 2 AGNs (Figure 6). Here we define the above ratio as
4.2. Results & Discussion


We adopt three samples chosen by different selection criteria and compiled photometric data in , , and IRAS 25 µm bands:
-
1.
18 S1s and 6 S2s from the CfA Seyfert galaxies (Huchra & Burg 1992)
-
2.
20 S1s and 4 S2s from the sample of Ward et al. (1987), which is limited by the hard X-ray flux from 2 to 10 keV
-
3.
11 S1s and 11 S2s from the sample of Roche et al. (1991), which is composed of -band bright objects
Since some objects are included in more than one sample, there are 31 S1s and 14 S2s in total.
The type 1 Seyferts are clearly distinguished from the type 2s with a critical value ; for type 1s while for type 2s (Figures 7a-d). If we apply the Kolmogrov-Smirnov (KS) test, the probability that the observed distributions of S1s and S2s originate in the same underlying population turns out to be 0.275 %.
The upper panel of Figure 8 shows the theoretical models of Pier & Krolik (1992, 1993), which are characterized by (the inner radius of the torus), (the full height of the torus), (the radial Thomson optical depth), (the vertical Thomson optical depth), and (the effective temperature of the torus) [see Figure 9]. The intersection of each model locus with gives a critical viewing angle. The critical viewing angle is expected to be nearly the same as the typical semi-opening angle of the ionization cones observed in Seyfert nuclei, 30°– 40°(cf. Lawrence 1991 and references therein). Figure 9 shows that only two models give reasonable critical viewing angles, °– 50°though these values are slightly larger than the semi-opening angle of the cone. The model with = 0.3 may be suitable for tori in Seyfert nuclei because this inner aspect ratio gives a semi-opening angle of the torus, °, being consistent with those of the observed ionized cones. Although there are some contaminations from the host galaxies, circumnuclear starbursts, and dust emission in the narrow-line regions, the new diagnostic provides a powerful tool to study the critical viewing angle.

References
- (1) Antonucci, R. 1993, ARA&A, 31, 473
- (2) Antonucci, R. R. J., Miller, J. S. 1985, ApJ, 297, 621
- (3) Braatz, J. A., Wilson, A. S., & Henkel, C. 1997, ApJS, 110, 321 (BWH97)
- (4) Ferland, G. J., 1996, University of Kentucky Department of Physics and Astronomy Internal Report
- (5) Gallimore, J. F., Baum, S. A., O’Dea, C. P., Brinks, E., Pedlar, A. 1996, ApJ, 462, 74
- (6) Gallimore, J. F., Baum, S. A., & O’Dea, C. P. 1997, Nature, 388, 852
- (7) Golev, V., Yankulova, I., Bonev, T., & Jockers, K. 1994, Astrophys. Lett. & Comm. 29, 239
- (8) Greenhill, L. J., & Gwinn, C. R. 1997, Ap&SS, 248, 261
- (9) Greenhill, L. J., Gwinn, C. R., Antonucci, R, & Barvanis, R. 1996, ApJ, 472, L21
- (10) Greenhill, L. J., Herrnstein, J. R., Moran, J. M., Menten, K. M., & Velusamy, T. 1997b, ApJ, 486, L15
- (11) Greenhill, L. J., Jiang, D. R., Moran, J. M., Reid, M. J., Lo, K. Y., & Claussen, M. J. 1995a, ApJ, 440, 619
- (12) Greenhill, L. J., Henkel, C., Becker, R., Wilson, T. L., & Wouterloot, J. G. A. 1995b, A&A, 304, 21
- (13) Greenhill, L. J., Moran, J. M., & Herrnstein, J. R. 1997a, ApJ, 481, L23
- (14) Hagiwara, Y., Kohno, K., Kawabe, R., & Nakai, N. 1997, PASJ, 49, 171
- (15) Huchra, J., & Burg, R. 1992, ApJ, 393, 90
- (16) Korista, K. T., & Ferland, G. J. 1989, ApJ, 343, 678
- (17) Koski, A. T. 1978, ApJ, 223, 56
- (18) Krolik, J. H., & Begelman, M. C. 1988, ApJ, 329, 702
- (19) Lawrence, A. 1991, MNRAS, 252, 586
- (20) Miyoshi, M., Moran, J., Herrnstein, J., Greenhill, L., Nakai, N., Diamond, P., & Inoue, M. 1995, Nature, 373, 127
- (21) Murayama, T., Mouri, H., & Taniguchi Y. 2000, ApJ, 528, 179
- (22) Murayama, T., & Taniguchi, Y. 1997, PASJ, 49, L13
- (23) Murayama, T., & Taniguchi Y. 1998a, ApJ, 497, L9
- (24) Murayama, T., & Taniguchi Y. 1998b, ApJ, 503, L115
- (25) Murayama, T., Taniguchi, Y., Iwasawa, K. 1998, AJ, 115, 460
- (26) Osterbrock, D. E. 1977, ApJ, 215, 733
- (27) Osterbrock, D. E. 1985, PASP, 97, 25
- (28) Osterbrock, D. E., & Pogge, R. W. 1985, ApJ, 297, 166
- (29) Pier, E. A., & Krolik, J. H. 1992, ApJ, 401, 99
- (30) Pier, E. A., & Krolik, J. H. 1993, ApJ, 418, 673
- (31) Pier, E. A., & Voit, G. M. 1995, ApJ, 450, 628
- (32) Roche, P. F., Aitken, D. K., & Smith, C. H. 1991, MNRAS, 252, 282
- (33) Shuder, J. M. & Osterbrock, D. E. 1981, ApJ, 250, 55
- (34) Taniguchi, Y., & Murayama, T. 1998, ApJ, 501, L25
- (35) Ward, M. J., Elvis, M., Fabbiano, G., Carleton, N. P., Willner, S. P., & Lawrence, A. 1987, ApJ, 315, 74
- (36) Wilson, A. S. 1998, in Accretion Processes in Astrophysical Systems: Some Like it Hot! Eighth Astrophysics Conference, College Park, MD, October 1997, ed. S. S. Holt and T. R. Kallman, AIP Conference Proceedings 431, 235