SAX J1810.8-2609: A New Hard X-ray Bursting Transient
Abstract
The transient X-ray source SAX J1810.8-2609 was discovered on 1998, March 10 with the Wide Field Cameras on board the BeppoSAX satellite, while observing the Galactic Bulge in the 2-28 keV energy range. On March 11, a strong type-I X-ray burst was detected with evidence of photospheric radius expansion. A follow-up target of opportunity observation with the Narrow-Field Instruments (NFI) was performed on March 11 and 12, for a total elapsed time of s. The wide band spectral data (0.1-200 keV) obtained with the NFI show a remarkable hard X-ray spectrum detected up to 200 keV, which can be described by a power law with photon spectral index =1.960.04, plus a soft component which is compatible with blackbody radiation of temperature kT 0.5 keV.
The detection of the type-I X-ray burst is a strong indication that the compact object is a neutron star in a low mass X-ray binary system. Assuming standard burst parameters and attributing the photospheric radius expansion to near Eddington luminosity, we estimate a distance of 5 kpc. The inferred 2-10 keV X-ray luminosity is erg s-1 at the time of the discovery.
1 INTRODUCTION
During a long term 2-28 keV monitoring campaign of the Galactic Bulge region with the Wide Field Cameras (WFC) on board the BeppoSAX satellite, the new X-ray transient SAX J1810.8-2609 was discovered on 1998, March 10 (Ubertini et al. 1998a ). The source showed a weak emission (15 mCrab) corresponding to an X-ray flux of erg cm-2 s-1 in the 2-10 keV range and was positioned in quasi real-time with the quick-look analysis (QLA) tools at and (equinox 2000.0) with an error radius of . During the on-going monitoring, on March 11 a strong type-I X-ray burst was observed with a peak intensity of Crab, from a sky position consistent with that of the persistent emission (Cocchi et al. (1999), Ubertini et al. 1998a ). Two days after the source was discovered a follow-up observation was performed with the BeppoSAX Narrow Field Instruments (NFI) showing that the 2-10 keV intensity had declined to mCrab (Ubertini et al. 1998b ). On 1998, March 24 the ROSAT High Resolution Imager (HRI) observed the error box of SAX J1810.8-2609 for 1153 s (Greiner et al. (1998)). A low energy source, named RX J1810.7-2609, was detected at a position consistent with the WFC error box but not with the one obtained by the QLA of the NFI observation. (Ubertini et al. 1998b , see however further details in Sect.2.1). The 0.1-2.4 keV flux of RX J1810.7-2609 was mCrab and ROSAT did not detect the source in previous observations of the same sky region on 1993 September 10 (0.1-2.4 keV), with a 3 upper limit of mCrab and in 1990 during the All-Sky Survey, thus confirming the transient nature of the source. Very recently, Greiner et al. (1999) have reported details of the ROSAT HRI target of opportunity (TOO), and of optical to infrared follow-up observations of the 20 error box of the ROSAT HRI source. They tentatively suggested as counterpart of RX J1810.7-2609 a variable object showing on March 13 and R 21.5 on August 27. The ROSAT HRI observation showed an unabsorbed flux of erg cm-2 s-1. If one assumes a Crab-like spectrum, this extrapolates to erg cm-2 s-1 in the 2-10 keV range, which is a factor of 4 lower than the BeppoSAX NFI detection (Ubertini et al. 1998b , Greiner et al. (1999)). The variability during the ROSAT HRI observation was less than a factor of 3 in the 0.1-2.4 keV and no evidence of coherent or Quasi-Periodic Oscillations (QPO) in the range from 2 to 200 s was found, with a 3 upper limit on the pulsed fraction of 40 % (Greiner et al., 1999).
We here report on a detailed analysis of the WFC and NFI observations of SAX J1810.8-2609, and discuss the nature of the compact source in this X-ray transient.
2 OBSERVATIONS AND DATA ANALYSIS
The WFC (Jager et al. (1997)) on board BeppoSAX are designed for performing spatially resolved simultaneous measurements of X-ray sources in crowded fields enabling studies of spectral variability at high time resolution. The mCrab sensitivity in 2-28 keV over a square degrees field of view (FOV) and the near-to-continuous operation over a period of years offer the unique opportunity to measure continuum emission as well as bursting behaviour from many new X-ray transients and already known (weak) transient and persistent sources. For this reason the Galactic Bulge is being monitored over 1 to 2 months during each of the visibility periods since the beginning of the BeppoSAX operational life in July 1996. During those observations, that combine to a total of Ms net exposure time up to November 1999, more than 900 X-ray bursts and at least 45 sources have been detected (Cocchi, et al. (1998); Heise et al. (1999); Ubertini et al. (1999)). The data of the two cameras are systematically searched for bursts or flares by analysing the time profiles in the 2-10 keV energy range with a 1 s time resolution.
Follow-up observations with the more sensitive, broad band Narrow Field Instruments are often performed each time a new transient source is detected in the WFC field of view. The BeppoSAX NFI comprise an assembly of four imaging instruments: one low energy and three medium energy concentrator spectrometers, named LECS and MECS, with a 37 and 56 arcmin circular FOV and energy ranges 0.1-10 keV and 1.8-10 keV, respectively (Parmar et al., 1997 and Boella et al. 1997). The other two non-imaging co-aligned detectors are the High Pressure Gas Scintillation Proportional Counter (HPGSPC), operative in the range 4-120 keV (Manzo et al., 1997) and the Phoswich Detector System (PDS), operative in the range 15-200 keV (Frontera et al., 1997). On 1998, March 12.19 UT a BeppoSAX follow-up observation was performed with the NFI on the WFC error box of the newly discovered source (Ubertini et al., 1998b). The total observation lasted 85.1 ks corresponding to a net exposure time of 14.4 ks for LECS, 26.8 ks for MECS, 20.0 ks for HPGSPC and 30.4 ks for PDS. SAX J1810.8-2609 was strongly detected in all instruments, including a high energy tail extending up to 200 keV and was the only source present in the LECS and MECS images, at an updated position consistent with the WFC error box (see Sect. 2.1). Extraction radii of an have been used for source photons for the LECS and MECS images respectively, encircling % of the power of the concentrators point spread function. These data have been used for spectral analysis and light curves production. All spectra have been rebinned, oversampling the detector spectral resolution, to have at least 20 counts per channel. The bandpasses for spectral analysis were limited to 0.3-3.0 keV for the LECS, 1.6-10.5 keV for the MECS, 4-25 keV for HPGSPC and 15-200 keV for the PDS to take advantage of accurate detectors calibration. The standard procedure to leave free the relative normalization parameters of the different instruments within a narrow band, was applied, to accommodate cross-calibration uncertainties.
2.1 The source position
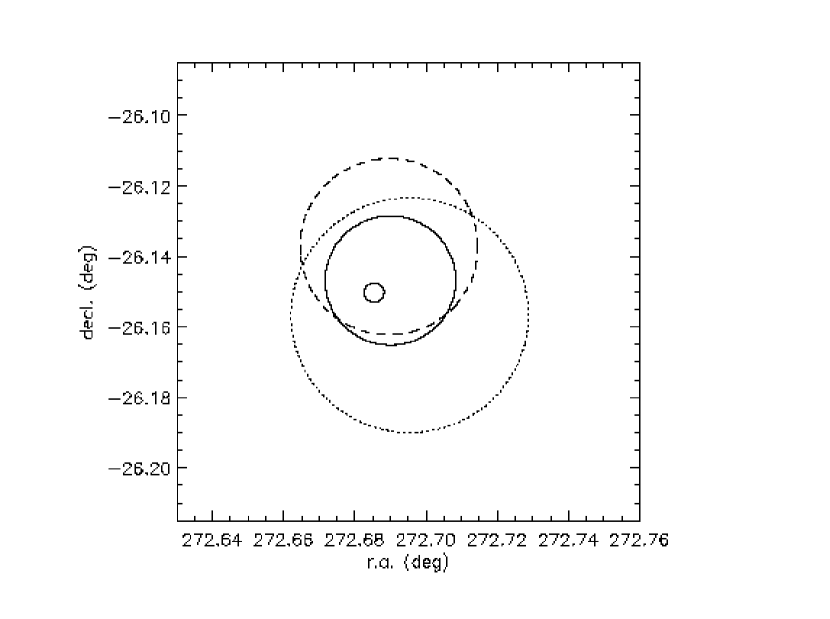
On March 11.06633 UT a strong burst was observed from SAX J1810.8-2609; this is the only X-ray burst ever observed from the source in all the WFC data since 1996, which amounts to a total net exposure time of Ms. We have improved the source position in the WFC with respect to the one previously reported (Ubertini et al. 1998a ) to and (1.1 error radius), by using the burst data which has a much higher statistical quality than that of the non-burst data (see Table 1). This confirms the association with the ROSAT HRI source RX J1810.7-2609. We note that the original inconsistency between the BeppoSAX NFI and ROSAT HRI (Greiner et al. (1998), Ubertini et al. 1998b ) was due to an error in the aspect solution of BeppoSAX which resulted from an unusual attitude configuration. We have therefore refined the position of the source taking into account a new calibration (L. Piro, L.A. Antonelli, private communication). This results in and (equinox 2000.0) with a conservative error radius of , and is now consistent with that determined by the ROSAT HRI. The various error circles are shown in Figure 1.
2.2 The single X-ray burst
A single, strong burst was detected from SAX J1810.8-2609 on 1998 March 11.06634. The event lasted 47 s with an e-folding time of s and showed a peak intensity of Crab in the 2-28 keV band (see also Cocchi et al. (1999)). The time profiles in two energy bands are shown in Figure 2: a clear double-peaked structure is present at high energy (10-28 keV) suggesting photospheric radius expansion (Lewin et al. (1995)). The spectrum of the burst obtained integrating data over the whole burst duration is well represented by a blackbody emission with temperature kT 2 keV. In order to study the time resolved spectra we have integrated the burst data in time intervals as shown in the lower panel of Fig.2, more or less corresponding to the peak structures observed in the high energy profile. Under given assumptions (Lewin, van Paradijs, & Taam (1993)) the effective temperature and the bolometric flux of a burst can determine the ratio between the blackbody radius (that is, the radius of the emitting sphere) and the distance d of the neutron star. Assuming kpc and the observed colour temperatures as , and not correcting for gravitational redshift the data are consistent with a radius expansion of a factor of during the first s of the event. The average blackbody radius, excluding the radius expansion part is km (see Table 2) at 10 kpc. Also evident is the typical spectral softening due to the cooling of the photosphere after the contraction of the emitting region. These results clearly indicate that the burst is of type-I, i.e. it is identified as a thermonuclear flash on a neutron star (NS). The total bolometric fluence of the burst, estimated by spectral analysis is erg cm-2.
The observation of the near-Eddington profile is a clue to estimate the source distance. In fact, for a 1.4 NS and a corresponding Eddington bolometric luminosity of erg/s we obtain d=() kpc, assuming standard burst parameters (here the error is purely statistical). For this distance the total burst emitted energy is erg and the observed blackbody radius scales to a value of km. This value of radius could be underestimated, due to the uncertainties in the relationship between colour and effective temperature. If, as suggested by Ebisuzaki (1987) the colour temperature exceeds by a factor 1.5, then the neutron star radius should be at least two times the measured blackbody radius. These values therefore support a neutron star nature of the compact object.
2.3 The wide band persistent emission
The light curve of SAXJ1810.8-2609 measured with the BeppoSAX NFI is shown in Figure 3, in different energy ranges. There is a slight decrease of the flux in the lower energy range (E10 keV) in the first ks of the observations, while there is no clear evidence for a decline in the final part of the observation. This picture is consistent with the overall flux trend of this source, and with the derived e-folding time of days that is estimated from the WFC, ROSAT HRI and NFI observations.
The count rate spectrum shows substantial emission at high energy. In fact, the unfolded spectrum in the energy range 15-200 keV can be fitted by a single power law of spectral index (=0.76 over 15 d.o.f), and a flux in this range of erg cm-2 s-1. The broad band spectral data, fitted by a single absorbed power law results in a photon spectral index of , with a reduced chi-square =1.35 over 165 degrees of freedom and an average flux of erg cm-2 s-1 in the 0.1-200 keV band. It is clear that the absorbed power law model is not satisfactory when applied to the broad band emission.
The fit is significantly improved by using a thermal comptonization spectrum (comptt in XSPEC v.10) instead of the simple power law, resulting in =1.12 for 163 d.o.f. (see Table 3) which corresponds to a null hypothesis probability of 0.147. In this model, the hard X-ray tail is produced by the upscattering of soft seed photons by a hot, optically thin electron plasma (Sunyaev & Titarchuk, (1980)). The seed photons temperature for this fit is () keV. The hard X-ray data, however, cannot constrain the parameters of the Compton emission region (temperature and optical depth) due to the very high energy cutoff which is above keV.
The addition of a soft thermal component improves both the power law and comptonization fits. The soft component can be modelled satisfactorily with blackbody or multicolor disk (MCD) blackbody emission (Mitsuda et al. (1984)). Using single temperature blackbody, the fits for power law and comptonization are both compatible with a temperature value kT 0.5 keV (see Table 3 for details), giving a of 0.97 and 0.99 respectively. The power law photon spectral index is = and the temperature of the soft comptonized emission is () keV. The estimated blackbody flux is between and 4 10-11 erg cm-2 s-1. At the quoted source distance of 4.9 kpc this indicates an emission radius between and km. Using a MCD model to describe the additional soft component, the thermal emission is characterized by = keV (temperature at the inner disk radius ). For this model, the best fit gives =0.99 for 161 d.o.f. The values for may range from to km (here is the disk viewing angle). Hence, if this soft component originates from an optically thick region of the accretion disk, this should be expected to be not too far from the NS, unless the disk is seen at very large inclination.
The broadband source spectrum unfolded by the four instruments response is shown in Fig.4 along with the model spectrum obtained for the blackbody component plus thermal comptonization best fit. We note that the value of 3.51021 cm-2 obtained for the fits which include comptonization match very well the current estimate of the Galactic column density of cm-2 for this region (Dickey & Lockman (1990)).
3 DISCUSSION
The deep and timely investigations carried out by means of repeated BeppoSAX observations of SAX J1810.8-2609 are consistent with a transient type-I X-ray bursting source, most likely a low mass X-ray binary (LMXB) containing a weakly magnetized NS. This source is a weak transient, as supported by the fact that it was never detected in more than three years of BeppoSAX monitoring of the Galactic Bulge region (apart from these discovery and follow-up observations) and also never seen by the RXTE All Sky Monitor (ASM), even during the March 1998 outburst. The ASM non-detection implies an upper limit on the 2-10 keV flux of erg cm-2 s-1. It is noteworthy, that a similar weak transient behaviour has also been observed in a number of recently discovered bursters, detected during dim X-ray outburst episodes with maximum intensities well below 100 mCrab and lasting to a few weeks (see e.g. Heise et al. (1999)).
The estimated value of distance of kpc, that we obtained from the observation of radius expansion during the burst (Lewin, van Paradijs, & Taam (1993); Lewin et al. (1995)) places SAX J1810.8-2609 at our side of the Galactic Bulge (see e.g. Christian & Swank (1997)). This is consistent with the tentative detection of the optical counterpart (Greiner et al. (1999)). We note that the presence of the neutron star in the system is also supported by the relatively small blackbody radius of km, calculated for the derived distance.
The detection of a single X-ray burst during our monitoring observations is consistent with the observed combination of burst fluence and average persistent bolometric emission, which is erg cm-2 s-1, i.e. at 5 kpc. In fact, taking into account the total energy release of the burst and assuming that steady nuclear burning is negligible, we can estimate a typical value of days for the mean burst interval, which corresponds to the expected parameter for helium burning (i.e., , see Lewin, van Paradijs, & Taam (1993)) and is comparable with the e-folding decay time of 7.5 days estimated for the persistent emission. Conversely, if a significant part of the nuclear fuel is burnt steadily the quoted value should be considered as a lower limit.
The broad band spectrum of SAX J1810.8-2609 shows a high energy power law tail, which is remarkably hard ( in the 15-200 keV band) and with no cutoff. There is also an indication for a soft blackbody component with temperature keV and total flux 3 10-11 erg cm-2 s-1. The ratio of the soft component luminosity to the total X-ray (0.1-10 keV) luminosity is estimated to be in the range 10-15%. This is consistent with upper limits obtained for X-ray bursters observed by ASCA in the low state (see e.g., Revnivtsev et al. (1999)) and also with the detection of similar soft components in the spectra of 4U 0614+091 (Piraino et al. (1999)), 1E 1724-3045 and SLX 1735-269 (Barret et al. (1999)), which were all observed in a hard state. A recent analysis of ROSAT spectra of LMXB (Schulz 1999) also shows that a soft component is present in several low luminosity (mainly, Atoll type) X-ray bursters.
The luminosities in the soft and hard X-ray bands match quite well the observed correlation pattern found for neutron star binaries in the low state (Barret et al. (1999)), with values of erg s-1 in the 1-20 keV band, and erg s-1 in the 20-200 keV band. Nevertheless, the absence of cutoff below 200 keV is particularly outstanding, as in most cases X-ray bursters with hard tail spectra do have this feature which is suggestive of comptonization with plasma temperatures below 50 keV (Guainazzi et al. (1998), in ’t Zand et al. (1999)). The presence of such a cutoff was suggested as a possible criterion to distinguish NS from black hole (BH) spectra, the latter being characterized by much higher electron temperatures (Tavani & Barret, (1997)). The case of SAX J1810.8-2609 is not compatible with this kind of interpretation. Very recently, an analysis of BeppoSAX observations of the Atoll X-ray burster 4U 0614+091 has revealed a similar behaviour, i.e. a high energy power law tail with no visible cutoff (Piraino et al. (1999)). Whether the spectrum of SAX J1810.8-2609 could have a cut-off just above 200 keV (that is our observational upper energy limit) is difficult to say. Our broad band spectral analysis shows that only a Comptonization fit is compatible with a low energy absorption matching the value of Galactic column density. We conclude that, even if the data are not able to constrain the parameters of the scattering region we still have good indication that comptonization is the mechanism that produces the hard X-ray tail.
References
- Barret et al. (1999) Barret, D., et al. 1999, ApJ, in press
- Bazzano et al. (1997) Bazzano, A., et al. 1997, AIP Conf. Proc. N. 410, 729
- Boella et al. (1997) Boella, G., et al. 1997, A&A122, 327
- Christian & Swank (1997) Christian, D.J. & Swank, J.H. 1997, ApJS, 109, 177
- Cocchi, et al. (1998) Cocchi, M., et al. 1998, Nucl. Phys. B (Proc. Suppl.) 69/1-3, 232
- Cocchi et al. (1999) Cocchi, M., et al. 1999, ”Proceedings of The Extreme Universe, 3nd Integral Workshop” 14-18 Sept. 1998, Taormina, Italy, in press
- Dickey & Lockman (1990) Dickey, J.M., and Lockman, F.J. 1990, ARA&A, 28, 215
- Frontera et al. (1997) Frontera, F., et al. 1997, A&A, 122, 327
- Ebisuzaki (1987) Ebisuzaki, E. 1987, PASJ, 39, 287
- Greiner et al. (1998) Greiner, J., Castro-Tirado, A.J., & Boller, T. 1998, IAU circ. 6985
- Greiner et al. (1999) Greiner, J., et al. 1999, MNRAS, 308, L17
- Guainazzi et al. (1998) Guainazzi, M., et al. 1998, A&A, 225, 802
- Heise et al. (1999) Heise, J., et al. 1999, in Proc. 3rd INTEGRAL Workshop, ”The Extreme Universe”, in press
- in ’t Zand et al. (1999) in ’t Zand, J.J.M et al., 1999, A&A, 347, 891
- Jager et al. (1997) Jager, R., et al. 1997, A&A, 125, 557
- Lewin, van Paradijs, & Taam (1993) Lewin, W.H.G., van Paradijs, J., & Taam, R.E. 1993, Space Sci. Rev., 62, 223
- Lewin et al. (1995) Lewin, W.H.G., van Paradijs, J., & Taam, R.E. 1995, in ”X-ray Binaries”, ed. W. Lewin, J. van Paradijs, & E. van den Heuvel, Cambridge University Press, Cambridge, p. 175
- Manzo et al. (1997) Manzo, G., et al. 1997, A&A, 122, 341
- Mitsuda et al. (1984) Mitsuda, K., et al. 1984, PASJ, 36, 741
- Parmar et al. (1997) Parmar, A.N., et al. 1997, A&A, 122, 309
- Piraino et al. (1999) Piraino, S., et al. 1999, A&A, 349, L77
- Revnivtsev et al. (1999) Revnivtsev, M., et al., in Proc. 3rd INTEGRAL Workshop, ”The Extreme Universe”, in press
- Schulz (1999) Schulz, N.S., 1999, ApJ, 511, 304
- Sunyaev & Titarchuk, (1980) Sunyaev, R.A., & Titarchuk, L.G. 1980, A&A, 86, 121
- Tavani & Barret, (1997) Tavani, M. & Barret, D. 1997, AIP Conf. Proc. N. 410, 75
- Titarchuck (1994) Titarchuck L., A&A, 434, 313
- (27) Ubertini P., et al., 1998a, IAU circ. 6838
- (28) Ubertini P., et al., 1998b, IAU circ. 6843
- Ubertini et al. (1999) Ubertini P., et al. 1999, in Proc. 3rd INTEGRAL Workshop, ”The Extreme Universe”, in press
| Detector | Energy | Observation | R.A. | Decl. | Error circle | References |
|---|---|---|---|---|---|---|
| (keV) | 1998 | 2000.0 | 2000.0 | (99% conf.) | ||
| BeppoSAX WFC | 2-28 | March 11aaBurst emission | This work, | |||
| Cocchi et al.1999 | ||||||
| BeppoSAX WFC | 2-28 | March 10-12b,cb,cfootnotemark: | This work | |||
| BeppoSAX NFI | 0.1-200 | March 12-13bbPersistent emission | This work | |||
| ROSAT HRI | 0.1 - 2.4 | March 24bbPersistent emission | Greiner et al.,1999 |
| Data Periodaarefer also to lower panel of Fig.2 | Int. Time | (keV) | (km)bbestimated for a distance of 10 kpc (Cocchi et al. 1999) | (26 d.o.f.) |
|---|---|---|---|---|
| Whole Burst | 48 s | 1.89 | ||
| First Peak | 4 s | 1.46 | ||
| First Tail | 6 s | 1.29 | ||
| Second Peak | 6 s | 0.98 | ||
| Second Tail | 7 s | 1.09 | ||
| Third Tail | 25 s | 1.57 |
| Model | RangeaaEnergy range in keV | bbValue of Wisconsin absorption parameter in units of cm-2 | ccSource discovery | ddTemperature of the comptonized soft seed photons, in keV | eePlasma temperature, in keV | ffPlasma optical depth for disk geometry | ggTemperature of the blackbody (BB) component, in keV | FluxhhIn units of erg cm-2 s-1 | iiNumber of d.o.f. is given in parentheses | |
|---|---|---|---|---|---|---|---|---|---|---|
| PL | 0.1-200 | 4.2 | 1.35[165] | |||||||
| PL | 15-200 | 2.2 | 0.76[15] | |||||||
| BB+PL | 0.1-200 | 4.6 | 0.97[163] | |||||||
| comptt | 0.1-200 | 4.1 | 1.12[163] | |||||||
| BB+comptt | 0.1-200 | 4.3 | 0.99[161] |
Note. — Errors are single parameter l errors.