The MACHO Project 9 Million Star Color-Magnitude Diagram
of the Large Magellanic Cloud
Abstract
We present a 9 million star color-magnitude diagram (9M CMD) of the Large Magellanic Cloud (LMC) bar. The 9M CMD reveals a complex superposition of different age and metallicity stellar populations, with important stellar evolutionary phases occurring over three orders of magnitude in number density. First, we count the non-variable red and blue supergiants, the associated Cepheid variables, and measure the stellar effective temperatures defining the Cepheid instability strip. Lifetime predictions of stellar evolution theory are tested, with implications for the origin of low-luminosity Cepheids. The highly-evolved asymptotic giant branch (AGB) stars in the 9M CMD have a bimodal distribution in brightness, which we interpret as discrete old populations (1 Gyr). The faint AGB sequence may be metal-poor and very old. Comparing the mean properties of giant branch and horizontal branch (HB) stars in the 9M CMD to those of clusters, we identify NGC 411 and M3 as templates for the admixture of old stellar populations in the bar. However, there are several indications that the old and metal-poor field population has a red HB morphology: the RR Lyrae variables lie preferentially on the red edge of the instability strip, the AGB-bump is very red, and the ratio of AGB-bump stars to RR Lyraes is quite large. If the HB second parameter is age, the old and metal-poor field population in the bar likely formed after the oldest LMC clusters. Lifetime predictions of stellar evolution theory lead us to associate a significant fraction of the 1 million red HB clump giants in the 9M CMD with the same old and metal-poor population producing the RR Lyraes and the AGB-bump. In this case, compared to the age-dependent luminosity predictions of stellar evolution theory, the red HB clump is too bright relative to the RR Lyraes and AGB-bump. Last, we show that the surface density profile of RR Lyraes is fit by an exponential, favoring a disk-like rather than spheroidal distribution. We conclude that the age of the LMC disk is probably similar to the age of the Galactic disk.
(The MACHO Collaboration)
1 Introduction
The Large Magellanic Cloud (LMC) is a nearby galaxy with one spiral arm and a bar (de Vaucouleurs 1954). The LMC exhibits a disk-like exponential surface brightness profile. The surface brightness profile of the LMC bar, unlike typical galactic bars, is also exponential (Bothun & Thompson 1988). The study of the resolved stellar populations in the LMC bar is challenging because the surface density of stars is quite high. However, the proximity of the LMC otherwise favors detailed observations. It is important to study the stellar populations of nearby galaxies like the LMC in order to understand the processes of galaxy evolution. In particular, the formation of exponential disks is an outstanding problem in cosmogony (e.g. Freeman 1970, Fall & Efstathiou 1980, Dalcanton et al. 1997).
Butcher’s (1977) seminal study of the main sequence luminosity function in the LMC showed that the star formation histories of the LMC disk and the solar neighborhood Galactic disk are different. Butcher (1977) concluded that the bulk of LMC field stars formed 3-5 Gyr ago rather than 10 Gyr ago, when the Galactic disk appeared to have formed (Salpeter 1955). Numerous subsequent studies of LMC field stars have supported this initial claim (Bertelli et al. 1992, Westerlund 1997, van den Bergh 1998). For example, Geha et al. (1998) found that roughly half of the stars in outer disk fields of the LMC formed before and after 4 Gyrs ago. Recent stellar populations studies, such as those made with the Hubble Space Telescope (e.g. Geha et al. 1998, Olsen 1999, Holtzman et al. 1999), are now beginning to probe the spatial variations of the LMC star formation history in detail. Holtzman et al. (1999) argue that the LMC bar has a larger relative component of older stars than the outer disk fields.
The first color-magnitude diagram (CMD) study of the LMC bar was made by Tifft and Snell (1971). Their CMD contained 1000 stars to a limiting magnitude of mag. Tifft and Snell (1971) first observed the tip of the red giant branch (RGB) in the LMC bar, thus identifying an old stellar population. Hardy et al. (1984) obtained a CMD of the LMC bar with 18000 stars to a limiting magnitude of mag. They argued that the dominant stellar population in the bar formed 1-3 Gyr ago, and concluded that an older population in their CMD was only a weak component. Elson et al. (1998) reached a similar conclusion. They analyzed a Hubble Space Telescope CMD of an “inner disk” field (close to the bar) and argued that the bar formed 1 Gyr ago and the disk formed 3 Gyr ago. Olsen (1999) and Holtzman et al. (1999) have contested the relatively young disk and bar advocated by Elson et al. (1997).
In this paper, we present a 9 million star color-magnitude diagram (9M CMD) of the LMC bar. Our fields cover almost the entire LMC bar (10 square degrees) to a limiting magnitude of mag. These are the same fields extensively analysed for microlensing by Alcock et al. (1997). The 9M CMD is assembled from MACHO Project two-color instrumental photometry calibrated to the standard Kron-Cousins and system (Alcock et al. 1999). For these 9 million stars, the precision of the photometric calibration is = = 0.02 mag. In addition to the sheer number of stars, near total spatial coverage of the bar, and high precision calibration, each star in the 9M CMD is represented by a 6-year lightcurve consisting of 1000 two-color photometric measurements. Variable stars are easily identified with these time-sampled data. The 9M CMD is the product of wide-field imaging array detector technology and a dedicated, ground-based, 1-m class survey telescope.
In order to discuss the taxonomy of the 9M CMD, we begin with a “tour.” The tour is intended to give the reader an overall impression and introduce key features which are the subject of more detailed discussions that follow. After the tour, we turn our attention to the young LMC stellar populations. The core helium-burning red and blue supergiants and Cepheid variable stars are particularly interesting examples of the late stages of stellar evolution of intermediate-mass stars. Supergiants in the LMC have a long history as testing grounds for the theory of stellar evolution, although past attempts to study these rare stars have sometimes proven difficult for the small samples available (e.g. Maeder & Meynet 1989, Langer & Maeder 1995). The 9M CMD represents the largest homogeneous sample of non-variable supergiants and Cepheids ever assembled, thus allowing for new and precise comparisons with theory.
Next, we examine the old LMC stellar populations. The metallicities and ages of these stars are not well-known, which is an obstacle to the sort of detailed comparisons with theory we make with the young stellar populations. Therefore, a model for the old LMC stellar populations is first constructed. In order to minimize the dependence of this analysis on purely theoretical results, we rely primarily on the comparison of major features in the 9M CMD and the properties of variable stars with their counterparts in clusters. Clusters are useful because they serve as “template” populations, or building blocks for the composite 9M CMD. Our simple model for the old LMC populations is intended to serve as a check of more sophisticated, but isochrone-dependent, analyses of the LMC star formation history. In many respects, we repeat our analysis of the intermediate-mass supergiants and Cepheids, but for the low-mass helium-burning giants. By studying the low-mass RR Lyrae variables, we make inferences to the nature of the old and metal-poor LMC field population. This elusive LMC population probes the formation epoch of the LMC, with general implications for cosmogony.
2 Tour of the 9 Million Star Color-Magnitude Diagram
2.1 Construction
The MACHO photometry data and transformation of these data to the Kron-Cousins and standard system are discussed extensively by Alcock et al. (1999), to which the reader is referred for further details. These calibrated photometry data may be properly compared to other data on the Kron-Cousins standard system. Moreover, we may infer accurate effective temperatures and bolometric luminosities with consideration of stellar atmospheres convolved with the standard and passbands, thus allowing for direct comparisons of stars in the 9M CMD with theoretical results. Unless otherwise noted, the photometry data analysed here are derived from single observations; they are not time-averaged magnitudes and colors.
The 9 million stars analysed in this paper are distributed throughout 22 MACHO Project survey fields. A map of these fields overlayed on a wide-field image of the LMC (Bothun and Thompson 1988) is presented in Alcock et al. (1997; their Figure 1). Coordinates of the field centers are also provided. For each of the 22 fields, we bin the photometry data into a Hess diagram. A Hess diagram is a CMD that also contains information on the number of stars as a function of color and magnitude. We use a bin size of 0.01 mag in and 0.02 mag in with axes running from and mag. We make the final 9M CMD “image” by summing the 22 individual field CMDs using standard IRAF111The Image Reduction and Analysis Facility, v2.10.2, operated by the National Optical Astronomy Observatories. image processing routines.
2.2 The Tour
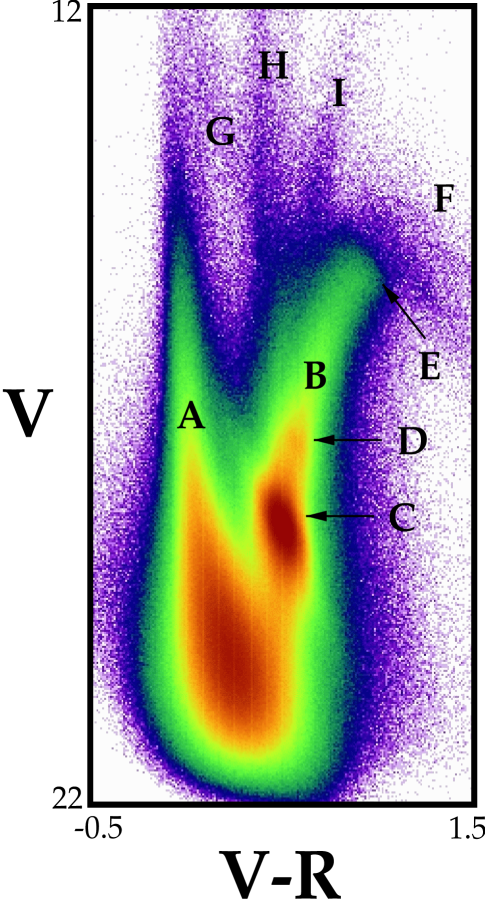
We present the 9M CMD in Figure 1. The image is log-scaled and color coded. The log of the number of stars in each pixel increases following the sequence: . Important stellar evolutionary phases occur over three orders of magnitude in stellar number density. The highest pixel value in this image is 3.5 dex, which is found at the peak of the red horizontal branch clump (feature C in Fig. 1). This single high pixel therefore represents 3000 stars with the same color and mag to within the resolution of our adopted pixel/bin size. Figure 1 is designed to give an overall impression of the 9M CMD data. A small number of stars brighter than mag are not shown; this is above the saturation limit of the MACHO image data for the LMC anyway. Incompleteness is clearly evident for mag. For example, the number density of main sequence sequence stars would still be increasing at this brightness if not for incompleteness in the data (Alcock et al. 1999). We will restrict our analyses to the brighter stars in the 9M CMD. We have labeled nine features with the letters (A) through (I) in Figure 1. These are identified as follows.
(A) The main sequence. These stars are primarily core hydrogen-burners (Maeder & Meynet 1989). The majority of main sequence stars visible in the 9M CMD have either O, B, or A spectral types. The ridge line of the main sequence is not exactly vertical, but instead runs slightly from blue to red with decreasing brightness. There are almost no stars blueward of the upper main sequence. The stars bluer than the main sequence ridge line and increasing in number at progressively fainter magnitudes are consistent with our photometric errors and the total numbers of stars found on the main sequence. The range of brightnesses on the main sequence may be interpreted as a range of initial masses. The bright upper main sequence stars indicate recent star formation in the LMC bar; these stars only live 20 Myr (Maeder & Meynet 1989).
(B) The giant branch. The stars on the giant branch are old, but in a mix of different evolutionary phases. Most of these stars are on the first-ascent red giant branch (RGB); they have degenerate helium cores and hydrogen-burning shells (Schwarzschild 1958). The base of the RGB (i.e. the subgiant branch) is not visible in the 9M CMD (it is too faint). However, the termination, or “tip” of the RGB is seen at feature (E). Stars at the tip of the RGB ignite helium in their cores and evolve very rapidly to the horizontal branch, near feature (C). Some of the stars on the giant branch are also on the asymptotic giant branch (AGB). These stars are helium shell-burners, and are in an evolutionary state more advanced than the horizontal branch. For many stars in the 9M CMD, the AGB begins at (D), continues past (E) and into region (F). We do not resolve the RGB and AGB in the 9M CMD. Stars located redward of the giant branch ridge line are affected by differential reddening or photometric errors. In addition, some of these stars are foreground stars (in our Galaxy), and some are galaxies behind the LMC.
The association of the LMC bar giant branch with an “old” population was first made by Tifft and Snell (1971). This is more precisely defined as a population older than 1 Gyr, a characteristic age also known as the RGB phase transition (Sweigart et al. 1990). The initial mass of stars at this transition is likely 2 (Bertelli et al. 1985, Sweigart et al. 1990), which sets a lower limit on the age of a stellar population with a fully developed (extended) giant branch.
(C) The horizontal branch red clump. The stars in the horizontal branch (HB) red clump are primarily core helium-burners older than 1 Gyr (Seidel et al. 1987), although some of these stars may be in different evolutionary phases. The red HB clump is very prominent in the 9M CMD. Note the elongation along the reddening vector due to differential reddening in the LMC (like some of the stars redward of the giant branch ridge line). There are also brighter and bluer red HB clump stars, visible as a faint extension of the red HB clump running toward label (A). These are unresolved blends222The chance superposition of two stars on the sky which we are unable to resolve with our ground-based image data. Some of these may be binary systems, also unresolved in our data. of red clump and main sequence stars. Although confused with the giant branch, clump-clump and clump-giant branch blends are likely present in similar numbers in the 9M CMD.
The ages and metallicities of the red HB clump giants in the LMC are surprisingly ill-constrained. Hardy et al. (1984) argued that the red HB clump giants in the LMC bar are most likely 1 to 3 Gyrs old. However, their upper age limit is based on uncertain subgiant branch starcounts. In this work, we will constrain the ages and metallicities of the red HB clump giants using other stellar evolutionary features in the 9M CMD, such as the giant branch (B), the AGB-bump (D), and the properties of the field RR Lyrae variable stars.
It is useful to compare the red HB clump giants to the RR Lyrae variable stars in the 9M CMD because they are closely related in a stellar evolutionary sense, and the characteristic ages of RR Lyraes are known. RR Lyraes are believed to be very old, having been found only in very old clusters (9 Gyr). In the LMC, RR Lyrae are also known to be metal-poor (see Olszewski et al. 1996 for a review). We find the red HB clump is mag brighter than the mean brightness of the RR Lyraes in the 9M CMD (the RR Lyraes are not distinct in Figure 1, but see §4.2 of this paper). This brightness difference is larger than expected on theoretical grounds for an old, coeval HB (e.g. Fusi Pecci et al. 1996). However, this alone is not proof that the RR Lyraes and red HB clump giants in the LMC bar have different ages. The luminosity predictions of stellar evolution theory are very difficult to test at this high level of precision (Alves & Sarajedini 1999). If we estimate the mean metallicity of the red HB clump giants in the LMC bar, and assume that is the so-called second parameter influencing HB morphology (Sandage & Wiley 1966, Stetson et al. 1996), then the color, brightness, and number of red HB clump giants may give an indication to their age (Lee et al. 1994, Sarajedini et al. 1995, Hatzidimtriou 1991).
The analog of red HB clump stars for populations younger than the RGB phase transition are also present here. These stars populate a feature in the 9M CMD that has been called the VRC, for vertically-extended red clump (Zaritsky & Lin 1997). The VRC has been observed in other local group galaxies, such as Carina (Smecker-Hane et al. 1994) and Fornax (Saviane et al. 1999). If we define the VRC as a CMD feature populated by stars in the same stellar evolutionary phase, then the VRC in the LMC is composed of 2 to 4 core helium-burning red giants (Corsi et al. 1994). The VRC is the high-mass extension of the red HB clump and the low-mass extension of the red supergiants, feature (I). The VRC is visible in the 9M CMD just to the left (blueward) of the label (B) in Figure 1. At this brightness, the giant branch is beginning to “turn over” to redder colors which makes it easier to distinguish the VRC sequence.
VRC stars with initial masses very close to the RGB phase transition may actually be up to 0.5 mag fainter than the peak concentration of the red HB clump in the 9M CMD (Corsi et al. 1994, Girardi 1998). Bica et al. (1998) and Piatti et al. (1999) have probably observed this “sub-clump” in several outer disk fields of the LMC. After reaching a minimum brightness, progressively younger stars in this evolutionary phase will then be brighter.
The density of stars along the VRC sequence will depend on the lifetimes of red giants of different initial masses, and also on the recent star formation history of the LMC. The theoretical lifetimes of VRC stars are very sensitive to the parameterization of convective overshoot, which may depend on initial mass and metallicity in a non-trivial manner (Schroder et al. 1997). Stochastic star formation throughout the LMC disk may also cause variations in the density of stars along the VRC, complicating comparisons with theory. Bica et al. (1998; but see Piatti et al. 1999) and Zaritsky and Lin (1997) have attributed stellar density variations along the VRC to extragalactic stellar populations. The VRC as defined here is a well-known stellar evolutionary branch in CMDs representing mixed-age populations, and should not be confused with the fluctuations in stellar density along this branch that have lead to claims of new stellar populations in front (or behind) the LMC.
(D) The asymptotic giant branch bump. We find a small concentration of stars on the giant branch approximately one mag brighter than the horizontal branch. This feature was first observed by Hardy et al. (1984) in their CMD of the LMC bar. It is the AGB-bump, a slight evolutionary pause marking the transition from core to shell helium-burning (Castellani, Chieffi & Pulone 1991). The AGB-bump is the “base” of the AGB. The AGB-bump stars in the 9M CMD are likely the same old population as the RR Lyrae stars, otherwise this feature would be much brighter (Alves & Sarajedini 1999).
(E) The tip of the red giant branch. The tip of the red giant branch is defined by ignition of the degenerate helium core in old (low-mass) stars, an event known as the helium flash (Renzini & Fusi Pecci 1993). In the 9M CMD, some stars at the blue edge of the tip of the RGB are likely unresolved blends of two giant branch stars. These blends “puff up” the tip of the RGB.
(F) The asymptotic giant branch. These bright and very red stars are on the AGB. The AGB consists of two major helium shell-burning evolutionary phases: the “early AGB”, during which the outer hydrogen shell is extinguished, and the “thermal-pulsing AGB,” marked by the reignition of the hydrogen shell (Iben & Renzini 1983). The transition from the early AGB to the thermal-pulsing AGB is theoretically predicted to occur near the tip of the RGB, and may be associated with the onset of pulsation in these stars (Alves et al. 1998, Wood et al. 1998). The AGB stars brighter or redder than the tip of the RGB are all likely experiencing thermal pulses. The label (F) in Figure 1 marks the upper envelope of where most of the AGB stars are found. The AGB stars populate the region between the label & arrow (E) and up to the label (F). At the red edge of the AGB region (where the most highly-evolved AGB stars reside), the 9M CMD reveals a bimodal structure, which we will examine in detail.
(G) The blue supergiants. These are 9 core helium-burning stars. They spend most of their post-main sequence lifetimes as either blue or red supergiants (Maeder & Meynet 1989). While “looping” between the red and blue phases, these supergiants cross the instability strip and become Cepheid variable stars. The blue supergiants therefore define the “tips” of the blue loops. This is the lowest density stellar evolution feature we identify in the 9M CMD. The sequence runs from red to blue with increasing brightness and is visible between the main sequence and feature (H), the foreground Galactic disk stars.
(H) The foreground Galactic disk stars. The wide-field coverage of the 9M CMD results in significant “contamination” by Galactic foreground stars. The foreground Galactic disk stars lie along sequence (H) in the 9M CMD. The Galactic spheroid and thick disk make a small contribution at this brightness in the 9M CMD (Yoshii & Rodgers 1989). The moderately low Galactic latitude of the LMC () increases the number of foreground disk stars relative to halo and thick disk stars over the case of starcounts at the Galactic poles.
(I) The red supergiants. These are the 9 core helium-burning red giant stars associated with the blue supergiants and the Cepheid variables. They are also the high-mass extension of the VRC. Inspection of Figure 1 shows that there are more red than blue supergiants in the LMC bar. We will quantify this observation in the next section.
3 Young Stellar Populations: Supergiants and Cepheids
The supergiant and VRC sequences in the 9M CMD are collectively known as “intermediate-mass” stars. Intermediate-mass stars ignite helium non-degenerately, but develop a highly electron-degenerate carbon-oxygen core after exhaustion of helium. The exact mass range depends on chemical composition, but is likely 2 to 9 (Bertelli et al. 1985). After these stars leave the main sequence and evolve rapidly to become red giants (or supergiants, depending on the initial mass of the star), helium ignites in the core and a hydrogen shell burns outward. This shell eventually approaches a chemical composition discontinuity left by the furthest extent of the convective envelope during core hydrogen-burning, which triggers rapid movement of the star back to the blue side of the CMD (Lauterborn et al. 1971, Stothers & Chin 1991, but see also Renzini et al. 1992). Subsequently, these stars evolve back to the red side of the CMD, which marks the end of the first “blue loop.” The helium shell ignites (double shell-burning), and these stars may make a second blue loop (Becker 1981). Second blue loops are even less well understood than first blue loops (Hoeppner et al. 1978), but are theoretically predicted to last 10% of the lifetime of the first blue loop, if they occur at all.
The first blue loop is sometimes called the Cepheid loop, because it is the longer of the two loops and most Cepheids are believed to be in this phase of evolution (Becker 1981). Even during the first blue loop, these stars evolve very quickly between the tip of the blue loop and the red supergiant sequence. This rapid evolution manifests as a “gap” in CMDs representing young stellar populations, also known as the Hertzsprung gap. Blue loops tend to become shorter in lower mass stars until no loops occur (Maeder & Meynet 1989). This stellar evolutionary trend is clearly confirmed by the blue supergiant sequence in the 9M CMD, which becomes redder at lower luminosities. We observe the red supergiants making blue loops, but not the VRC stars. The blue supergiant sequence in the 9M CMD represents the outer-envelope of intermediate-mass stars on blue loops.
While stellar evolution theory for intermediate-mass stars successfully predicts the major observational characteristics of supergiants and Cepheids, the models may fail to match observation in detail (Renzini et al. 1992; Langer & Maeder 1995). Therefore, it is worth examining the supergiants in the 9M CMD and making a comparison with theory for the possibility of advancing the theory. We assume that the intermediate-mass stars in the LMC bar have similar, moderately subsolar metallicities ( dex; Westerlund 1997, see also Luck et al. 1998). In this case, the 9M CMD represents the largest homogeneous sample of non-variable supergiants and Cepheids ever assembled.
3.1 Isolating the Supergiants
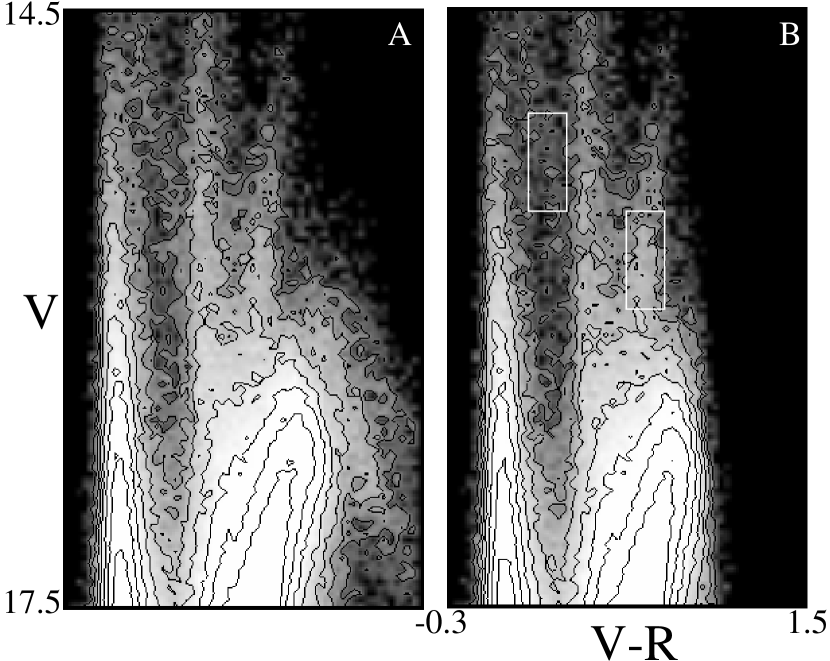
We present two different versions of the 9M CMD in Figure 2. In these diagrams, we adopt a bin size of 0.03 mag in and with axes running from and mag. The scale and bin size are chosen to show the two supergiant sequences clearly. Intensity and contours (1.0 to 2.5 dex in 0.25 steps) indicate the logarithmic number of stars (number per 0.03 mag square color-mag bin). Panel (B) is a subset of panel (A), where we have removed all variable stars. The variable stars are identified by poor fits to constant-brightness 4-year lightcurves.
There are only small regions in the 9M CMD where the supergiant sequences are free from contamination by other major features. This is particularly true for the blue supergiants. The foreground Galactic disk stars are the most serious interloper we must confront. In panel (B) of Figure 2, we indicate two “apertures” with white rectangles. These are used to count the (non-variable) blue and red supergiants. The apertures are centered on = 0.18, 15.25 and 0.66, 15.75 mag, respectively. The aperture sizes are = 0.2, 0.5 mag. There are clearly more red then blue supergiants in these apertures. We also draw attention to the gradients in number density with increasing brightness within the apertures. While the number density of blue supergiants is nearly constant, the number density of red supergiants is visibly decreasing. In this work, we restrict our analysis to the average properties of supergiants in these two apertures333We have calculated the ratio of blue and red supergiants in 88 quarter-field regions of the 9M CMD (including variables) and find a mean value and a median value of 0.44, excluding one region with an exceptionally high degree of differential reddening. This analysis reassures us that the mean ratio of non-variable blue and red supergiants described in the text is representative of the young LMC bar population..
In Figure 3, we present color-frequency histograms of the bright stars in the 9M CMD (shown as solid line histograms). These give the number of stars per 0.1 mag color bin and mag, where is labeled in the upper right corner of each panel. The shaded histogram is a model prediction for Galactic disk foreground stars along the line of sight toward the LMC bar. The Galaxy model is briefly summarized in the next paragraph. The agreement between the 9M CMD data and the model is comparable to other well-studied lines of sight (for a recent modeling of starcount data along multiple lines-of-sight, see Ng et al. 1997). The detailed disagreement between the model and 9M CMD starcounts may be due to the normalization of the local disk luminosity function and assumptions regarding the local disk giant branch (see below). This is not critical to our analysis. This model comparison unambiguously identifies feature H in Figure 1 with foreground stars. In addition, the color distribution of foreground Galactic disk stars shows a sharp blue edge, and thus blue LMC supergiants may be isolated with an appropriate color cut. The fractional contamination of the red LMC supergiants by foreground Galactic disk stars is estimated to be 10% in the brightness range of interest ( mag).
Our Galaxy model consists of two components, a standard double-exponential disk and a spheroid. However, the spheroid is a minor contributor to the starcounts at the brightnesses we are concerned with in this work (Bahcall & Soneira 1980), and this component is not described here. We do not include extinction in our model. Our local disk luminosity function is adopted from Yoshii et al. (1987), but is re-binned into (no. stars) (0.5 mag)-1 pc-3. We predict a local spatial density of = 0.036 stars pc-3, which projects to a column density at the solar radius of 47 pc-2. We adopt a CMD for the disk stars consistent with the isochrones of Bertelli et al. (1994). This slightly subsolar metallicity accounts for radial and vertical metallicity gradients in the disk, and dilution from thick disk stars in an average manner. We have explicitly tested the effect of disk metallicity gradients of the forms given by Yoshii et al. (1987), and find a negligible effect on the star count colors for the models relevant to this investigation. We do not include a giant branch in our model. We assume a Galactocentric solar radius R⊙ = 8 kpc and a disk radial scale length RD = 3.8 kpc (Yoshii & Rodgers 1989). Our vertical scale heights (), are a function of , running from for mag to pc for mag. This function is consistent with the data summarized in Bahcall and Soneira (1980). We have tested our Galaxy model against starcount data along lines of sight toward the North Galactic pole (Yoshii et al. 1987), the South Galactic pole (Reid & Gilmore 1982), and the Galactic anti-center (Ojha et al. 1994), and find satisfactory agreement in all cases.
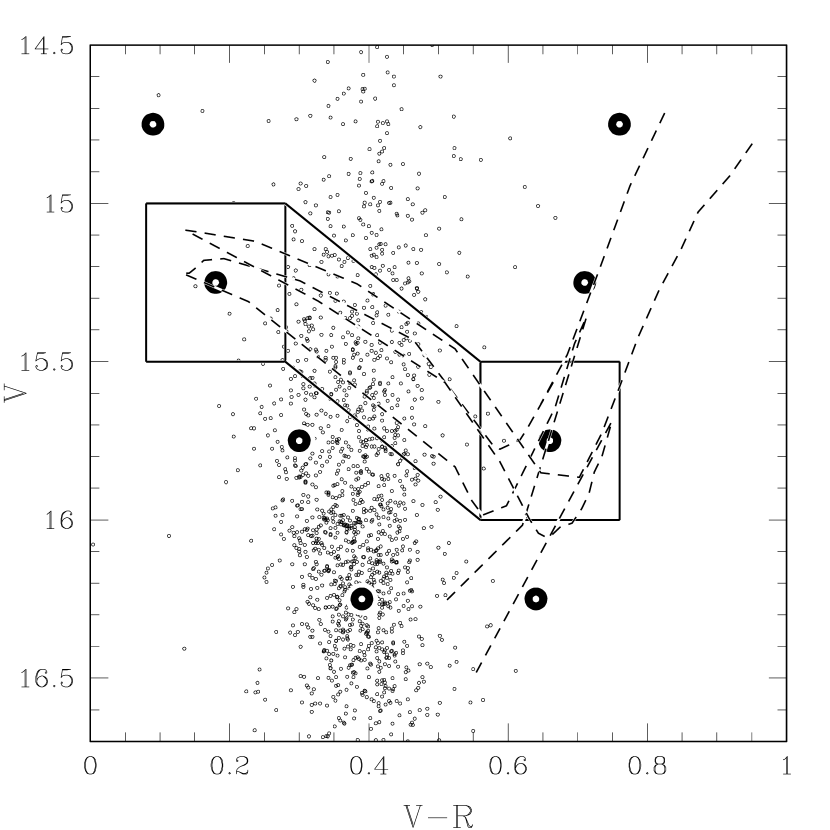
In Figure 4, we present a CMD also showing a parallelogram connecting the non-variable supergiant apertures used to count Cepheids. We plot the time-averaged magnitude and colors of 1720 Cepheids identified in the 9M CMD as small open circles (not all of these are within the limits of Figure 4). The smattering of very blue or red Cepheids may be attributed to photometric blends or differential reddening and do not affect this analysis. We assume the catalog of Cepheids is complete at this brightness. We also plot fiducial sequences for the non-variable supergiants as bold circles. These fiducial marks are calculated by assembling all stars within a 30 arcsecond radius of each Cepheid into color-frequency histograms, and adopting the center of the highest bin. The contrast of supergiants relative to the foreground Galactic disk stars is high because many Cepheids and non-variable supergiants are grouped in clusters and loose associations. As a check, we also perform a statistical subtraction of foreground stars predicted by our Galaxy model and remake the color-frequency histograms. The fiducial marks derived in this manner are consistent. The supergiant fiducial marks are listed in Table 1, along with other marks to be described later.
Also plotted in Figure 4 are two , stellar evolution model tracks. These are projected into the observable plane (,) with analytic approximations to the Bertelli et al. (1994) isochrone data. The tracks have been shifted to “fit” the supergiant fiducial sequences and also the color of the main sequence turn-off (not shown). The fit is judged by eye. For a fixed metallicity, the color difference between the red and blue supergiants is a function of initial mass. The color difference between the main sequence and red supergiants is also a function of initial mass (at a fixed metallicity). Thus, we are confident that the adopted apertures isolate supergiants with initial masses. The shifts are needed to place the model tracks “in the LMC,” i.e. to account for distance and reddening. We disregard the sloping initial mass function in this analysis because the time stars spend as helium-burning supergiants is small compared to their main sequence lifetimes. Although the model tracks extend outside of the apertures (notably the red aperture), the time spent outside is very small compared to the time spent inside. The model which enters in the lower right of the red aperture is from Schaerer et al. (1993), while the other model is from Fagatto et al. (1994). The Schaerer et al. (1993) model crosses the Cepheid aperture at a brighter magnitude than the Fagatto et al. (1994) model. Both models have a metal abundance and use the same Livermore opacity tables. The Schaerer et al. (1993) model has a helium abundance , while the Fagatto et al. (1994) model has . The treatments of convection (including overshooting) and mass loss are similar, but may differ in some details.
3.2 Counting Supergiants and Comparison with Theory
The numbers of non-variable red supergiants, blue supergiants, and Cepheids are , , and , respectively. If we make a 10% correction to for foreground stars, the blue to red supergiant ratio is = 0.43 and the ratio of Cepheids to non-variable supergiants is . We estimate an uncertainty of 10%, allowing primarily for the uncertainty in our foreground star correction. The blue edge of the Cepheid instability strip in our aperture is at mag and the red edge is at mag. Shifting the theoretical models to match the fiducial supergiant sequences in the 9M CMD provides a self-consistent color-temperature calibration for these stars. Using this calibration, we find the blue and red edges are and dex, respectively. We adopt the blue edge of the red aperture as dex.
Adopting the red edge of the blue aperture and the blue edge of the red aperture to demark the red and blue supergiant phases, the Schaerer et al. (1993) model predicts while the Fagatto et al. (1994) model predicts . We use the same segments of the model tracks as shown in Figure 4. Adopting the instability strip as derived above, we find and 0.109 for the Schaerer et al. (1993) and Fagatto et al. (1994) models, respectively. The agreement between our measurement and the single mass model predictions for is quite good. This consistency is strong support for these models accurately representing the physical processes by which these stars evolve. Once evolution across the Hertzsprung gap for the first blue loop is initiated in these models, it may proceed through the instability strip on a time scale that is fairly insensitive to the detailed differences in model input physics444This would make sense for the the first, or the fourth and fifth crossings (Becker 1981), because these proceed on the thermal (Kelvin-Helmholtz) time scale of the envelope. However, the first blue loop proceeds on a nuclear time scale of the core (Kippenhahn & Weigert 1990), which might be just as sensitive to model input physics as evolution at the each end of the blue loop.. In contrast, it would appear that evolution at each end of the blue loop is quite sensitive to differences in the model input physics. The nearly equal number of red and blue supergiants predicted by the Fagatto et al. (1994) model is difficult to reconcile with our measured ratio. We speculate that subtle differences in the parameterized treatments of convection may be the cause of this discrepancy between models.
The agreement between our measured ratio for supergiants and the model predictions has several interesting implications. If the instability strip crossing time is nearly independent of model input physics, we infer that the models accurately predict the total time these stars spend as helium-burning supergiants. Since the ratio of hydrogen to helium-burning lifetimes for intermediate-mass stars is sensitive to the treatment of convective overshooting (Lattanzio et al. 1991), our result lends support to the overall amount of parameterized convective overshoot in these two models examined, despite the detailed differences found.
There are additional implications for the Cepheids. A theoretical Cepheid period-frequency histogram calculated by assuming a constant star formation rate and a Salpeter (1955) initial mass function predicts fewer Cepheids than observed in the LMC bar, which has been interpreted as a short duration “burst” of star formation 100 Myr ago (Alcock et al. 1998b). The inference of a burst is likely a model-independent result because the time spent in the instability strip is very nearly the same for the two models examined here. However, we caution that results pertaining to the peak of the Cepheid period-frequency histogram in Alcock et al. (1998b) are strongly model dependent, since the peak number of Cepheids in a period-frequency histogram corresponds to the time spent at the tips of those blue loops that enter the instability strip ( in the LMC). Finally, we note that neither of the two models examined here have second blue loops. However, the uncertainty of our measured ratio is too large to rule out or confirm the existence of a small number of Cepheids on second blue loops.
An additional interesting implication of the ratio in the 9M CMD pertains to the discovery of 600 Cepheids with mag and periods 2.5 day (Alcock et al. 1998b, see also Alves et al. 1998). These Cepheids clearly lie below the observed blue supergiant sequence in the 9M CMD, implying evolution via a “non-standard” channel. Alcock et al. (1998b) propose that the faint Cepheids are merged binaries, formerly two 1.5 stars. Indeed, these stars may be ubiquitous if a major burst of star formation occurred 3 Gyr ago. The number of merged 2.5 stars that produce 5 Cepheids is calculated by scaling from the faint Cepheids, as follows. We assume a Salpeter (1955) initial mass function, vis. , and a constant star formation rate over the period of time during which 1.5 to 2.5 Cepheids are born in the LMC. In this case, the number of Cepheids produced by binary mergers would be . Adding this to the number of Cepheids predicted from the number of red and blue supergiants yields = 460, which compares with = 280 observed.
It may be difficult to reconcile the binary merger hypothesis for the origin of the low luminosity Cepheids with the ratio for 5 Cepheids. First, it is unlikely that merged binaries will follow single star evolution paths through the red and blue supergiant phases if the Cepheid loop is triggered by the discontinuity in the chemical profile of the envelope as suggested by theory. There is no obvious mechanism by which the necessary envelope discontinuity would form during, or after, a binary merger. Therefore, merged binaries would not produce the correct numbers of Cepheids and non-variable red and blue supergiants. Second, while it is possible that the star formation history of the LMC conspired to produce very few 2.5 stars (thus avoiding the problem of too many 5 merged-binary Cepheids), this requires very fine tuning of the star formation history. If the 5 models are to be trusted, we conclude either (1) the probability of binary mergers is much lower for higher mass LMC stars, and thus only low luminosity Cepheids are produced from binary mergers, or (2) binary mergers are not responsible for the curious low luminosity Cepheids.
4 Old Stellar Populations: The Data
4.1 9M CMD Fiducial Marks
Fiducial marks on the giant branch are defined as the peak of color-frequency histograms in = 0.5 mag bins centered on the values listed in Table 1 ( = 16.75, 17.25 17.75, 18.25, and 19.75 mag). The fiducial marks were measured separately for each of 22 MACHO survey fields555Although it is beyond the scope of this work to provide a detailed comparative analysis of these 22, 0.4 million star CMDs, we remark on a few outstanding field giant branches (see Alcock et al. 1997, their Fig. 1). Fields 11 and 82 appear to suffer from notably large amounts of differential reddening. Fields 3, 77, and 80 are quite red (these are adjacent, running North from near the center of the bar). We speculate that there is a higher degree of foreground reddening for these fields (i.e. possibly a foreground dust cloud). Field 7 had the bluest giant branch (it is adjacent and South of field 77), and we suspect a particularly small degree of foreground reddening. included in the 9M CMD (see Alcock et al. 1997). In some cases, no clear peak was evident at = 19.75 mag (fields 11, 15, and 81), and these fields were excluded when calculating this average mark. The average marks should accurately represent the shape (i.e. curvature) of the giant branch in the 9M CMD; they are listed in Table 1. We find a standard deviation for each of the mean RGB fiducial marks of = 0.04 mag, which gives an indication of the natural width of the giant branch (due possibly to superposed RGBs and AGBs, but also differential reddening throughout the bar).
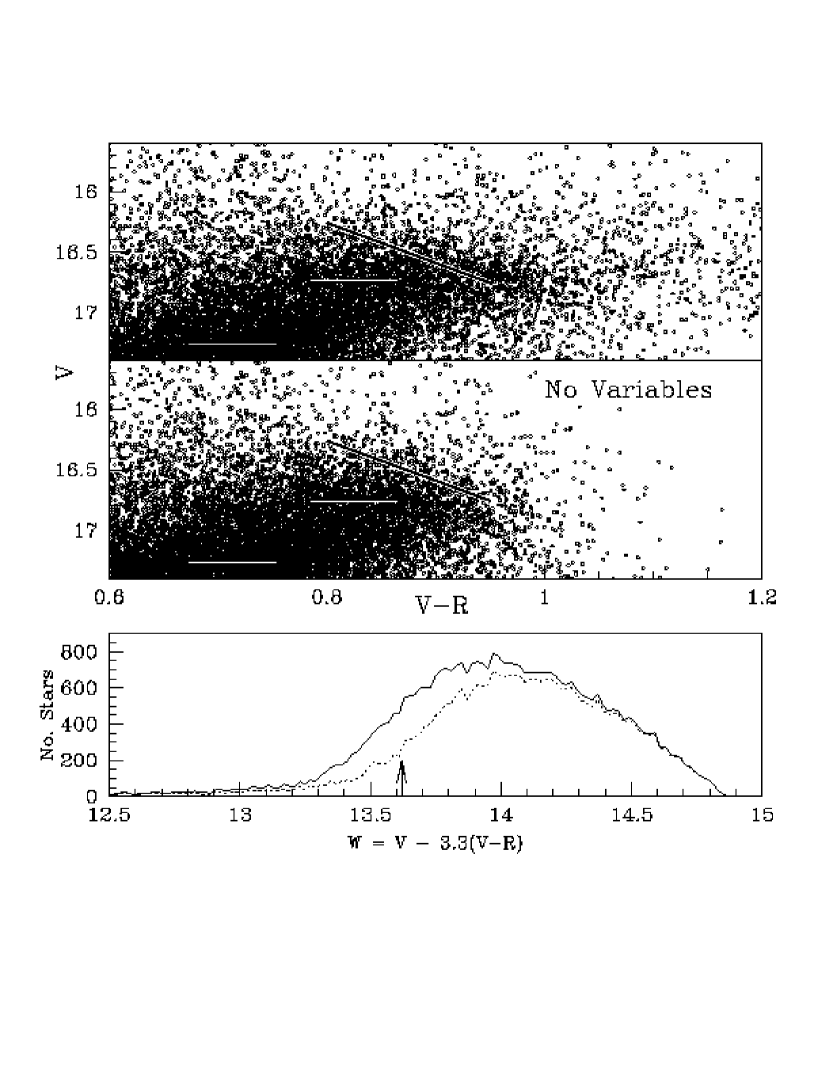
In the top panel of Figure 5, we plot as small circles a random 10k stars from the 9M CMD located near the tip of the RGB (tip-RGB). In the middle panel, we show a different 10k sample of stars, where we have now excluded all candidate variable stars. The horizontal lines in these two panels are the giant branch fiducial marks (these show mag in color). The angled mark corresponds to mag for mag. The derivation of this fiducial mark is illustrated in the bottom panel. Here, we plot histograms of all stars in this region of the 9M CMD (not just the 10k subsets shown in the upper two panels) projected along the vector. The bin-size is 0.02 mag. The solid line shows all stars, while the dotted line shows all non-variable stars. The luminosity functions fall off at large because we only count stars within the limits of shown in the upper two panels. The slope of the vector was chosen by eye. (Trials with different slopes did not change the result.) We calculate the difference in height between consecutive bins, divided by the square root of the mean number of stars in the two bins as a measure of the “step” which occurs at the tip-RGB. Both histograms yield = 13.62 as the most significant step, which is marked with an arrow in the bottom panel of Figure 6. However, the lack of a well-defined tip-RGB is the most notable feature of these luminosity functions. This may be due to photometric blends, differential reddening, mixed age and metallicity LMC populations on the giant branch, or a combination of these effects. In Table 1, we list the blue and red tip-RGB at = 0.80 and 0.95 mag, = 13.62 mag.
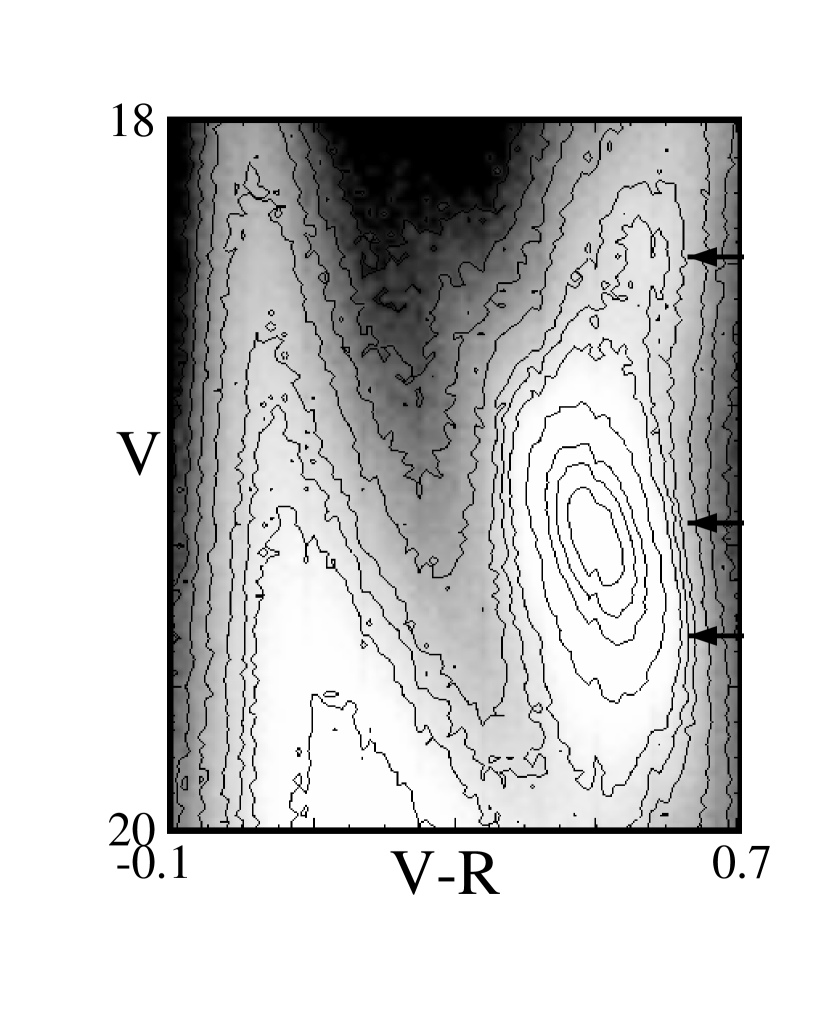
In Figure 6, we show a log-scaled Hess diagram of the region around the horizontal branch in the 9M CMD. Axes run from to 0.7 mag and = 20 to 18 mag. Bin size is = 0.01 mag and = 0.02 mag. We plot logarithmic contours at 1.8, 2.0, 2.2, 2.4, 2.6, 2.7 (near the AGB-bump), 2.8, 3.0, 3.2 (near the red HB clump), 3.3 and 3.4 dex. On the right-hand axis of Figure 6 and in order of decreasing brightness, we mark the fiducial magnitudes for the AGB-bump, red HB clump, and field RR Lyrae variables. These brightnesses and associated colors are also listed in Table 1. For the first two, we adopt the peak pixel value from smoothed versions of the 9M CMD. Two-dimensional gaussian profile fitting to these “bumps” yielded consistent results. The derivation of the median brightness of RR Lyraes is described in the next section.
4.2 RR Lyrae Sample Selection
The sample of RR Lyraes was selected as follows. We used a period–amplitude diagram from the one-year variable star catalog666This catalog consists of all LMC variables identified with poor fits to constant-brightness one-year MACHO lightcurves and includes phasing information. to identify candidate type “ab” RR Lyrae (RRab) with periods between 0.46 and 0.71 day and amplitudes between 0.1 and 1.7 mag (MACHO instrumental blue photometry). Four-year lightcurves were then extracted for 3728 stars, excluding candidates in 6 fields covering the central region of the LMC bar777Exlcuded fields are 1, 7, 9, 77, 78 and 79 (see Alcock et al. 1997, their Figure 1). These are “Round-1” fields with a different naming convention in the year-one catalog and the four-year lightcurve database.. Next, approximately 185 candidate RRab were then eliminated for poor lightcurve quality and uncertain periods (periods were derived with a “supersmoother”; Reimann 1994). We sorted the individual photometric measurements in each lightcurve by increasing brightness and adopted the 3rd and 97th percentiles as maximum and minimum light, which yielded pulsation amplitudes (a procedure robust against outlying measurements and also small errors in the periods). A few stars with suspect amplitude ratios (/) were discarded (a cut designed to remove eclipsing binaries in the sample; Minniti et al. 1996). Time-averaged, flux-weighted mean magnitudes and colors were then calculated, and a small number of stars with very red colors ( mag) were also discarded. The final sample contains 3454 RRab stars.
The completeness of this RRab catalog is uncertain. Preliminary artificial star tests suggest that we are 50–90% complete for stars at the mean brightness of the LMC RRab. Furthermore, these tests demonstrate that our photometry is relatively unaffected by Malmquist bias. If we detect an RRab in our image data, then we will likely identify it as a variable because of the typically large pulsation amplitudes. Other effects, such as period aliasing in the MACHO photometry data (i.e. at 0.5 day), will tend to lower the completeness. There is no reason to suspect that this RRab catalog suffers from any spatially-dependent incompleteness bias. We emphasize that the 16 fields analysed here do not include the most crowded fields in the very center of the bar. A modest degree of spatially-uniform incompleteness in this RRab catalog will not affect the results of this paper.
We define two subsamples of the RRab catalog in order to calculate different mean properties. The first subsample we define is for consideration of the period-amplitude diagram, which we will refer to as the Bailey diagram sample. We begin with the 35% least crowded888For each photometric measurement in the full MACHO database, there is a “crowding parameter” which gives the percentage flux inside the PSF fit box contributed by neighboring stars. It is useful to think of the least crowded stars as living in “empty” patches of sky scattered througout the otherwise crowded LMC bar., or about 1280 RRab. Next, we make strict cuts in magnitude , eliminating highly reddened stars (whose amplitudes may be underestimated because of Malmquist bias at minimum light), the numerous blended stars (whose amplitudes will certainly be underestimated because of the contaminating flux), and foreground RR Lyrae (Alcock et al. 1997b). This cut is similar to a “sigma-clip,” and leaves 935 RRab.
Next, we define a CMD RRab sample. We remove the sigma-clip to guard against a possible bias in our estimate of the median color and brightness of the RRab. However, we tighten the crowding cut to exclude all but the 20% least crowded, or about 680 RRab. Without the sigma-clip, this sample contains a few bright RRab blended with blue (main sequence) and red (giant branch or clump) stars in the CMD. Some of the brighter stars may also be evolving off of the “zero-age” horizontal branch. There are also fainter and redder RRab which are most likely affected by differential reddening in the LMC. The median color and magnitude of this RRab subsample is = 19.45, = 0.31 mag, which is listed in Table 1.
The ancient LMC clusters NGC 1835 and NGC 1898 each reside in one of the 6 fields excluded from the RRab catalog described above. Therefore, we have identified a few RRab in these clusters by culling through the MACHO database “by hand.” No effort was made to identify complete samples. Variables lying within 1 arcmin of each cluster center are assumed to be members. We identify 8 RRab in NGC 1835 and 5 RRab in NGC 1898. This is the first report of RR Lyrae in NGC 1898. Walker (1993) and Graham and Ruiz (1977) have also discovered RR Lyraes in NGC 1835. The properties of the RRab in these two LMC bar clusters are summarized in Tables 2 and 3. We assume the mean colors and magnitudes are representative of each cluster.
Last, we refer to Alcock et al. (1997c) for the discovery of 75 multimode (RRd) stars in all 22 of these fields. The calibration of MACHO photometry to Kron-Cousins and described in Alcock et al. (1999) supersedes the calibration used in Alcock et al. (1997c). Mean properties of these RRd are now: and mag.
4.3 AGB Sample Selection
In order to study the AGB in the 9M CMD, we begin with the 88000 candidates in the four-year LMC variable star catalog. Each lightcurves is calibrated to and and time-averaged, flux-weighted mean magnitudes and colors are calculated. The statistical cuts used to identify candidate variable stars are looser in this four-year catalog than those used to generate the one-year catalog (the latter was used to select the RRab). We remind the reader that the MACHO variable star catalogs are a by-product of the microlensing searches (Alcock et al. 1997), and subject to the designs of those analyses, not the present one. In order to “clean-up” the relatively loose-cut four-year variable star catalog, we calculate a Welch-Stetson variability index (Welch & Stetson 1993) and several lightcurve quality statistics. Applying cuts with these statistics, we reduce the catalog to a sample of 19000 of the most significantly variable stars, including only those with the highest quality lightcurve data. The AGB variables in this “clean” sample are analysed in the next section.
5 Old Stellar Populations: Analysis
Simple theories of galactic chemical evolution predict that progressively younger stellar populations will be more metal-rich. Analyses of planetary nebulae confirm that the young stellar populations in the LMC are more metal-rich than the old stellar populations (Dopita et al. 1997). Age–metallicity data for LMC clusters show the same trend (Da Costa 1998), although comparing the field and cluster histories may not be strictly appropriate (van den Bergh 1998). If two old populations are required to account for features in the 9M CMD, we assume that the younger population is relatively more metal-rich.
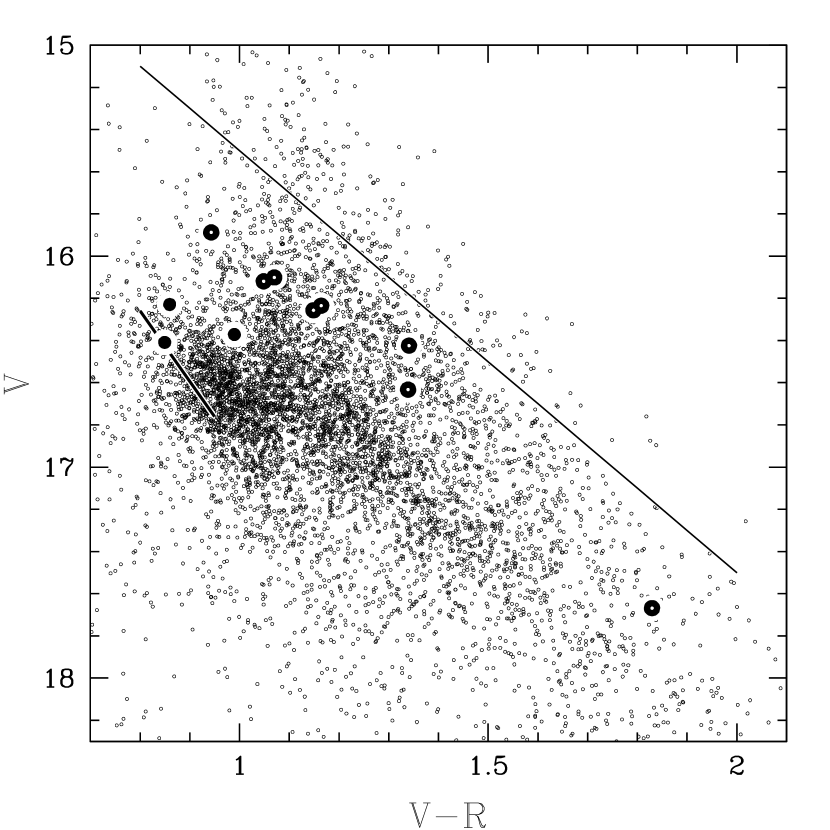
5.1 The AGB
In Figure 7, we plot the clean sample of AGB variables with small circles. We show the tip-RGB as the steeply-angled mark running from mag. The thin solid line corresponds to mag, which runs approximately parallel to the extended sequences of AGB stars. AGB variables from the LMC clusters NGC 1898 (bold dots) and NGC 1783 (bold circles) are also shown. The data for these cluster AGB variables are summarized in Table 4 (see Alves et al. 1998 for lightcurves).
NGC 1783 is a 2 Gyr old cluster located well outside of the LMC bar (Mould et al. 1989). The MACHO photometry data for this outer disk LMC field are transformed to Kron-Cousins and by comparison with the standard stars of Alvarado et al. (1995). Finding charts and original AGB star identifications are found in Lloyd Evans (1980), near-infrared photometry and are assembled from Frogel et al. (1990), and spectral types from Mould et al. (1989). The spectroscopic metallicity of NGC 1783 is [Fe/H] = dex (Cohen 1982). NGC 1898 is an ancient LMC cluster located in the bar (Olsen et al. 1998). The spectroscopic metallicity is [Fe/H] = dex (Olszewski et al. 1991). Finding charts, near-infrared photometry, and for these AGB stars are given in Aaronson and Mould (1985).
The AGB in Figure 7 shows a rich morphology. We draw attention to the concentration of AGB variables lying near to the tip-RGB. Offset from this concentration are two extended sequences, both running approximately parallel to the = 13.5 line. The fainter sequence is the most prominent. The variables from NGC 1783 lie along the brighter sequence, showing that the variables on the brighter AGB sequence are consistent with an “intermediate-age” LMC bar population (like NGC 1783). The variables from NGC 1898 lie in the concentration near the tip-RGB, and not along the either of the extended sequences. We conclude that the concentration of AGB variables near the tip-RGB are consistent with an old and metal-poor LMC bar population (like NGC 1898).
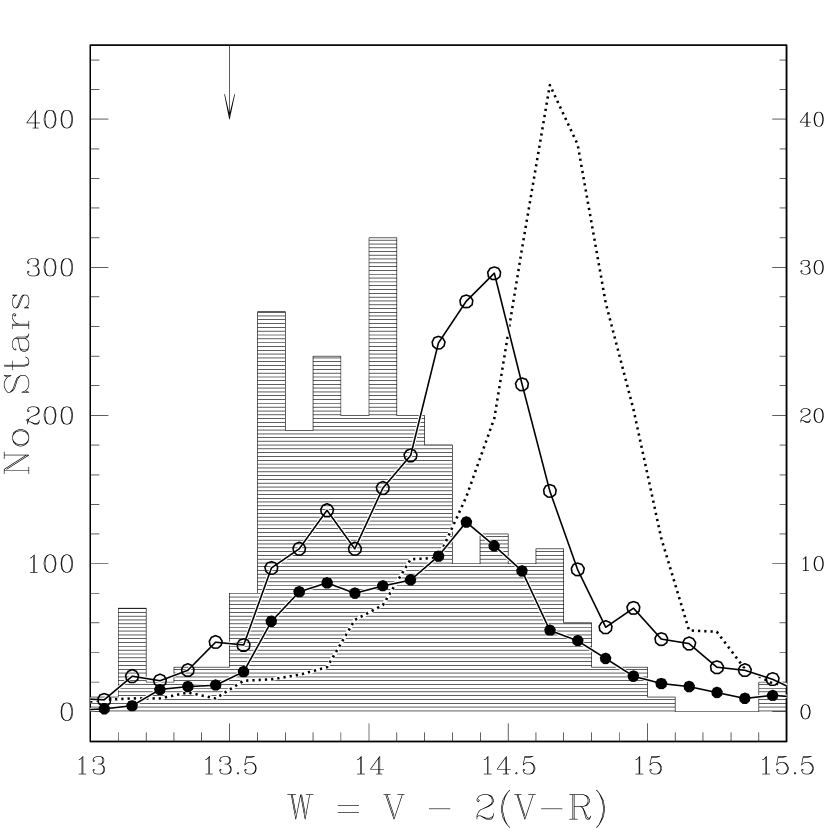
Figure 8 shows four luminosity functions. Three of these histograms represent different color cuts through the AGB variables shown in Figure 7. The dotted line represents mag, the solid line with open circles shows mag, and the solid line with solid circles shows mag. These luminosity functions have bin sizes of 0.1 mag; the left axis gives the number of stars in each bin. The luminosity function for 266 known carbon stars (Blanco, McCarthy, & Blanco 1985) is indicated with the shaded histogram (the bin size is also 0.1 mag). The number of carbon stars is given on the right axis. We mark = 13.5 with an arrow, which corresponds to the thin solid line in Figure 7.
First, consider the 9M CMD stars in the two histograms with the reddest colors (open circles and solid circles in Fig. 7). These clearly show the bimodality of the AGB. We note that the ratio of the number of stars on the faint AGB sequence to those on the bright AGB sequence is higher in the intermediate color-cut histogram (open circles) than in the reddest color-cut histogram (filled circles), an effect primarily due to the relatively more rapid decrease in the number of stars along the faint sequence.
The distribution of carbon stars rises sharply at 13.5 mag, coincident with the rise in the number of AGB variables. We do not know the completeness of this sample of carbon stars identified in the 9M CMD. However, if the true carbon star luminosity function does not rise dramatically (i.e., a second peak in ), we conclude that the majority of stars on the faint AGB sequence and those concentrated near the tip-RGB (dotted line) are likely oxygen-rich, not carbon-rich. Note that the AGB variables in the clusters are mostly located along one or the other AGB sequence. This suggests how AGB stars from different age populations evolve through the 9M CMD. Intermediate-age populations produce both carbon and oxygen-rich AGB stars, but very old populations produce only oxygen-rich AGB stars. Surveys for carbon stars in clusters tell us that the characteristic transition age for a stellar population to begin producing carbon stars increases with decreasing metallicity. This transition age may be 3 Gyr for solar metallicity, but is much older for low metallicities, i.e. 10 Gyr at dex (Bessell, Wood, & Lloyd Evans 1983). No ancient LMC clusters have carbon stars (Frogel et al. 1990). Therefore, if we assume that the two extended AGB sequences arise from distinct populations, and assume that the population responsible for the faint AGB sequence does not produce carbon stars, then if the AGB variables on the faint sequence are metal-poor, they are likely quite old.
In summary, most of the highly-evolved AGB stars in the 9M CMD are variable. Some of the AGB variables concentrate near the tip-RGB. These stars are consistent with being old and metal-poor, like AGB variables in the cluster NGC 1898. Offset from this concentration are two extended AGB sequences, both running approximately parallel to the vector . The AGB variables on the bright sequence are consistent with being 2 Gyrs old and having a metallicity , like AGB variables in NGC 1783. The majority of AGB variables on the faint sequence and in the concentration near the tip-RGB are likely oxygen-rich, not carbon-rich. This may imply they are quite old, if they are fairly metal-poor. We caution that the latter inference depends on the completeness of the Blanco, McCarthy, and Blanco (1985) carbon star survey data in the MACHO fields analyzed here.
Stellar evolution theory relies heavily on observations of AGB stars in the LMC to tune various free parameters in AGB star models. For example, the models are tuned to reproduce the carbon star luminosity function in the LMC and SMC (Marigo et al. 1996). Therefore, logical inferences from these models regarding the detailed make-up of the LMC stellar populations would be disconcertingly circular. However, we note that our discussion about which stellar populations produce carbon stars, and what path of AGB evolution is followed through the 9M CMD is consistent with extant theory. It would be particularly interesting to use the numbers of AGB stars along the extended sequences to derive stellar evolutionary lifetimes and test the AGB models. In addition, analysis of the pulsation properties of these many AGB variables will be very important to the accurate interpretation of their ages and metallicities.
5.2 The RR Lyrae
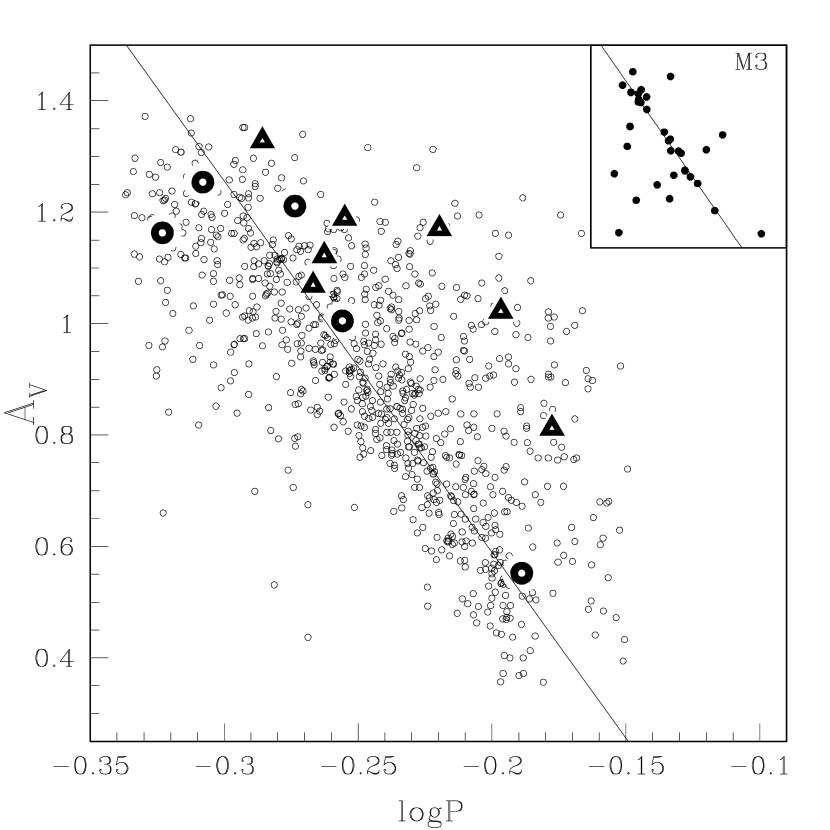
Figure 9 is the Bailey period-amplitude diagram, which shows the RRab from the 9M CMD (small circles), those from NGC 1898 (bold circles), and those from NGC 1835 (bold triangles). In the inset, we plot RRab from the Galactic globular cluster M3 (Kaluzny et al. 1998). The axes of the inset are the same as those in the main panel. We define a reduced period,
| (1) |
and calculate the median value for M3, . This line is plotted in the inset, and again in the main panel. The median reduced period of the RRab in the 9M CMD is . Although the 9M CMD RRab define a prominent ridge line, their distribution is asymmetric. They form a “cloud” to the right of the ridge line with larger amplitudes and longer periods.
The reduced period correlates with metallicity. We derive the following calibration using high-quality -band lightcurves of RRab in the Galactic globular clusters M3, M5, and M15. Data for M5 are assembled from Reid (1996), M3 from Carretta et al. (1998), and M15 from Silbermann and Smith (1995), from which we calculate median reduced periods: , , . We adopt metallicities of , , and taken from Sandquist et al. (1996), Carretta et al. (1998), and Silbermann and Smith (1995) for M5, M3, and M15, respectively. These yield a calibration,
| (2) |
As a check of this calibration, we assemble , , and spectroscopic data for 86 nearby Galactic field RRab from Jurscik and Kovacs (1996). We shift the Jurscik and Kovacs (1996) metallicity scale by dex to place it on the scale of our clusters. Our calibration predicts the metallicity of these RRab with an accuracy of per star.
The median metallicity of RRab in the 9M CMD is , which agrees with the mean spectroscopic metallicity of 15 field RRab presented by Alcock et al. (1996), dex on the scale of Zinn and West (1984). For the NGC 1898 and NGC 1835 cluster RRab, we find and dex, respectively (errors are statistical only). Our metallicity for NGC 1835 agrees with the spectroscopic value ( dex) from Olszewski et al. (1991) and Walker’s (1993) estimate of dex. Our metallicity for NGC 1898 is slightly lower than the spectroscopic metallicity ( dex) found by Olszewski et al. (1991). Following the discussion of Kaluzny et al. (1998) for M3, the metallicity of RRab in the 9M CMD may be on the scale of Carretta and Gratton (1997).
The RRab in the LMC bar define a prominent ridge line in the Bailey diagram similar to the ridge line defined by RRab in M3, which we interpret as indicating similar mean metallicities. The 9M CMD RRab with higher amplitudes and longer periods are consistent with a tail in the metallicity distribution to lower values. Observational evidence strongly suggests that some RR Lyraes in the LMC have metallicities as low as dex (Walker 1992, Alcock et al. 1996). However, we caution that the distribution of RRab in the Bailey diagram is subject to evolutionary effects, and perhaps also population effects (i.e. age), which we have neglected here.
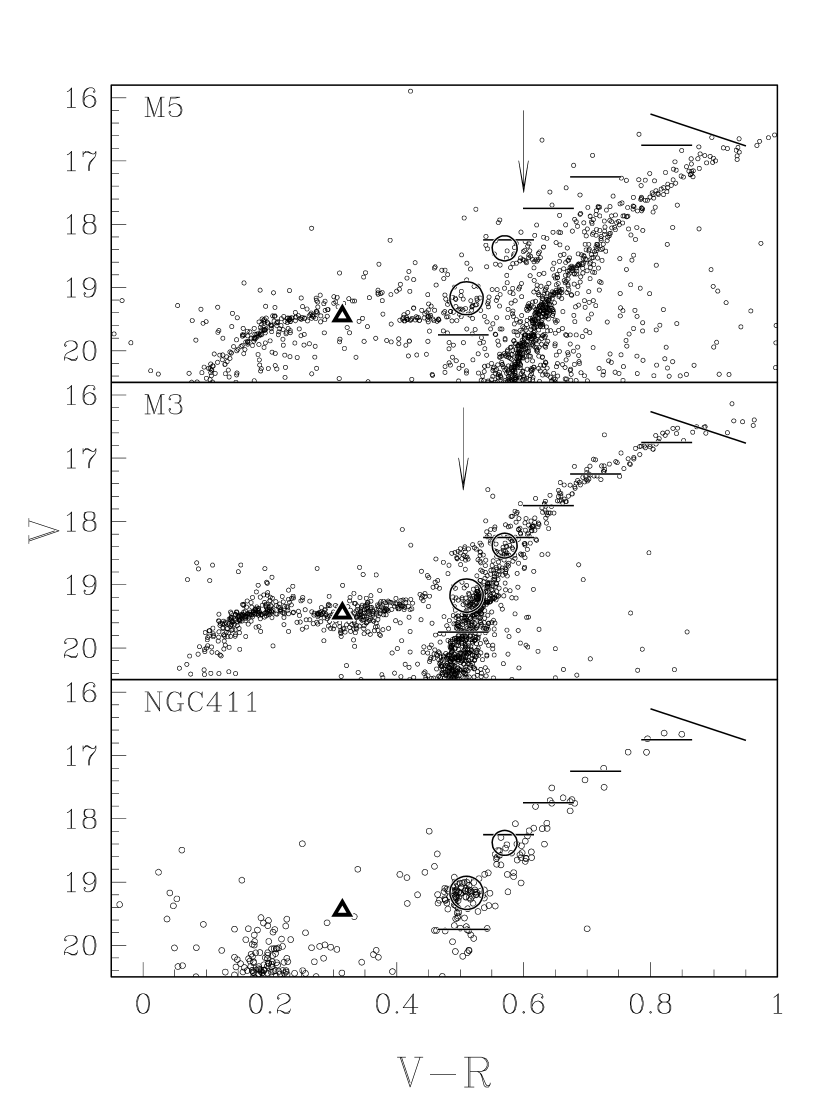
5.3 The Giant Branch and AGB-Bump
When cluster ages are the same to within a few Gyr, the dereddened colors of their giant branches yield accurate relative metallicities (Sandage & Smith 1966, Da Costa & Mould 1986, Sarajedini 1994). Each panel in Figure 10 compares the 9M CMD horizontal branch and the giant branch fiducial marks with CMD data for three different clusters. The 9M CMD fiducial marks are as follows. The median color and brightness of the RRab are indicated with an open triangle, the red HB clump with a large open circle, and the AGB-bump with a small open circle. Dash marks show the giant branch and the tip-RGB.
In the top panel of Figure 10, we plot the CMD of M5 (Sandquist et al. 1996). In the middle panel, we plot the CMD data of M3 (Ferraro et al. 1997). In these two cases, we have transformed their photometry using , which follows from Alcock et al. (1997c; see also Bessell 1990). Next, we calculate shifts to match the mean magnitudes and colors of the cluster RRab with the 9M CMD fiducial mark. For M5, we assemble data for 11 RRab from Storm, Carney, and Beck (1991; see also Sandquist et al. 1996) and calculate and mag, yielding shifts of and mag to place this cluster “in the LMC.” Using the sample of M3 RRab from Carretta et al. (1997), we find and mag, and shifts of and mag. In the bottom panel of Figure 10, we show the SMC cluster NGC 411, which is 1.5 Gyr old and has a metallicity of (Alves & Sarajedini 1999). With the NGC 411 data transformed to as above, they are shifted and mag to match the location of the 9M CMD red HB clump (the fit is by eye).
Figure 10 shows that the color of the giant branch in the 9M CMD is well-matched by the giant branch of M3. If the difference in color between the RRab and the giant branch, , depends only on metallicity, this may imply that the metallicity of the old field population in the bar is similar to that of M3. However, this interpretation ignores the influence of the second parameter (Sandage & Wildey 1967, Stetson et al. 1996) and the finite width of the fundamental mode instability strip (Bono et al. 1997). Although we avoided making numerous assumptions about the distance and reddening to the LMC and these clusters by registering the RRab, metallicity and the second parameter are degenerate in this comparison.
Consider for the classical second-parameter pair of Galactic globular clusters, M3 and M13. We assemble the photometry of Guarnieri et al. (1993) for M13 and the photometry of Pike and Meston (1977) for the one RRab in this cluster. We find mag for M13, which compares to mag for M3. Using the HB morphology index999This index is defined as the number difference between blue () and red () HB stars, divided by the total number of HB stars, including the number of RR Lyrae (). We use lower case to distinguish from magnitudes, i.e. . The index runs from to 1 for completely red and blue HBs, respectively. of Lee et al. (1994), these clusters have = +0.08 and +0.97, respectively (Catelan & de Freitas Pacheco 1995). The cluster with the redder HB morphology has redder RRab (although M13 has only one RRab). For comparison, a spline fit to the giant branch fiducial marks yields for the 9M CMD, which is close to the value for M3.
Figure 10 also shows that the giant branch and red HB clump in the 9M CMD are consistent with an NGC 411-like population. An “intermediate age” population in the LMC bar older than 1.5 Gyr and more metal-rich than dex is unlikely to contribute significantly to the 9M CMD giant branch. This is somewhat more metal-poor (and younger) than often suggested for the intermediate age population in the LMC, but is consistent with other recent analyses (e.g. Bica et al. 1998). It is unlikely that an NGC 411-like population accounts for all of the red HB clump stars in the 9M CMD unless the main-sequence luminosity function analysis of Hardy et al. (1984) is seriously in error. Finally, we note that an M3-like HB is not responsible for the bright red HB clump in the 9M CMD.
We have drawn arrows in Figure 10 indicating the AGB-bumps in M3 and M5. The cluster AGB-bumps have similar brightnesses to the AGB-bump in the 9M CMD, which supports our identification of this feature (see also Gallart 1998), and our association of the AGB-bump with an old and metal-poor population. However, the AGB-bump in M3 is distinctly bluer than the AGB-bump in the 9M CMD. At a constant metallicity, the AGB-bump will appear redder for progressively more massive HB progenitor stars, until the AGB-bump lies near the Hayashi line. At this point, even more massive HB stars will populate similar color AGB-bumps, but with higher luminosities (Castellani, Chieffi, & Pulone 1991). The AGB-bump for a population as young as NGC 411 would be 0.7 mag brighter than the AGB-bump in the 9M CMD (Alves & Sarajedini 1999). In summary, the brightness of the AGB-bump in the 9M CMD associates this feature with an old population, while the color of the AGB-bump strongly suggests a red HB morphology.
5.4 The Horizontal Branch and AGB-Bump
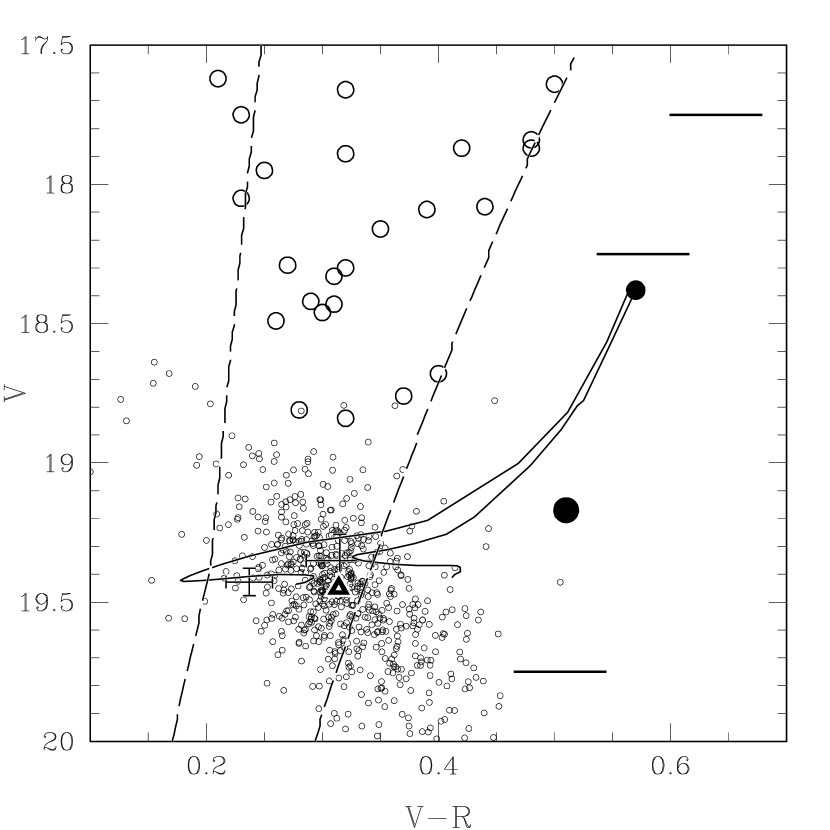
In Figure 11, the 9M CMD fiducial marks for the RRab, red HB clump, the AGB-bump, and giant branch are plotted with the same symbols used in Figure 10 (except that the red HB clump and AGB-bump are now filled circles). We plot individual RRab stars as small open circles. The mean magnitudes and colors of the RRab in the clusters NGC 1898 and NGC 1835 are shown with error bars. We additionally plot twenty-four candidate post-HB variables (large open circles), also known as BL Hers101010 BL Hers are related to the W Virginis (Type II Cepheids) and RV Tauri variables (Alcock et al. 1998).. These post-HB variables were found in a search of the four-year catalog (see §4.3) for stars with mag, mag, and periods in the range of day. No effort was made to identify a complete sample. The post-HB variables help define the instability strip (IS) for the old and metal-poor population in the 9M CMD.
We also plot the and 0.75 , =0.0004, scaled-solar HB models of Castellani, Chieffi, and Pulone (1991) in Figure 11 with solid lines. The lower mass model begins on the zero-age HB near the center of the instability strip (dashed lines). Both of the HB model tracks are truncated at their mean AGB-bump luminosity. The color-temperature calibration is the same analytic approximation to the Bertelli et al. (1994) isochrone data used throughout this paper. In this analysis, we shift the end-points of these two HB model tracks to match the location of the AGB-bump in the 9M CMD, which re-calibrates color and temperature to account for the LMC distance and reddening. We show the prediction of Bono et al. (1997) for the fundamental blue and red edge of the instability strip (IS), for a mass . The good agreement between the theoretical IS and the distribution of these 9M CMD variables over several magnitudes in brightness strongly supports our color-temperature calibration, and the theoretically-predicted IS for the fundamental mode pulsators (Bono et al. 1997).
Figure 11 shows that the 9M CMD field RRab lie very close to the red edge of the IS. The tail of RRab fainter and redder than the theoretical IS are likely due to differential reddening in the LMC bar. The median brightness and color of the 9M CMD field RRab are consistent with the mean color and brightness of RRab in NGC 1898, and significantly redder than the mean color and brightness of RRab in NGC 1835. The HB morphology indices for NGC 1835 and NGC 1898 are = and , respectively (Olsen et al. 1998). As for the case of M3 and M13, these relative mean RRab colors correlate with the overall HB morphology111111The LMC clusters NGC 1898 and NGC 1835 have different metallicities, which is not the case for M3 and M13. Thus, the LMC clusters are not necessarily showing second parameter effects.. Thus, we infer an HB morphology for the old and metal-poor field population in the 9M CMD that is at least “as red” as the HB in NGC 1898. Specifically, this comparison suggests an HB morphology index of 0.
Next, we consider the HB morphology index for the two HB models shown in Figure 11. For the model, the time spent in the IS is 90 Myr, while the time spent in the AGB-bump is 4 Myr. This model predicts a ratio of AGB-bump to HB stars . This model would correspond to the case of because the model track begins near the middle of the IS. The model predicts 22 Myr in the IS, 65 Myr redward of the IS, and 4 Myr in the AGB-bump. This model also predicts . If we assume , the model predicts , , and . This is a plausible HB morphology for this model given the red color of the zero-age HB and assuming a small HB mass dispersion, as used for model HB constructions (e.g. Lee et al. 1994). In summary, the model should have while the model should have .
Assuming that our RRab catalog is 50% complete, correcting for the 6 excluded fields (22/16), and accounting for type “c” variables with a ratio of RRab/RRc = 3/2 (Kinman et al. 1991), we estimate the total number of RR Lyraes in the 9M CMD to be stars. We count the number of AGB-bump stars as follows. First, we fit a power-law to a differential luminosity function of the giant branch (the number of stars with mag per 0.02 mag bin, and with 17 mag). We extrapolate the fit to fainter magnitudes and subtract it from the data. This reveals a clear “excess” of stars on the giant branch totaling stars. The observed ratio of AGB-bump to RR Lyrae stars in the 9M CMD is , which is nearly eight times the model prediction.
Adopting the ratio of AGB-bump to HB stars from the models and assuming , the ratio yields , or . We compare this HB morphology index to those of ancient LMC clusters in the next section. Scaled by the number of RR Lyrae variables, this HB morphology predicts red HB clump giants, which is probably uncertain by a factor of 2. In any case, is a very large number. Finally, we estimate the total number of red HB clump stars in the 9M CMD to be (the measurement procedure was similar to that described for the AGB-bump). By inspection of Figure 6, we conclude that 455000 red HB clump giants associated with the old and metal-poor field population could only lie under the main peak of the observed red HB clump, which therefore likely indicates their mean brightness.
5.5 Summary and Discussion of Old Populations
The field of the LMC bar is composed, in part, of an old population that produces RR Lyrae variable stars. This population appears to have a metallicity of , as evidenced by spectroscopy of RRab (Alcock et al. 1996), the distribution of RRab in the Bailey diagram, and the color of the giant branch in the 9M CMD. In some respects, the Galactic globular cluster M3 is a satisfactory template for this old and metal-poor population. However, M3 does not have enough bright red HB clump stars, and its AGB-bump is bluer than the AGB-bump in the 9M CMD. It is likely that some of the bright red HB clump stars in the LMC bar represent an intermediate-age population. We suggest that the 1.5 Gyr old, cluster NGC 411 is a suitable template for this population. The AGB-bump for an NGC 411-like population121212An AGB-bump in NGC 411 has not been observed, which is probably consistent with the small number of bright giant branch stars in the cluster. would be redder than the AGB-bump in M3, but much brighter than the AGB-bump in the 9M CMD. Thus, while a simple model for old populations in the 9M CMD might consist of two components similar to the clusters M3 and NGC 411, we find some discrepancies in detail.
The highly-evolved AGB in the 9M CMD shows three prominent features: (1) a concentration of stars near the tip-RGB consistent with an old and metal-poor population like NGC 1898, (2) an extended faint sequence which lacks carbon stars, and (3) an extended bright sequence which runs parallel in the 9M CMD to the more prominent faint sequence. The bright sequence is consistent with an intermediate-age population like NGC 1783 (or NGC 411). The population associated with this bright AGB sequence may account for the majority of LMC carbon stars. We suggest that the multiple AGB sequences in the 9M CMD represent discrete old populations in the LMC bar. The concentration of stars near the tip-RGB and those on the faint sequence may be old and metal-poor, while those on the bright AGB-sequence may be significantly younger, and relatively more metal-rich. However, inferring the nature of stellar populations from the AGB is difficult because the predictions of stellar evolution theory are uncertain for these highly evolved stars, and few AGB stars are observed in suitable template clusters.
There are several indications that the old and metal-poor field population in the 9M CMD has a red HB morphology: the AGB-bump is quite red, the field RRab lie close to the red edge of the instability strip, and the number ratio of AGB-bump to RR Lyrae stars is quite large. For an HB morphology of , the ratio associates 50% of the red HB clump stars in the 9M CMD with an old and metal-poor population (the same population responsible for the RR Lyrae).
The red HB clump giants in the 9M CMD are distinctly brighter than the red HB stars in M3 relative to the RR Lyraes, which may suggest the relative youth of the former. If we adopt a canonical brightness difference between RRab and a red HB of mag, as found for globular clusters (Fusi Pecci et al. 1996), then the red HB clump in the 9M CMD is about mag brighter than a typical, ancient red HB. If ancient clusters are 13 Gyrs old, theoretical calibrations of the age-dependent red HB clump luminosity predict that the old and metal-poor field population in the bar is 5 Gyrs old (Alves & Sarajedini 1999, Sarajedini et al. 1995). A systematic uncertainty in this estimate may arise from the possible coupling of age and metallicity effects on the theoretical red HB clump luminosity-age calibration, the nature of which is poorly constrained by observation.
In addition to the brightness of the red HB clump, the inferred HB morphology index of may also indicate the relative youth of the metal-poor field population. For dex, the Lee et al. (1994) models predict that the field population is at least 2 Gyr younger than the oldest LMC clusters (Olsen et al. 1998). It is worth noting the magnitude of the age difference inferred from the Lee et al. (1994) models depends sensitively on a variety of theoretical assumptions (Catelan & de Freitas Pacheco 1993). Nevertheless, the weight of evidence supports a scenario whereby the majority of old and metal-poor field stars in the bar formed after the oldest LMC clusters.
The brightness difference between the red HB clump and AGB-bump in the 9M CMD, mag, does not agree well with observations of old and metal-poor clusters (e.g. Ferraro et al. 1999), or theoretical predictions. If the old and metal-poor field population is as young as 5 Gyr, the disagreement with theory is even worse (Alves & Sarajedini 1999). However, we find that the brightness difference between the AGB-bump and RRab in the 9M CMD is in good agreement with observations of globular clusters and with theory. Therefore, while the brightnesses of the RRab and AGB-bump conform to expectations, the red HB clump appears too bright.
To review, we find that the brightness difference between the AGB-bump and RR Lyraes is consistent with the luminosity predictions of stellar evolution theory for an old and metal-poor population. The observed ratio of AGB-bump stars to RR Lyraes and the lifetime predictions of stellar evolution theory lead us to associate a significant fraction of the observed red HB clump giants with this old and metal-poor population, which in turn, allows us to infer their mean brightness. However, these red HB clump giants appear to be brighter relative to the AGB-bump and RR Lyraes than predicted by stellar evolution theory. We have argued that the old and metal-poor field population is probably younger on average than the truly ancient LMC clusters. However, this only worsens the disagreement with theory.
Have we incorrectly associated a large fraction of the bright red HB clump giants in the 9M CMD with an old and metal-poor population? One possibility is that an RGB-bump of an intermediate-age population may also populate the region of the giant branch near the AGB-bump in the 9M CMD. A young RGB-bump like this may have been observed in NGC 411, and is predicted by theory (Alves & Sarajedini 1999). If we have overestimated the number of AGB-bump stars, we would expect a smaller number of old, faint red HB clump giants in the 9M CMD. (These old, faint red HB clump giants may be overwhelmed by a much larger number of young red HB clump giants.) However, this scenario probably requires far too many 1.5 Gyr old stars populating a very bright RGB-bump (Hardy et al. 1984). In addition, we do not observe a bright AGB-bump, which would be expected if a 1.5 Gyr population dominated the 9M CMD giant branch.
Are the HB models missing a parameter other than age that would produce bright red HB clumps in old and metal-poor populations? In this case, the hypothesized parameter would not appear to affect the luminosities of the AGB-bump or RR Lyraes. A second possibility is that the luminosity of the red HB clump has a very strong dependence on age in metal-poor populations (i.e., a strong coupling of the age and metallicity dependencies of the red HB clump luminosity). This trend is seen in the HB models of Sarajedini et al. (1995), but the effect is probably too small to account for the 0.2 mag found here. In either of these scenarios, the old and metal-poor field population in the LMC bar may still be younger than the oldest clusters, but the currently available HB models would not yield accurate estimates of the age difference. Finally, we note that the inferred brightness of these old and metal-poor red HB clump giants follows directly from the lifetime and luminosity predictions of stellar evolution theory for the AGB-bump. The possibility that these predictions are flawed seems unlikely given the good agreement between the observed and theoretically-predicted values of . New theoretical models and further observational detections of AGB-bumps in clusters might help clarify this situation.
6 The Old LMC Disk
We conclude this work with a brief examination of the spatial density profile of RRab. In Figure 12, we plot the logarithm of the number of RRab per square degree as a function of true LMC radius. We assume the LMC disk is inclined ( degrees), with a line-of-nodes running North-South, and a center near the optical center (Westerlund 1997). MACHO data for 16 fields are shown as filled circles (no corrections for completeness). We plot data for six additional fields from Kinman et al. (1991) as open circles (error bars are ). A fit to all of the data (dotted line) and a fit excluding the Kinman et al. (1991) data (solid line) are also shown. We report a radial scale length of kpc (statistical error only), which is the same as derived from surface brightness data (Bothun & Thompson 1989). For the purposes of this work, we need only illustrate the good fit of the exponential profile. Fits with analytic King (1962) models (not shown) are worse than the exponentials. The King models tend toward vanishingly small core radii, and are poor representations of the Kinman et al. (1991) data points. Future work might include a more thorough exploration of the model parameter space (i.e., accounting for uncertainties in the LMC center, inclination, and line-of-nodes), and corrections for RR Lyrae completeness as estimated from artificial star tests (Alcock et al. 2000). In any case, the data shown here strongly suggest that the majority of the old and metal-poor LMC field stars lie in a disk, and not in a spheroid.
A lower limit for the age of the LMC disk is set by the age of the youngest RR Lyrae, which may be 9 Gyr following the discussion of Olszweski et al. (1996). An upper limit is set by the old and metal-poor LMC field population forming after the oldest LMC clusters (as we have argued here), and the absolute ages of those clusters. We suggest a plausible range of Gyr for the formation epoch of the LMC disk. The Milky Way disk is estimated to be 9 Gyr old (Leggett et al. 1998, Salaris & Weiss 1998) from white dwarf cooling times and the ages of disk clusters. Therefore, we conclude that the LMC disk is quite old, and may have formed contemporaneously with the Milky Way disk.
7 Conclusion
We have presented a 9 million star color-magnitude diagram of the LMC bar. By assembling a variety of theoretical results, carefully selected samples of MACHO-discovered variable stars, and extant observational data for clusters (Galactic, LMC, & SMC), we have investigated the stellar populations of the LMC bar. After an examination of the young LMC stellar populations, we turned our attention to the less well-understood old stellar populations. Regarding the old and metal-poor LMC field population, we found a typical metallicity of , and argued that this population likely formed a few Gyr after the oldest LMC clusters. We showed that this population lies in a disk. Our results are consistent with isochrone-dependent parametric studies of stellar populations in the LMC disk (Geha et al. 1998), which do not rule out a substantial 10 Gyr old and metal-poor population. We are also consistent with recent suggestions that the LMC bar harbors a relatively larger component of old stars than the outer regions of the LMC disk (Holtzman et al. 1999).
As emphasized by others (Butcher 1977, Hardy et al. 1984), the LMC disk appears to have a different star formation history than the solar neighborhood Milky Way disk. The key difference hinges on a major “event” of star formation which apparently took place a few Gyr ago in the LMC. The details of this event and the prior evolutionary history of the LMC are the subject of some debate (Bertelli et al. 1992, Olszweski et al. 1996, Elson et al. 1997, Geha et al. 1998, Holtzman et al. 1999). We have suggested that the bimodal AGB in the 9M CMD arises from discrete old populations, which is consistent with the occurence of a major star formation event in the LMC. These discrete populations may be due to either a distinguishing “dip” in the star formation rate prior to the event, or a “burst” coincident with the event. In addition, we showed that the red HB clump, giant branch, and AGB in the 9M CMD are consistent with the so-called burst population having a metallicity and age similar to the clusters NGC 411 and NGC 1783, which is somewhat younger and more metal-poor than others have suggested.
Although our results are consistent with the occurence of a star formation event a few Gyrs ago in the LMC, we do not constrain the intensity of the event. Consider the following simple calculation. If 50% of the red HB clump giants are old and metal-poor, we assume that the remaining 50% are born in the event/burst. Adopting equal red HB clump lifetimes (Vassiliadis & Wood 1993), a Salpeter (1955) initial mass function, and representative initial masses of 0.8 and 1.6 for the old and intermediate-age populations, respectively, the roughly equal numbers of red HB clump giants from the two populations imply relative star formation rates of . If the number of old and metal-poor clump giants is uncertain by a factor of 2, and the total number of red HB clump giants is fixed, the ratio of star formation rates may range from 1 to 10.
Finally, we have shown that the old and metal-poor field population in the LMC bar lies in a disk. This contradicts suggestions that the LMC disk formed only a few Gyr ago, during the star formation event (Hardy et al. 1984, Elson et al. 1997). Instead, we find that the LMC disk is at probably as old as the Milky Way disk, Gyr. The Milky Way and the LMC have absolute visual magnitudes of and mag, and masses of and , respectively (Bahcall & Soneira 1980, de Vaucouleurs 1954, Bothun & Thompson 1988, Kim et al. 1998). Thus, we conclude that very different mass galactic disks may form at similar and quite early cosmological epochs, a new clue which may help constrain the physical processes governing their formation. It is interesting to note that the kinematics of the ancient LMC clusters do not reveal a halo, but rather a disk (Freeman, Illingworth & Oemler 1983). The existence of a bonafide spheroidal or halo stellar population in the LMC is not ruled out by our analyses. The metal-poor RR Lyraes in the tail of the metallicity distribution are likely good candidates for this LMC population. Identifying this population will be important for probing the pre-disk/collapse era of galaxy evolution in the LMC (Eggen, Lynden-Bell & Sandage 1962).
8 Acknowledgements
This paper is excerpted from the Ph.D. dissertation by David Alves for the Department of Physics, University of California, Davis. David Alves thanks his graduate advisors, Dr. Kem Cook and Prof. Robert Becker. The MACHO collaboration thanks the skilled support by the technical staff at MSSSO. Work at LLNL supported by DOE contract W7405-ENG-48. Work at CfPA supported by NSF AST-8809616 and AST-9120005. Work at MSSSO supported by the Australian Dept. of Industry, Technology and Regional Development. WJS thanks PPARC Advanced Fellowship, KG thanks DOE OJI, Sloan, and Cottrell awards, CWS thanks Sloan and Seaver Foundations.
References
- (1)
- (2) Aaronson, M. & Mould, J. 1985, ApJ, 288, 551
- (3) Alcock, C. et al. 1996, AJ, 111, 1146
- (4) Alcock, C. et al. 1997, ApJ, 486, 697
- (5) Alcock, C. et al. 1997b, ApJ,490, L59
- (6) Alcock, C. et al. 1997c, ApJ, 482, 89
- (7) Alcock, C. et al. 1998, AJ, 115, 1921
- (8) Alcock, C. et al. 1999, PASP, 111, 1539
- (9) Alcock, C. et al. 1999b, AJ, 117, 920
- (10) Alvarado, F. et al. 1995, AJ, 110, 646
- (11) Alves, D. et al. 1998 proc. of IAU JD 24, “Pulsating Stars: Recent Developments in Theory and Observation”, eds. D. Sasselov & M. Takeuti (Tokyo: Universal Academy Press)
- (12) Alves, D. & Sarajedini, A. 1999, ApJ, 511, 225
- (13) Bahcall, J. & Soneira, R. 1980, ApJS, 44, 73
- (14) Becker, S.A. 1981, ApJ, 248, 298
- (15) Becker, S.A., Iben, I., & Tuggle, R.S. 1977, ApJ, 218, 633
- (16) Bertelli, G., Bressan, A & Chiosi, C. 1985, A&A, 150, 33
- (17) Bertelli et al. 1992, ApJ, 388, 400
- (18) Bertelli, G., Bressan, A., Chiosi, C., Fagotto, F., & Nasi, E. 1994, A&AS, 106, 275
- (19) Bessell, M., Wood, P. & Lloyd Evans, T. 1983, MNRAS, 202, 59
- (20) Bessell, M. 1990, PASP, 102, 1181
- (21) Bica, E., Geisler, D., Dottori, H., Claria, J., Piatti, A., & Santos, J. 1998, AJ, 116, 723
- (22) Blanco, B., McCarthy, M. & Blanco, B. 1980 ApJ 242, 938
- (23) Bono, G., Caputo, F., & Santolamazza, P. 1997, A&A, 317, 171
- (24) Bothun, G.D., & Thompson, I.B. 1988, AJ, 96, 877
- (25) Butcher, H. 1977, ApJ, 216, 372
- (26) Carretta, E. & Gratton, R.G. 1997, A&AS, 121, 95
- (27) Carretta, E. et al. 1998, MNRAS, 298, 1005
- (28) Castellani, V., Chieffi, A. & Pulone, L. 1991, ApJS, 76, 911
- (29) Catelan, M. & de Freitas Pacheco, J. 1993, AJ, 106, 1858
- (30) Catelan, M. & de Freitas Pacheco, J. 1995, A&A, 297, 345
- (31) Cohen, J. 1982, ApJ, 258, 148
- (32) Corsi et al. 1994, MNRAS, 271, 385
- (33) Costa, E. & Frogel, J. 1996, AJ, 112, 2607
- (34) Da Costa, G. S., & Mould, J. R. 1986, ApJ, 305, 214
- (35) Da Costa. G. 1998, proc. of IAU Syposium 190 “New Views of the Magellanic Clouds”, eds. eds. Y-H. Chu, N. B. Suntzeff, J. Hesser, D. Bohlender (San Francisco: ASP)
- (36) Dalcanton, J. Spergel, S. & Summers, F. 1997, ApJ, 482, 659
- (37) de Vaucouleurs, G. 1955, AJ, 60, 126
- (38) Dopita, M. et al. 1997, ApJ, 474, 188
- (39) Eggen, O., Lynden-Bell, D. & Sandage, A. 1962, ApJ, 136, 748
- (40) Elson, R., Gilmore, G. & Santiago, B. 1997, MNRAS, 289, 157
- (41) Fagatto, F., Bressan, A., Bertelli, G. & Chiosi, C. 1994 A&AS, 105, 29
- (42) Fall, S. & Efstathiou, G. 1980, MNRAS, 193, 189
- (43) Ferraro F. et al. 1997, A&A, 320, 757
- (44) Ferraro F. et al. 1999, AJ, 118, 1783
- (45) Freeman, K.C. 1970, ApJ, 160, 811
- (46) Frogel, J. et al. 1990, ApJ, 352, 96
- (47) Fusi Pecci, F., et al. 1996, AJ, 112, 1461
- (48) Gallart, C. 1998 ApJ, 495, L43
- (49) Geha et al. 1998, AJ, 115, 1045
- (50) Girardi, L., Groenewegen, M.A.J., Weiss, A. & Salaris, M. 1998 MNRAS, 301, 149
- (51) Graham, J. & Ruiz, M. 1974, AJ, 79, 3
- (52) Guarnieri, M., Bragaglia, A. & Fusi Pecci, F. 1993, A&AS, 102, 397
- (53) Hardy, E. et al. 1984, ApJ, 278, 592
- (54) Hatzidimitriou, D. 1991, MNRAS, 251, 545
- (55) Hoeppner, W. et al. 1978, 63, 391
- (56) Holtzman, J. et al. 1999 astroph/990759
- (57) Jurcsik, J. & Kovacs, G. 1996, A&A, 312, 111
- (58) Kaluzny, J., Hildich, R. Clement, C., Rucinski, S. 1998, MNRAS, 296, 347
- (59) Kim, S. et al. 1998, ApJ, 503, 729
- (60) Kippenhahn, R. & Weigert, A. 1990 “Stellar Structure and Evolution” (Berlin: Springer)
- (61) King, I. 1962, AJ, 67, 471
- (62) Kinman, T.D., Stryker, L.L., & Hesser, J.E. 1976 PASP, 88, 393
- (63) Kormendy, J. 1979, ApJ, 227, 714
- (64) Langer, N. & Maeder, A. 1995 A&A, 295, 685
- (65) Lattanzio, J. et al. 1991, A&A, 250, 340
- (66) Lauterborn, D., Refsdale, S. & Roth, M. 1971, A&A 13, 119
- (67) Lee, Y-W., Demarque, P. & Zinn, R. 1994, ApJ, 423, 248
- (68) Leggett, S., Ruiz, M. & Bergeron, P. 1998, ApJ, 497, 294
- (69) Lloyd Evans, T. 1980, MNRAS, 193, 87
- (70) Luck, R. et al. 1998, AJ, 115, 605
- (71) Maeder, A. & Meynet, G. 1989, A&A, 210, 155
- (72) Marigo, P. Girardi, L. & Chiosi, C. 1996, A&A, 316, L1
- (73) Minniti, D., et al. (MACHO Collaboration) 1997, IAP Colloquium “Variable Stars and the Astrophysical Returns of Microlensing Surveys”, ed. R.Ferlet
- (74) Mould, J. et al. 1989, ApJ, 339, 84
- (75) Ng, Y.K. et al. 1997, A&A 324, 65
- (76) Ojha, D.K. et al. 1994, A&A, 284, 810
- (77) Olsen, K., et al. 1998, MNRAS, 300, 665
- (78) Olsen, K. 1999, AJ, 117, 2244
- (79) Olszewski, E. et al. 1991, AJ, 101, 515
- (80) Olszewski, E., Suntzeff, N., & Mateo, M. 1996 ARA&A, 34, 511
- (81) Pike, C.D. & Meston, C.J. 1977, MNRAS, 180, 613
- (82) Reid, N. & Gilmore, G. 1982, MNRAS, 201, 73
- (83) Reid, N. 1996, MNRAS, 278, 367
- (84) Reimann, J. 1994 Ph.D. dissertation, U.C. Berkeley
- (85) Renzini, A. & Fusi Pecci, F. 1988 ARA&A, 26, 199
- (86) Renzini, A. et al. 1992, ApJ, 400, 280
- (87) Salaris, M. & Weiss, A. 1998, A&A, 335, 943
- (88) Salpeter, E.E. 1955, ApJ, 121, 161
- (89) Sandage, A. & Wildey, R. 1967, ApJ, 150, 469
- (90) Sandage, A. & Smith L.L. 1966, ApJ, 144, 886
- (91) Sandquist, E., Bolte, M., Stetson, P., & Hesser, J. 1996 ApJ, 470, 910
- (92) Sarajedini, A. 1994, AJ, 107, 618
- (93) Sarajedini, A., Lee, Y., & Lee, D. 1995 ApJ, 450, 712
- (94) Saviane, I., Held, E.V., & Bertelli, G. astroph/9912427
- (95) Schaerer,D., Meynet,G., Maeder,A. & Schaller, G. 1993 A&AS, 98, 523
- (96) Schroder, K., Pols, O. & Eggelton, P. 1997, MNRAS, 285, 696
- (97) Seidel, E., Demarque, P., & Weinberg, D. 1987 ApJS, 63, 917
- (98) Silbermann, N. & Smith, H. 1995 AJ, 110, 704
- (99) Smecker-Hane, T., Stetson, P.B., Hesser, J.E., & Lenhert, M.D. 1994 AJ, 108, 507
- (100) Stetson, P., Vandenberg, D. & Bolte, M. 1996, PASP, 108, 560
- (101) Storm, J. Carney, B. & Beck, J. 1991, PASP, 103, 1264
- (102) Stothers, R. & Chin, C-W. 1991, ApJ, 374, 288
- (103) Sweigart, A., Greggio, L., & Renzini, A. 1990 ApJ, 364, 527
- (104) Tifft, W.G. & Snell, C.M. 1971, MNRAS, 151, 365
- (105) Udalski, A. 1998, Acta Astronomica, 48, 383
- (106) Vassiliadis, E. & Wood, P. 1993 ApJ, 413, 641
- (107) van den Bergh, S. 1998, proc. of IAU Syposium 190 “New Views of the Magellanic Clouds”, eds. eds. Y-H. Chu, N. B. Suntzeff, J. Hesser, D. Bohlender (San Francisco: ASP)
- (108) Walker, A. 1992 ApJ, 390, 81
- (109) Walker, A. 1993, AJ, 105, 527
- (110) Welch, D.L. & Stetson, P.B.. 1993, AJ, 105, 1813
- (111) Westerlund, B.E. 1997, “The Magellanic Clouds” (Cambridge: Cambridge University Press)
- (112) Wood, P. et al. 1998 proc. of IAU Symposium 191 “Asymptotic Giant Branch Stars”, eds. (San Francisco: ASP)
- (113) Yoshii, Y., Ishida, K. & Stobie, R. 1987, AJ, 92, 323
- (114) Yoshii, Y. & Rodgers. A. 1989, AJ, 98, 853
- (115) Zaritsky, D., & Lin, D. 1997 AJ, 114, 254
- (116) Zinn, R. & West, M. 1984, ApJS, 55, 45
- (117)
2cm Blue SupergiantsaaMedian color for stars with mag. Estimated uncertainty is 0.01 mag. See text for data selection. Red SupergiantsaaMedian color for stars with mag. Estimated uncertainty is 0.01 mag. See text for data selection. 14.75 0.09 14.75 0.76 15.25 0.18 15.25 0.71 15.75 0.30 15.75 0.66 16.25 0.39 16.25 0.64 Field RRabbbEstimated uncertainty & is 0.01 mag. Red HB ClumpbbEstimated uncertainty & is 0.01 mag. 19.45 0.31 19.17 0.51 Giant BranchccTwenty two field average (of median color per field) for stars with mag. Standard deviation mag for each mark gives width of giant branch. See text for data selection. AGB-BumpbbEstimated uncertainty & is 0.01 mag. 16.75 0.825 18.38 0.57 17.25 0.713 17.75 0.639 Tip-RGB 18.25 0.576 16.26 0.80 19.75 0.505 16.76 0.95
5cm MACHO Id. RA Dec. Period 78.5857.2941 05:16:46.7 :39:07 0.475227 19.336 0.287 1.16 78.5857.2419 05:16:46.6 :39:24 0.492045 19.274 0.300 1.25 78.5857.2749 05:16:29.0 :39:27 0.532596 19.718 0.334 1.21 78.5857.2984 05:16:38.5 :40:11 0.554789 19.215 0.243 1.00 78.5857.2200 05:16:33.2 :38:23 0.647280 19.212 0.414 0.55 Mean 0.540 19.351 0.315 1.04 S.D.o.M. 0.029 0.095 0.029 0.13
5cm MACHO Id. RA Dec. Period Id.bbIdentifcations from Walker (1993) and Graham & Ruiz (1974). 1.4046.765 05:05:14.7 :24:12 0.517913 19.479 0.214 1.32 21 1.3925.1806 05:04:46.2 :22:27 0.525116 19.149 0.157 0.96 1.4046.809 05:05:13.1 :23:57 0.541014 19.381 0.308 1.06 18 1.4046.783 05:05:06.1 :25:01 0.546220 19.197 0.180 1.12 14 1.4046.937 05:05:02.2 :24:39 0.555905 19.626 0.242 1.18 13 1.4046.858 05:05:12.8 :24:40 0.603043 19.496 0.238 1.17 20 1.3925.1752 05:04:58.6 :23:34 0.635710 19.417 0.306 1.02 6 1.4046.715 05:05:02.1 :24:36 0.664359 19.397 0.174 0.81 Mean 0.581 19.428 0.237 1.10 S.D.o.M. 0.020 0.049 0.020 0.06
5cm MACHO Id. Id. Sp.T. NGC 1783 55.3008.13 LE-1 410 15.77 17.55 10.26 1.93 13.47 C 55.3008.12 LE-2 46.3 15.06 16.22 11.27 1.13 14.19 S4/2 55.3129.16 LE-3 307 15.07 16.41 10.37 1.60 13.41 C 55.3129.12 LE-4 128 15.06 16.22 11.10 1.09 13.98 S5/2 55.3129.14 LE-5 120 15.03 16.09 11.23 1.09 14.11 M3 55.3008.14 LE-6 62.4 15.07 16.11 11.34 1.08 14.20 M3 55.3129.13 LE-9 270 15.25 16.56 10.93 1.11 13.83 S5/3 55.3129.15 LE-15 63 14.94 15.88 11.78 1.00 14.49 M1 NGC 1898 78.5857.27 AM-6 51.5 15.30 16.06 12.38 0.94 15.03 M? 78.5857.25 AM-4 46.1 15.32 16.20 11.71: 1.08 14.62: M? 78.5857.38 AM-1 35.8 15.50 16.24 12.58 0.98 15.32 M?