Stellar Dynamics and the implications on the merger evolution in NGC 6240 (catalog )
Abstract
We report near-infrared integral field spectroscopy of the luminous merging galaxy NGC 6240 (catalog ). Stellar velocities show that the two K-band peaks separated by are the central parts of inclined, rotating disk galaxies with equal mass bulges. The dynamical masses of the nuclei are much larger than the stellar mass derived from the K-band light, implying that the progenitor galaxies were galaxies with massive bulges. The K-band light is dominated by red supergiants formed in the two nuclei in starbursts, triggered years ago, possibly by the most recent perigalactic approach. Strong feedback effects of a superwind and supernovae are responsible for a short duration burst ( years) which is already decaying. The two galaxies form a prograde-retrograde rotating system and from the stellar velocity field it seems that one of the two interacting galaxies is subject to a prograde encounter. Between the stellar nuclei is a prominent peak of molecular gas (, CO). The stellar velocity dispersion peaks there indicating that the gas has formed a local, self-gravitating concentration decoupled from the stellar gravitational potential. NGC 6240 (catalog ) has previously been reported to fit the paradigm of an elliptical galaxy formed through the merger of two galaxies. This was based on the near-infrared light distribution which follows a -law. Our data cast strong doubt on this conclusion: the system is by far not relaxed, rotation plays an important role, as does self-gravitating gas, and the near-infrared light is dominated by young stars.
1 Introduction
The luminous infrared galaxy (LIRG) NGC 6240 (catalog ) (Wright et al., 1984; Thronson et al., 1990) has a remarkable disturbed morphology which is characterised in the visible by loops, branches and arms extending out to (Fosbury & Wall, 1979). From this large-scale morphology, and the discovery of two nuclei in the central region Fried & Schulz (1983) concluded that NGC 6240 (catalog ) is an interacting and merging system of two galaxies. This conclusion is supported by spectroscopic observations in the visible (Fosbury & Wall, 1979; Fried & Ulrich, 1985) and near-infrared wavelength range (Herbst et al., 1990; Van der Werf et al., 1993; Sugai et al., 1997). NGC 6240 (catalog ) is the most luminous source of near-infrared line emission (, Wright et al. (1984)). The emission is most likely excited in shocks triggered by the collision of the two galaxies.
NGC 6240 (catalog ) has a bolometric luminosity (for , ). This bolometric luminosity classifies NGC 6240 (catalog ) almost as an ultra luminous infrared galaxy (ULIRG; ). LIRGs and ULIRGs emit more than 90% of their bolometric luminosity in the infrared wavelength range. There is consensus that the infrared emission comes from warm dust but what is the primary energy source responsible for heating the dust is still a matter of debate. The two possibilities are a deeply dust embedded active galactic nucleus (AGN) or a super starburst. Observations with the Infrared Space Observatory (ISO) (Genzel et al., 1998) show that the majority of ULIRGs, including NGC 6240 (catalog ), are starburst dominated. On the other hand, detection of a highly absorbed hard X-ray source indicates that NGC 6240 (catalog ) also contains a powerful AGN (Vignati et al., 1999). Most ULIRGs are interacting or merging systems with the star formation and/or AGN activity triggered by gas compression and inflows towards the center (Sanders et al., 1988). As such NGC 6240 (catalog ) is a nearby test case of a luminous merger. It can be used to test predictions of interacting and merging galaxies (Barnes & Hernquist, 1996; Mihos & Hernquist, 1996). The effect of the interaction on the star formation can be compared with model results to assess the true nature of ULIRGs. To investigate the stellar content and the properties of the starburst of NGC 6240 (catalog ), to determine the stellar dynamics and to test predictions of interacting galaxy models we have carried out high resolution near-infrared spectroscopy with the Max-Planck-Institut für extraterrestrische Physik (MPE) integral field spectrometer 3D.
2 Observations and Data Reduction
NGC 6240 (catalog ) was observed with the MPE near-infrared imaging spectrograph 3D (Weitzel et al., 1996) in conjunction with the tip-tilt correction adaptive optics system ROGUE (Thatte et al., 1995) in two observing runs. 3D is an integral field spectrograph that simultaneously obtains spectra for each of 256 spatial pixels covering a square field of view with over 95% fill factor. In both observing runs the spectral resolving power () was 2000 and Nyquist sampled using two settings of a piezo-driven flat mirror.
The first observing run took place in April 1996 at the ESO telescope on La Silla, Chile. The pixel scale was per pixel, and a wavelength range from to was covered. The total on-source integration time was with individual frame integration times of or . The same amount of time was spent off-source E and W of the nuclear region of NGC 6240 (catalog ) for sky background subtraction. The seeing during the observations was better than .
The second observing run took place in March 1998 at the Anglo Australian Telescope in Coonabarabaran, Australia. Here the pixel scale was per pixel and a wavelength range from to was covered. This wavelength setting includes the emission line at a redshifted wavelength of . The total on-source integration time was with individual integrations of each. Again, the same amount of time was spent off-source E of the nuclear region of NGC 6240 (catalog ) to subtract the sky background. The seeing throughout the observations was better than .
To correct for the atmospheric transmission a reference star was observed before and after the science integrations. The data were reduced using the set of 3D data analysis routines written for the GIPSY (Van der Hulst et al., 1992) data reduction package. This included wavelength calibration, spectral and spatial flat fielding, dead and hot pixel correction, and division by the reference stellar spectrum. Data cubes from the individual exposures were recentered and added using the centroid of the broadband emission from the southern nucleus. Absolute flux calibration was established by comparison of the broadband emission with K-band photometry by Thronson et al. (1990). Emission line and absorption line maps as well as the continuum map were extracted by performing a linear fit through line-free regions in the vicinity of the lines in the spectrum of each spatial pixel.
3 Results
3.1 Line Maps and Spectra
The spectrum of NGC 6240 (catalog ) in the range from to contains a number of molecular and atomic emission lines, as well as stellar absorption features.
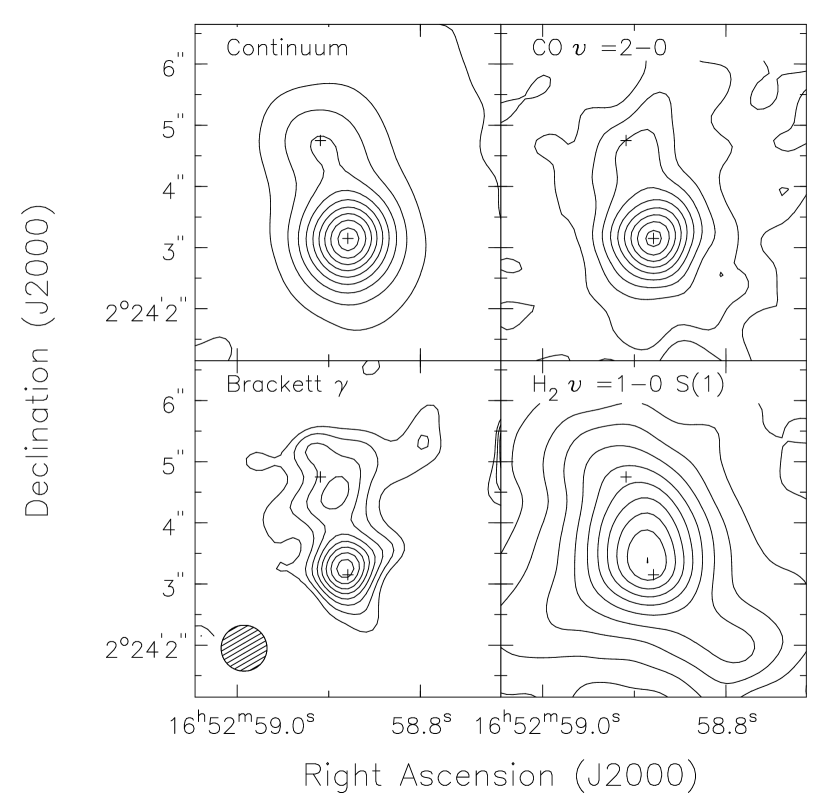
Figure 1 shows the line-free continuum map in the wavelength range from to , a Brackett map and a map of the absorption bandhead. All three maps are dominated by two compact sources (hereafter referred to as nuclei) separated by . The double nuclear structure has been observed previously in the visible (B, V, R) (Keel, 1990) and NIR (J, H, K) bands (Thronson et al., 1990) but the maps are also similar to what is observed at other wavelengths (Condon et al., 1982; Colbert et al., 1994; Keto et al., 1997). In addition to the double nucleus the Brackett map shows emission extended out to northwest of the northern nucleus in the direction of the third radio emission peak N3 observed by Colbert et al. (1994).
Also shown in Figure 1 is the integrated emission. In contrast to the K-band continuum the emission shows a single emission peak between the nuclei with filaments extending from it. The emission peak is at a separation of from the southern nucleus towards the northern nucleus and is extended in the northern direction. This morphology has been previously observed with Fabry-Perot imaging techniques by Herbst et al. (1990), Van der Werf et al. (1993) and Sugai et al. (1997). The morphology is very similar to the morphology, indicating that also the near-infrared emission lines trace the bulk of the molecular material in NGC 6240 (catalog ).
The line maps in Figure 1 show three major regions of interest. These are the two nuclei, and the region of the emission peak between them. Figure 2 shows the spectra of these regions, each within an diameter circular aperture. Even though the peak of the emission lies between the nuclei, dominates the line emission in all three regions. In fact, NGC 6240 (catalog ) has the highest ratio of luminosity to bolometric luminosity of any galaxy which has thus far been observed (Wright et al., 1984). The lines are very broad and have a full width half maximum (FWHM) of with line wings extending over full width zero power (FWZP). The emission line profiles are asymmetric with red and/or blue wings whose strength varies over the emission region. Figure 3 shows a comparison of the line-of-sight velocity profiles of the and lines for the nuclear region of NGC 6240 (catalog ).
A characteristic of NGC 6240 (catalog ) is its low Brackett equivalent width (e.g. Lester, Harvey & Carr, 1988; Van der Werf et al., 1993). In earlier work (see references in Van der Werf et al., 1993) the line was not or only marginally detected. In the improved sensitivity 3D data the line is now clearly detected. The Brackett equivalent width of the northern and southern nucleus is and , respectively. A line map and spectra in different positions can be extracted from the data cube. The FWHM of the Brackett line is and for the northern and southern nucleus, respectively, measured over a diameter circular aperture. The northern nucleus is redshifted with respect to the southern nucleus by , a value similar to the velocity difference of measured by Fried & Ulrich (1985) with optical emission and absorption lines.
The 3D spectra also show that NGC 6240 (catalog ) has deep CO absorption bandheads with a large velocity dispersion. From similar data Lester & Gaffney (1994) and Doyon et al. (1994) deduce a velocity dispersion of and , respectively, for the region of NGC 6240 (catalog ) containing both nuclei. Using 3D, we are able to resolve spatially the velocity dispersions of each nucleus. A detailed analysis of this is presented in §5. The equivalent width of the bandhead is determined using the wavelength intervals given in Origlia, Moorwood & Oliva (1993) and corrected for the velocity broadening using the formula in Oliva et al. (1995). The velocity dispersions are the ones derived in §5 and the resulting equivalent widths are and for the northern and southern nucleus, respectively.
3.2 Extinction
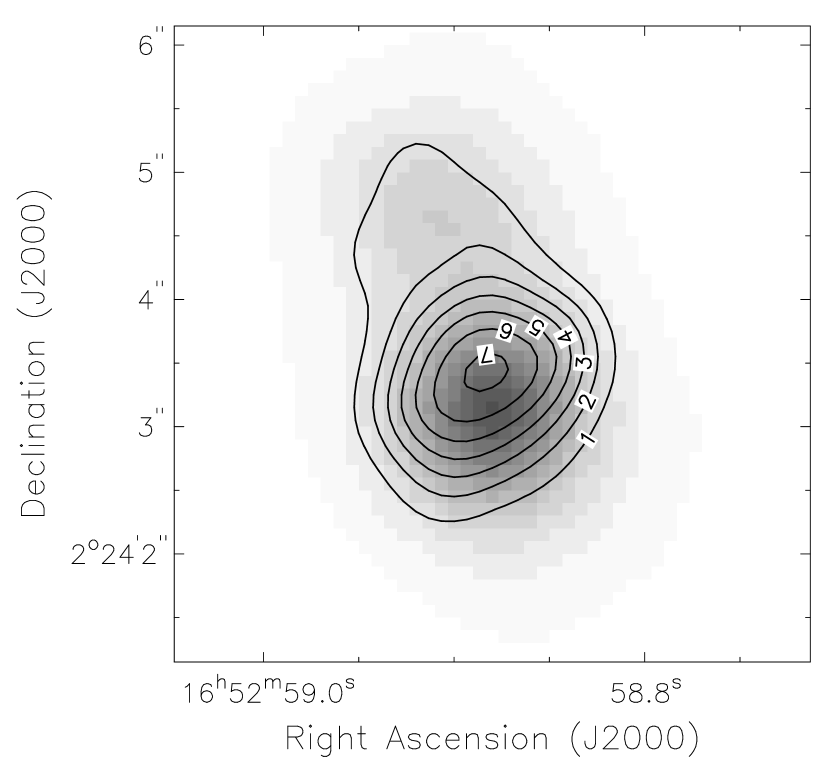
From the spectra in Figure 2 it is apparent that the spectrum of the emission peak has a shallower, i.e. redder, slope than the two nuclei. Assuming an intrinsically constant continuum slope over the entire nuclear region of NGC 6240 (catalog ), this reddening can either be due to extinction or a nonstellar contribution to the spectrum at long wavelengths. The spectral energy distribution (SED) of NGC 6240 (catalog ) (Draine & Woods, 1990) shows no nonstellar continuum below . Above thermal emission from dust with a temperature of is dominant. Different spectral slopes over the nuclear region of NGC 6240 (catalog ) thus are almost certainly due to extinction variations.
To derive the extinction values the spectral slope of all pixels in the data cube are compared with the spectral slope of a K4.5 supergiant, which was observed with 3D during the La Silla 1996 observing run. A direct comparison of stellar spectra with the spectrum of NGC 6240 (catalog ) yields a K4.5 supergiant as the best fitting template (see §4.1). With the interstellar extinction law from Draine (1989)
and an uniform foreground screen model (UFS) we derive the extinction map shown in Figure 4. The extinction towards the southern and northern nucleus is and , respectively. The peak extinction is . For a mixed model, where absorbing dust and stellar emission are completely mixed, the peak value is . The morphology of the extinction map with a single peak between the continuum nuclei indicates a dust concentration between the nuclei and is coincident with the and emission peaks.
4 The Infrared Nuclei
4.1 The Nature of the K-band Continuum
To determine the stellar type dominating the near-infrared light in starburst galaxies the absorption bandhead is an often used spectral absorption feature. For late-type giants and supergiants this absorption feature is rather deep, and even with data of medium spectral resolution the equivalent width can be used to determine the stellar type. There is an ambiguity in the equivalent width between KI and MIII stars, however. From the absorption bandhead equivalent width the spectrum of NGC 6240 (catalog ) can be explained either by a population of red giants or red supergiants. However, because of the high spectral resolution of our data, we can resolve the discrepancy by a direct comparison of the spectrum of NGC 6240 (catalog ) with both stellar types. Figure 5 compares the spectrum of the CO absorption bandheads of the southern nucleus of NGC 6240 (catalog ) with four stellar spectra of giants and supergiants also observed with 3D at the same spectral resolution (Schreiber, 1999). For the comparison the spectrum of NGC 6240 (catalog ) was shifted into the restframe of zero redshift, and the stellar spectra were broadened with a Gaussian velocity profile of FWHM. Clearly the K and M giant spectra do not fit the deep absorption features and the continuum slope. On the other hand the absorption bandheads of a M3+ supergiant are too deep to represent the NGC 6240 (catalog ) spectrum. The best matching stellar spectrum is that of a K4.5 supergiant. However, its CO absorption bandheads are still somewhat too shallow and we conclude that the near-infrared light is due to late K (K5) or early M (M0/M1) supergiants. Our conclusions are consistent with those of Sugai et al. (1997) whose data have lower spectral resolution but cover a wider spectral range. The fact that the K-band light of the nuclei is dominated by red supergiants indicates a starburst as the source of the K-band luminosity. The presence of supergiants implys that the starburst was triggered quite recently.
4.2 Starburst Simulations
To further constrain the age and other characteristics of the starburst we used the program STARS (Schreiber, 1999) to simulate several starburst scenarios. In Figure 6 we show model predictions for the variations of Brackett equivalent width, the K-band luminosity to stellar mass ratio () and the starburst bolometric luminosity to K-band luminosity ratio () for four burst durations: , and million years as well as continuous star formation. We adopted a Salpeter (1955) initial mass function (IMF) for masses between and . The calculated luminosity output of the starburst is insensitive to the shape of the IMF at the low mass end (). The low mass stars do contribute to the total mass of the stars formed in the starburst, however. To take this into account, we integrated a Miller-Scalo IMF (Miller & Scalo, 1979) from down to , the lower mass limit for hydrogen burning. Because stars with masses do not evolve into red supergiants, the K-band luminosity does not depend on the choice of the upper mass cutoff, and due to their small number, their contribution to the total mass is negligible.
4.3 Starburst Age and Duration
The absorption bandhead equivalent width (or better the presence of late type supergiants) allows us to determine the age of the starbursts in NGC 6240 (catalog ). The late K or early M supergiants that dominate the K-band light of the nuclei have masses from to and a typical age of to million years. Since red supergiants dominate the K-band luminosity only during this period, the starburst must be of similar age. This age is shown in Figure 6 as a vertical hatched bar.
The Brackett emission line equivalent width allows us to constrain the duration of the starburst activity. The agreement of the Brackett and K-band continuum morphologies indicates that both the line and continuum emission originates in the same star forming regions. The emission can be explained by excitation in slow C-shocks (Van der Werf et al., 1993; Sugai et al., 1997; Egami, 1998). Since the morphology of the emission differs from that of the Brackett emission, shocks most likely do not contribute to the Brackett emission. In a starburst, only stars with masses ionise their surrounding medium to produce Brackett emission, but due to their high mass their lifetime is very short ( million years). The low Brackett equivalent width in NGC 6240 (catalog ) indicates a low number of hot, young stars, either because the starburst is aging or because stars with masses were never formed. We prefer the former explanation, because of the signatures for to stars in nearby starburst templates (see Thornley et al., 1999).
The middle panel of Figure 6 shows that the starburst duration is million years. The short starburst duration can be explained by strong negative feedback effects from the starburst itself. The onset of vigorous star formation produces young, massive stars and, thus, supernovae in a very short time ( million years). The winds of these stars deplete the molecular gas and the star formation subsides. The existence of a superwind in NGC 6240 (catalog ) was shown by Heckman et al. (1990) from line mapping and spectroscopy.
The duration of the starbursts is much smaller than the age of the starburst but comparable to the dynamical time scale of million years of the two rotating nuclei (see §5.1). The time scale for the interaction and merging of the two galaxies is several hundred million years and hence much larger than the starburst duration and starburst age. Such short but violent star formation events are predicted by models of interacting and merging galaxies, where they are triggered by the close encounters of the interacting partners (Mihos & Hernquist, 1996).
4.4 Stellar Mass in the Starburst
The light-to-mass ratio () of the starburst can be calculated from simulations of the K-band luminosity and the total mass of stars formed in the starburst. The middle panel of Figure 6 shows as a function of starburst age. It peaks at the time when the red supergiants dominate the K-band luminosity. For the starburst age in NGC 6240 (catalog ) the simulation yields . From the dereddened K-band luminosities in Table 1 within a stellar mass and is derived for the northern and southern nucleus, respectively. Here the lower mass cutoff was assumed to be . If the lower mass cutoff was , or the estimated stellar mass would be smaller by , or , respectively. This is the mass of young stars formed in the starburst contained within the central of the two nuclei. It shows that the two nuclei are massive objects and possibly could be the nuclei of two galaxies involved in a collision, based on the mass of young stars alone.
4.5 The Luminosity of the Nuclei
The bottom panel in Figure 6 shows the starburst bolometric luminosity to K-band luminosity ratio () as a function of starburst age. For a starburst age of to million years this ratio is . From the dereddened K-band luminosity within diameter of each nucleus (see Table 1) this ratio yields and for the northern and southern nucleus, respectively, totaling to . This is ⅓ to ½ of the entire bolometric luminosity of NGC 6240 (catalog ) in the IRAS beam. Within a diameter aperture the total K-band luminosity is of the total bolometric luminosity. In the bottom panel of Figure 6 this ratio is shown as a horizontal, hatched bar. Within the errors of the simulations the entire bolometric luminosity of NGC 6240 (catalog ) can be explained by the starburst.
The claim that the starbursts in the nuclei contribute significantly to the bolometric luminosity of NGC 6240 (catalog ) is further strengthened by radio observations. The radio flux and the far infrared (FIR) luminosity of NGC 6240 (catalog ) follow the radio-to-FIR correlation for starburst galaxies. Lisenfeld, Voelk & Xu (1996) determined empirically the parameter
relating the radio-power to the FIR-luminosity. For starburst galaxies . Taking the radio-power at for the nuclear region including both nuclei, and comparing it with the FIR-luminosity yields for NGC 6240 (catalog ) , within the uncertainties of the radio-to-FIR correlation. If we include the radio-emission from the western region (region W in Colbert et al., 1994), which has no counterpart in the visible or infrared, we get , also within the uncertainties of the q-parameter for starburst galaxies.
X-ray observations and the detection of [O IV] emission indicate the presence of a powerful AGN in NGC 6240 (catalog ) as well (Schulz et al., 1998; Komossa, Schulz & Greiner, 1998; Iwasawa & Comastri, 1998; Genzel et al., 1998; Vignati et al., 1999). In fact, Vignati et al. (1999) conclude from their BeppoSAX data that the highly absorbed () AGN can account for most of the bolometric luminosity of NGC 6240 (catalog ). These two conclusions seem to contradict each other . However, extrapolating from the near/mid-infrared spectroscopy and hard X-ray photometry to bolometric luminosity and the possibility of significant correction of the observed luminosity for anisotropy introduce uncertainties of factors . We conclude that NGC 6240 (catalog ) is a composite object where both star formation and AGN play a role.
At the position of the K-band nuclei also Brackett emission is observed, however, very little continuum emission is detected at the position of the north-west extension of the Brackett emission. This could be an indication that the Brackett emission is arising from a very young starburst that has not yet formed enough stars to contribute to the continuum emission, but whose hot, young stars have already ionised the interstellar medium (ISM). If true, we can estimate the bolometric luminosity of this emission region using the radio-to-FIR correlation and get . This is about half the bolometric luminosity of the northern nucleus and of the total bolometric luminosity of NGC 6240 (catalog ), a non-negligible contribution to the total bolometric luminosity of NGC 6240 (catalog ). Colbert et al. (1994) have interpreted their third radio peak N3, based on its steeper radio spectrum, as a clump of electrons, driven away from the nucleus by a superwind. From the Brackett emission we think this explanation is less likely and favour instead that N3 is a young starburst region.
5 Stellar Kinematics
In the near-infrared wavelength range from stellar kinematics can be determined from absorption features of Ca, Na and CO. By far the strongest absorption feature is the absorption bandhead at . It has a very sharp blue edge which is very sensitive to stellar motions. Another advantage is that the extinction in the K-band is only of the visual extinction. The absorption bandhead is, therefore, very well suited for the determination of the stellar kinematics in the gas- and dust-rich infrared galaxies.
We have derived the velocity dispersions and radial velocities of the nuclei of NGC 6240 (catalog ) by using a modified Fourier correlation quotient (FCQ) method (Bender, 1990; Anders, 1999) and a direct fitting method on the absorption bandhead data. In the FCQ method the cross-correlation of the template spectrum with the galaxy spectrum and the auto-correlation of the template spectrum are computed in the Fourier domain. Then the quotient of the cross-correlation and the auto-correlation is calculated. To suppress high-frequency noise a Wiener filter is applied to the correlation-quotient. Fourier transformation of the correlation quotient finally yields the line-of-sight velocity distribution in the galaxy spectrum. In the direct fitting method a stellar template spectrum was convolved with a Gaussian broadening function. The broadening function was parameterised by a radial velocity and a velocity dispersion. With a least- fitting technique the best fitting set of parameters was computed. To derive the kinematic parameters with the FCQ method the deconvolved velocity profile is fit with a Gaussian profile. For the template spectra used in both methods we chose a K4.5 supergiant spectrum from the 3D stellar library (Schreiber, 1999). While the FCQ method is rather insensitive to template mismatch, the results from the direct fitting method depend very much on the choice of the stellar template spectrum. We find that the best choice for the type of the stellar template is a late K or an early M supergiant (see also §4.1). The errors of both the FCQ and the direct fitting method were determined by modeling of galaxy spectra from stellar spectra with different noise levels and trying to recover the input spectrum. With the direct fitting method a -analysis was used as an independent way to determine the fit error.
5.1 Stellar Mean Velocity field: Rotation and Dynamical Mass
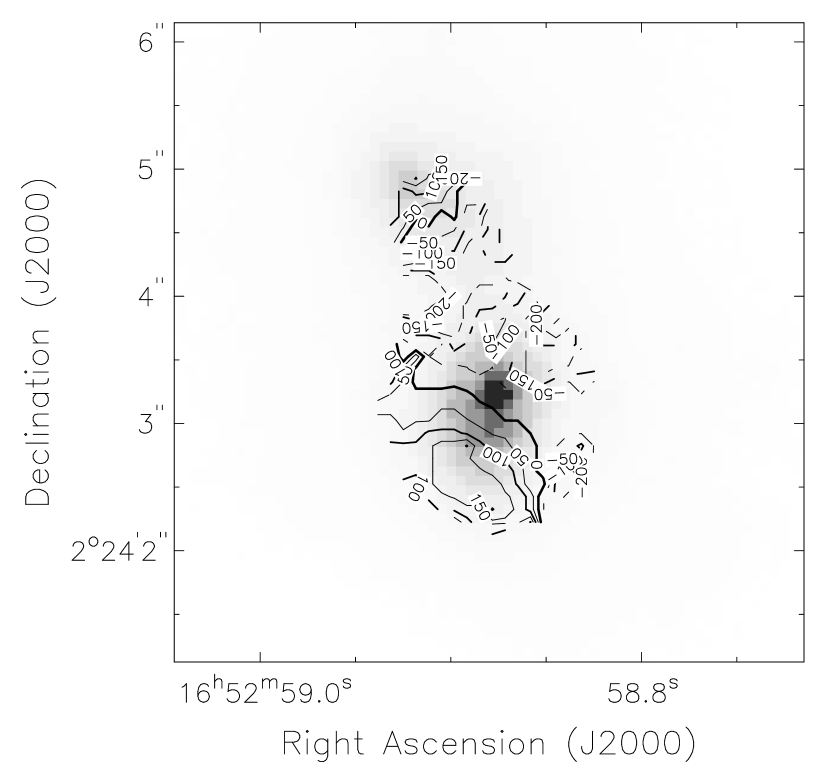
Because of the sharp edged profile of the CO absorption bandhead we were able to determine the stellar velocity field for the entire central region of NGC 6240 (catalog ) with the direct fitting method. The resulting velocity field is shown in contour form in Figure 7 superposed on the NICMOS K-band HST archival image (PI: N. Scoville, proposal ID: 7219). Velocity gradients across both nuclei are clearly recognizable. The velocity error at the position of the southern nucleus is and increases to at a distance of ; for the northern nucleus the value is and at a distance of . Along the edge of the velocity field shown in Figure 7 the uncertainty is .
The southern nucleus shows a velocity gradient at a position angle of west of the north-south axis with the south-east of the nucleus being redshifted. The velocity gradient of the northern nucleus has a position angle of east of the north-south axis. The north-east of the northern nucleus is redshifted with respect to the center. The maximum relative velocity shift from the center along the velocity gradient within is and for the southern and northern nucleus, respectively. The agreement of the K-band morphology from NICMOS with the kinematical morphology of the stellar velocity field is remarkable. The two nuclei are elongated along the velocity gradient in the velocity field, indicating individual inclined rotating disks in the nuclei. The northern nucleus is redshifted with respect to the southern nucleus by . This value is smaller than the value measured in the Brackett line and measured by Fried & Ulrich (1985) but consistent within the uncertainties of our measurement.
The stellar velocity is surprisingly different compared to the velocity field of the molecular gas. The gas forms a rotating disk between the two nuclei (Tacconi et al., 1999) with a axis of rotation not aligned with either of the stellar disks in the nuclei. This implys a decoupling of the stellar motions from the gas motions, most likely caused by the tidal forces of the interaction.
The dynamical mass of the NGC 6240 (catalog ) nuclei can be determined from the stellar velocity field. Under the assumption that the stars move on circular orbits around the center of each nucleus, the dynamical mass within the radius for a inclination corrected rotation velocity is given by
| (1) |
The measured recessional velocities for the two nuclei are shown in Figure 8. We fitted a model rotation curve to the data with a solid body () part for radii and a flat part at a rotation velocity for larger radii. The model disk was inclined towards the line of sight by an angle of and for the northern and southern nucleus, respectively. The inclination angles were determined by fitting ellipses to the isophotes of the NICMOS H-band image. The model disk was convolved with a Gaussian profile with FWHM, corresponding to the average observing conditions. For the assumed inclinations the best fit of the rotation curve is achieved with for the southern nucleus and for the northern nucleus. Even for an inclination of the rotation velocities are and , respectively. Assuming an extreme inclination angle, the dynamical mass within of the northern nucleus is , and for the southern nucleus. Such large masses can only be explained if the observed K-band nuclei are indeed true nuclei of the two merging progenitor galaxies. Given the likely inclinations indicated by the NICMOS images the true masses are likely even factors higher. Table 2 lists the derived dynamical masses of both nuclei for an inclination of and for the northern and southern nucleus, respectively.
We also list in Table 2 the ratio of dynamical mass to stellar mass content of the starburst derived from the light-to-mass ratio. The dynamical mass exceeds the visible mass by about an order of magnitude. The missing mass cannot be explained by a contribution of molecular gas at the position of the nuclei. The molecular gas is concentrated between the nuclei with a relatively small mass at the position of the nuclei (Tacconi et al., 1999). From the millimeter line flux within an diameter aperture on the nuclei an upper limit for the cold molecular gas mass in the nuclei can be determined. For the northern and southern nucleus this upper limit is and , respectively, of the gas mass within the central of the CO-disk. Taking for the mass of the gas concentration (Tacconi et al., 1999) the contribution from the cold molecular gas to the total mass of the nuclei is , much smaller than the missing mass. The contribution from a dark matter halo to the bulge masses cannot be determined from our data. In normal spiral galaxies this contribution is negligible. The only remaining likely source of missing mass is in the old stellar population of the progenitor galaxies themselves. The number of faint stars could add up to a significant mass, yet their luminosity would be negligible compared to the red supergiants of the recent starburst. We conclude that the two K-band peaks are indeed the central bulges of the progenitor galaxies and that these bulges are fairly massive, in accordance with the prediction of Mihos & Hernquist (1996) and Barnes & Hernquist (1996).
5.2 Stellar Velocity Dispersion: Mass Concentration between the Nuclei
While the sharp edge of the bandhead allows a redshift determination even for data with a low signal-to-noise ratio, we cannot determine the velocity dispersion from such data. We have, therefore, completed the analysis of the spatial variation of the velocity dispersion with integrated spectra for several apertures centered in the nuclear region of NGC 6240 (catalog ). To determine the true velocity dispersion we first subtracted the stellar rotation component as derived above. Within the selected apertures we corrected the data cube for the stellar rotational velocity field by shifting the spectra of all spatial pixels to the same restframe. Figure 9 shows the distribution of the velocity dispersion over the nuclear region of NGC 6240 (catalog ). We show the calculated velocity dispersion for four apertures: two centered on the nuclei; one centered between the nuclei; and one south of the southern nucleus. The error bars along the declination axis denote the width of the apertures over which the spectrum was integrated. The aperture width in right ascension is . Figure 9 shows that the velocity dispersion peaks between the two nuclei at , while the velocity dispersion at the northern and southern nucleus is and , respectively. Because this result is derived from the velocity field corrected data cube, the broad velocity profile cannot be due to the overlapping of two velocity profiles from components separated by scales larger than the spatial resolution of our observations, that is to .
Replacing with the velocity dispersion , equation (1) can also be used to estimate the mass within the radius . This is a very simplistic form of the Jeans equation (Binney & Tremaine, 1987) where only the isotropic part is considered and numerical factors from the space distribution of the stars and the spatial dependency of rotation and velocity dispersion are neglected (thus resulting likely in an under-estimate of the dynamical mass). Following this argument the peak of the velocity dispersion indicates a mass concentration between the two nuclei. We get masses for the northern and southern nucleus of and , respectively. Within the uncertainties this is consistent with the dynamical masses derived above. The mass between the nuclei is . The value of the masses determined in this way are somewhat questionable, since the Jeans equation applies to relaxed systems, a requirement that is not fulfilled in NGC 6240 (catalog ). At the peak of the stellar velocity dispersion little stellar continuum is detected. The low continuum flux between the nuclei cannot be explained by extinction which, although it peaks between the nuclei, is too low to explain a hidden concentration of stars. On the other hand, Tacconi et al. (1999) find a concentration of cold molecular gas of centered within between the nuclei. It is thus very likely that the peak of the stellar velocity dispersion is caused by this molecular gas concentration. Our extinction and maps indicate also that there is a corresponding peak of dust and hot .
6 Molecular Gas
6.1 Shock Excited Emission
From an analysis of the near-infrared line ratios Van der Werf (1996) and Sugai et al. (1997) conclude that is thermally excited with an excitation temperature of . The four lines we observed also fit this result. With the Infrared Space Observatory (ISO) pure rotational lines were detected for the first time in NGC 6240 (catalog ) (Lutz et al., 1996; Egami, 1998; Rigopoulou et al., 1999). The analysis of their line ratios yields an excitation temperature . Van der Werf (1996), Sugai et al. (1997) and Egami (1998) all find a slow continuous shock (C-shock) as the best fitting model for the excitation. Fast shocks would lead to a discontinuous or jump shock (J-shock). Due to the discontinuity J-shocks ionise the interstellar medium and hence emission from ionised elements is expected. The low Brackett to line ratio therefore indicates strongly that the shock is non-dissociative. The agreement of the Brackett and continuum morphology suggests the starburst as the source of the Brackett emission.
In the C-shock models the shock has a velocity , yet, the observed line widths are . The large line width are most likely a superposition of several narrower lines with different radial velocities along the line-of-sight. If we consider the distribution of molecular gas in form of dense clouds within a less dense intercloud medium we can explain the slow shock speed. The collision between molecular clouds occurs under a variety of angles and the shock speed therefore is only the projected radial velocity difference. But even for a direct collision, the shock speed in the denser cloud is smaller than in the lower density intercloud medium. An originally fast shock propagating in the intercloud medium will propagate with a slower shock speed when it enters a medium of higher density like a molecular cloud. It is these secondary slow shocks in the dense clouds that we are observing in the near-infrared ro-vibrational lines.
6.2 Cold and Hot Molecular Gas
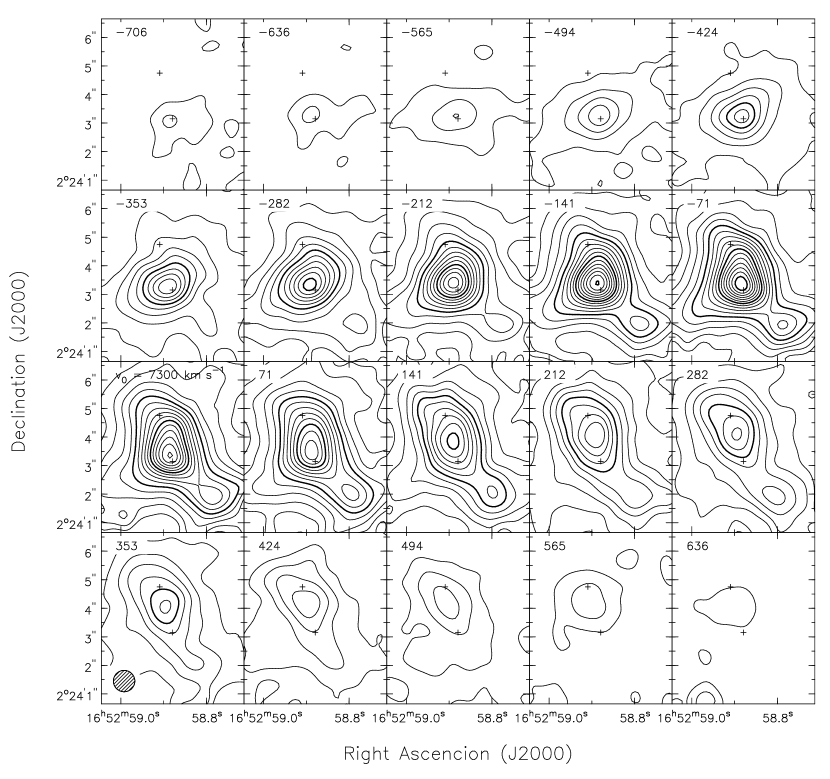
The gas motions in the central region of NGC 6240 (catalog ) are highly turbulent. Tacconi et al. (1999) find line width of up to FWHM (and FWZP) and their channel maps show filaments extending from a central CO-disk out to .
A comparison of Figure 10 with the channel maps of the line (Tacconi et al., 1999, Figure 2) indicates that the cold molecular gas () and the hot, shock-heated have a very similar overall morphology. Local differences between the and channel maps are apparent. The most obvious difference is in the central region between the nuclei. The hot gas is more extended than the cold gas and a disk structure as seen in the line is not visible. In addition, the line is to broader than the line. Both effects can be explained with a different distribution of the cold and hot gas. Roughly half of the cold gas has already settled in the center between the nuclei, while the shock-heated interstellar medium of the two galaxies is still more extended. The emission is excited on the surfaces of molecular clouds while the emission originates more in the volume of the molecular cloud. Because we sample with the emission a larger volume than with the emission, we also sample a larger range in radial velocities and hence observe larger linewidths for the lines. The larger line width of the lines are not symmetric about the peak of the lines but are blueshifted by .
In the structure outside the nuclear region of NGC 6240 (catalog ) the and emission is dominated by a filamentary structure. The filaments in the south-east and south-west are the most prominent and show similar morphology and kinematics in the and line. Also the weaker filaments north of the nuclei show this similarity. They are most likely gas flows towards the centers of the nuclei.
A comparison of the velocity profiles of the and lines is shown in Figure 3. From the line-of-sight velocity profiles in Figure 3 several kinematical components of the line are visible. They vary over the field, especially at the positions where the filaments extend from the emission peak. North-east of the northern nucleus two components are recognizable with a velocity difference of . The filament in the south-west shows also two major components with a velocity difference of . The line exhibits this multi-component character over the entire emission region of NGC 6240 (catalog ).
The radial velocity difference between northern and southern nucleus is in the line and in the line. This is similar to the radial velocity difference of the nuclei measured in the Brackett line. Globally the molecular gas appears to follow the motion of the two nuclei. As with the cold gas, a rotation of the hot gas seems the best explanation for the velocity gradient of the line. The velocity gradient peaks between the nuclei at the position of the emission peak. At this position the velocity dispersion of the emission also reaches its maximum of .
The central disk of cold molecular gas has a rotation axis which is not correlated with the rotation axis of either nucleus. Rather the sense of the rotation corresponds to the relative motions of the nuclei. The CO-disk seems to retain the memory of the orbital history of the interaction and is independent of the gravitational forces exerted by the nuclei.
7 Interaction and Merging
We have shown that NGC 6240 (catalog ) is a merging system of two galaxies with massive bulges. In the following sections results from our observations and published results are used to draw a more detailed picture of the interaction in NGC 6240 (catalog ).
7.1 Prograde Encounter?
The rotation velocities for both nuclei, derived in §5.1, are much larger than the relative velocity difference between the two nuclei. Assuming circular orbits for the nuclei the small radial velocity difference and projected distance between the nuclei yields a small projected orbital angular momentum of the nuclei. This means that the two galaxies either have lost a major fraction of their original orbital angular momentum in the interaction, or that the true orbital angular momentum is much larger than the projected value. A larger true orbital angular momentum means that the actual distance between the two nuclei is larger than the measured, projected separation. On the other hand, during the interaction of two galaxies their orbits can vary and the nuclei might rather be on radial than on circular orbits. In this case their orbital momentum could be still large. The exact trajectories of the galaxies depend on the initial conditions of the interaction.
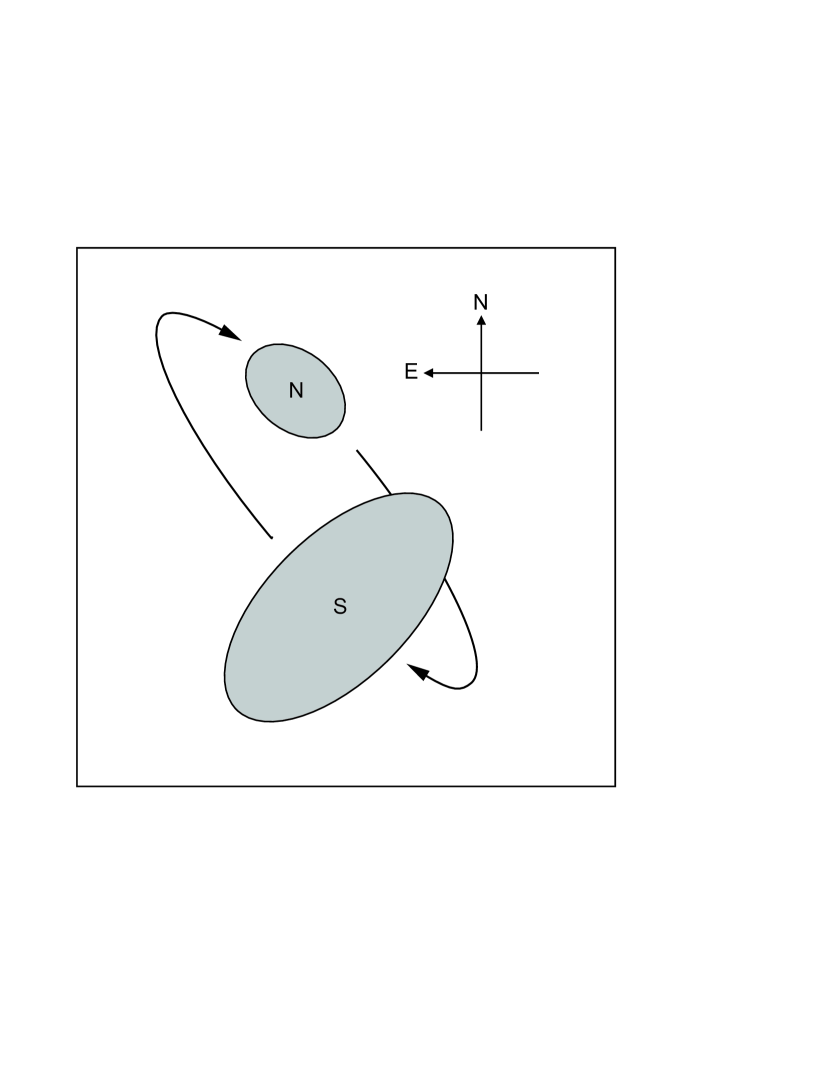
Because we can only observe projected angular momenta, the exact orientation of the disks with respect to the orbital plane cannot be determined. A schematic view of the collision geometry is shown in Figure 11. The projected spin angular momentum of the northern nucleus is almost parallel to the systems projected orbital angular momentum, while the projected spin angular momentum of the southern nucleus is nearly normal to it. If the projected angular momenta are the true angular momenta, one partner in the collision, now seen as the northern nucleus, was subject to a prograde encounter, while the other partner is inclined with respect to the orbital plane. For the motion of the two nuclei around each other we assume a circular orbit, whose position angle and inclination is equal to the position angle and the inclination of the rotating CO-disk between the nuclei (Tacconi et al., 1999). Under this assumption and with a radial velocity difference of the true distance between the two nuclei can be calculated. With a position angle of the CO-disk of and an inclination of the true separation of the two nuclei is , their orbital velocity is with an orbital period of million years. Assuming a simple two-body problem with equal mass of , this orbit is unstable with the gravitational force being of the centrifugal force. This means that the two nuclei will separate in the future and probably are already past the pericenter. Whether the system is bound can be estimated from the escape velocity. We compute an escape velocity of , which is of the same order as the radial velocity difference of the two nuclei. From the radial velocity difference the system seems to be unbound. However, if the nuclei separate again they will see not only the mass of the other nucleus but also the halo of the other galaxy. Conversion of orbital angular momentum into spin angular momentum in the halo leads to gravitational braking, the galaxies reach their apocenter and fall back together again (Barnes & Hernquist, 1996; Mihos & Hernquist, 1996). It seems therefore likely, that NGC 6240 (catalog ) has recently undergone an encounter and is awaiting its next encounter.
7.2 Tidal tails
The first indication that NGC 6240 (catalog ) might be an interacting galaxy system was its disturbed morphology with loops, branches and arms. Toomre & Toomre (1972) showed that such tails can be formed by tidal forces in an interaction of two galaxies. Tidal forces during the interaction pull stars from the galaxies into regions at a distance of up to several tens of kiloparsec from the center of the galaxies. The formation of tidal tails is therefore an efficient way to dissipate orbital angular momentum of the interacting galaxies thus allowing the galaxies to come closer to each other and finally merge. That the tails in NGC 6240 (catalog ) are dominated by stellar light can be seen from broad and narrow band imaging. The tidal tails visible in the R-band image of Armus, Heckman & Miley (1990) are not as prominent in their narrow band image of [N II] which are the most dominant emission lines in this wavelength band. The formation of tidal tails is favoured if at least one partner in the collision is subject to a prograde encounter. The spin and orbital angular momenta of the nuclei suggest a prograde encounter for what is now the northern nucleus. But not only the geometry of the collision is important for the formation of tidal tails. Springel & White (1998) and Dubinski, Mihos & Hernquist (1999) show that the mass density distribution of the interacting galaxies is an important parameter in the formation of tidal tails. Galaxies with more massive halos tend to form less sharp and shorter tidal tails. The tidal tails in NGC 6240 (catalog ) are not as “crisp” as in NGC 4038/9 (catalog ) (“The Antennae”) or in NGC 4676 (catalog ) (“The Mice”), indicating the collision of two massive spiral galaxies. Because the parameter space of galaxy interaction models is too large, it is impossible to derive a detailed history of NGC 6240 (catalog ) from the morphology of its tidal tails. However, simulations of interacting and merging galaxies show, that tidal tails can only be formed after the first encounter of the galaxies. Because we see tidal tails in NGC 6240 (catalog ) which are quite long, it must have undergone at least one encounter. The tidal tails of NGC 6240 (catalog ) were most likely created in the first encounter. How many passages NGC 6240 (catalog ) has undergone we cannot determine from the tidal tails. But because the two nuclei are still distinct from each other, it seems that only few encounters can have happened and that NGC 6240 (catalog ) is in a rather early merger phase.
Doyon et al. (1994) showed from K-band photometry that the overall brightness distribution of NGC 6240 (catalog ) is very similar to that of an elliptical galaxy. They concluded that NGC 6240 (catalog ) is in an advanced merger state and in the process of forming an elliptical galaxy. We believe that this evidence is rather weak and the conclusion should be treated with caution.
-
1.
The near-infrared light of the nuclei comes from supergiants and not from the old stars representing the overall stellar population. Population and changes with radius are rather likely.
-
2.
While a -law or a King-profile fits the data it is not unique to elliptical galaxies.
-
3.
The stellar dynamics definitely shows that the two galaxies are still independent entities and have not yet merged.
However, the small separation of the nuclei and the decoupling of the gas from the stars in NGC 6240 (catalog ) strongly suggest that the nuclei will merge. But as the formation of tidal tails depends on the mass density distribution of the interacting galaxies the merging time also varies with the mass density distribution. Galaxies with extended massive halos have longer merging times than galaxies with compact low mass halos. Only in the final merging phase violent relaxation leads to a strong and rapid dynamical evolution also on global scales (Mihos & Bothun, 1998).
What type of galaxy the merger remnant will resemble we cannot predict from the data. However, NGC 6240 (catalog ) might form an elliptical galaxy of which it shows already signatures. The stellar velocity dispersion in the nuclei of NGC 6240 (catalog ) is typical for an elliptical galaxy. Outside the nuclear region the K-band light can be fit by a -law which also approximates the surface brightness profile of merger remnants in numerical simulations of galaxy mergers (Barnes, 1992).
7.3 Nuclear Starbursts
Another hint at how many passages NGC 6240 (catalog ) has already undergone comes from the age and duration of the nuclear starbursts. In §4.2 we determined the age of the starburst to be to million years. Numerical simulations predict that such nuclear starbursts in merging galaxies are triggered by close passages of the two galaxies. If this was true, the last encounter happened million years ago. Because the tidal tails are quite long and pronounced, the first encounter must be well past and the last passage was probably at least the second encounter. The dynamical time-scale of the orbital motion of the two nuclei is a few million years and is of the same order as the age of the starburst. The extent of the superwind () and its velocity () yields an age for the superwind of million years, similar to the lifetime of a superwind (Heckman et al., 1990). If taken into account that the superwind sets in roughly million years after the starburst, the superwind and the K-band continuum can be explained by the same starburst. The duration of the starburst is much shorter than the age of the starburst and can be explained by a negative feedback effects of the starburst through supernovae and stellar winds. Numerical simulation by Mihos & Hernquist (1996) predict an episodic star formation during the merging of two galaxies. Gas streaming into the central regions gets compressed and triggers star formation. Depending on the existence of massive bulges one major starburst takes place either after the first encounter or during the final merging of the two galaxies. Because NGC 6240 (catalog ) is clearly not in the stage of final merging, the starburst we see has likely been triggered in an early encounter.
7.4 Gas Concentration between the Nuclei
The presence of a self-gravitating cold molecular gas concentration between the nuclei of NGC 6240 (catalog ) is not expected from numerical simulations of galaxy mergers (Barnes & Hernquist, 1996; Mihos & Hernquist, 1996). These simulations predict that the highly dissipative gas follows the stellar distribution. Gas disks form around the individual galaxy nuclei and get more compact as the merger advances. From the point of view of these simulations it would appear as if NGC 6240 (catalog ) has to be in a rare transient phase.
However, NGC 6240 (catalog ) is not the only galaxy with a gas concentration between two nuclei. VV 114 (catalog ) (Yun, Scoville & Knop, 1994), NGC 6090 (catalog ) (Gao et al., 1998; Bryant & Scoville, 1999) and NGC 4038/9 (catalog ) (Stanford et al., 1990) all have prominent CO-emission peaks between the two nuclei. In all cases the projected distance between the nuclei ( for VV 114 (catalog ), for NGC 6090 (catalog ) and for NGC 4038/9 (catalog ); ) is much larger than the separation of for NGC 6240 (catalog ). NGC 6240 (catalog ) is also an exception because very little CO-emission is observed at the position of the nuclei. In NGC4038/9 (catalog ) three clearly distinct gas concentrations are detected: two at the position of the nuclei; and a third between the nuclei, which contains roughly half of the total gas mass. NGC 6240 (catalog ), too, has half of the molecular gas in a central concentration between the nuclei but the other half is in filaments extending from the central gas concentration. In VV 114 (catalog ) the molecular gas is in a bar-like concentration with tails extending from it. NGC 6090 (catalog ) shows a ridge-like structure of molecular gas which covers also both nuclei. VV 114 (catalog ), NGC 6090 (catalog ) and NGC 4038/9 (catalog ) are all, mainly based on the large separations, considered to be early mergers. The small separation of the two nuclei in NGC 6240 (catalog ) could be interpreted as if NGC 6240 (catalog ) was in an advanced merger state. However, to derive the evolutionary state of merging galaxies only on the nuclear separation can be misleading. Due to projection effects and unknown orbits of the galaxies the nuclear separation could be much larger.
8 Conclusions
From the high resolution near-infrared integral field spectroscopy of NGC 6240 (catalog ) we find:
-
•
The K-band light of the two nuclei in NGC 6240 (catalog ) is dominated by red supergiants which must have been formed in a starburst million years ago. The duration of the star formation is million years, thus only a small fraction of the starburst age. The total mass of stars formed in the starburst is .
-
•
The stars in the two K-band peaks exhibit fast rotation. From the stellar velocity field the dynamical mass of the nuclei is determined to be within the central with similar masses for both nuclei. This exceeds the mass of the most massive star forming regions by more than , implying that the two infrared emission peaks are the massive, rotating bulges of two interacting and merging galaxies.
-
•
After correction for the rotation component the stellar velocity dispersion peaks between the two nuclei at the emission peak of the molecular gas. The inferred mass concentration is a self-gravitating concentration of molecular gas.
-
•
The emission of NGC 6240 (catalog ) peaks between the two nuclei and is thermally excited in a slow, continuous shock triggered by the collision of the two galaxies. Molecular gas streams to the centers of the galaxies where the turbulent motions also give rise to shock excited emission.
-
•
From the orbital and spin angular momenta of the interacting galaxies it seems that one galaxy in the system is subject to a prograde encounter. Based on the morphology of the tidal tails, the starburst scenario, the kinematics and the excitation of the emission, we argue that we observe NGC 6240 (catalog ) shortly after an early encounter which triggered the observed starburst.
References
- Anders (1999) Anders, S. W. 1999, PhD thesis
- Armus, Heckman & Miley (1990) Armus, L., Heckman, T. M. & Miley, G. K. 1990, ApJ, 364, 471
- Barnes (1992) Barnes, J. E. 1992, ApJ, 393, 484
- Barnes & Hernquist (1996) Barnes, J. E. & Hernquist, L. 1996, ApJ, 471, 115
- Bender (1990) Bender, R. 1990, A&A, 229, 441
- Binney & Tremaine (1987) Binney, J., Tremaine, S. 1987, in Galactic Dynamics, (Princeton: Princeton University Press)
- Bryant & Scoville (1999) Bryant, P. M., Scoville, N. Z. 1999, AJ, 117, 2632
- Colbert et al. (1994) Colbert, E. J. M., Wilson, A. S. & Bland-Hawthorn, J. 1994, ApJ, 436, 89
- Condon et al. (1982) Condon, J. J., Condon, M. A., Gisler, G. & Puschell, J. J. 1982, ApJ, 252, 102
- Doyon et al. (1994) Doyon, R., Wells, M., Wright, G. S., Joseph, R. D., Nadeau, D. & James, P. A. 1994, ApJ, 437, L23
- Draine (1989) Draine, B. T. 1989, in Infrared Spectroscopy in Astronomy, Proceedings of the 22nd Eslab Symposium, ed. Kaldeich, B. H., 93
- Draine & Woods (1990) Draine, B. T. & Woods, D. T. 1990, ApJ, 363, 464
- Dubinski, Mihos & Hernquist (1999) Dubinski, J., Mihos, C. & Hernquist, L. 1999, astro-ph/9902217
- Egami (1998) Egami, E. 1998, in Proc. IAU Symposium 186, Galaxy Interactions at Low and High Redshift, eds. Barnes, J. & Sanders, D., (Dordrecht: Kluwer)
- Fried & Schulz (1983) Fried, J. W. & Schulz, H. 1983, A&A, 118, 166
- Fried & Ulrich (1985) Fried, J. W. & Ulrich, H. 1985, A&A, 152, L14
- Fosbury & Wall (1979) Fosbury, R. A. E. & Wall, J. V. 1979, MNRAS, 189, 79
- Gao et al. (1998) Gao, Y., Gruendl, R. A., Hwang, C.-Y., Lo, K. Y. 1998, in Proc. IAU Symposium 186, Galaxy Interactions at Low and High Redshift, eds. Barnes, J. & Sanders, D., (Dordrecht: Kluwer)
- Genzel et al. (1998) Genzel, R., Lutz, D., Sturm, E., Egami, E., Kunze, D., Moorwood, A. F. M., Rigopoulou, D., Spoon, H. W. W., Sternberg, A., Tacconi-Garman, L. E., Tacconi, L. & Thatte, N. 1998, ApJ, 498, 579
- Heckman et al. (1990) Heckman, T. M., Armus, L. & Miley, G. K. 1990, ApJS, 74, 833
- Herbst et al. (1990) Herbst, T. M., Graham, J. R., Tsutsui, K., Beckwith, S., Matthews, K. & Soifer, B. T. 1990, AJ, 99, 1773
- Iwasawa & Comastri (1998) Iwasawa, K. & Comastri, A. 1998, MNRAS, 297, 1219
- Keel (1990) Keel, W. C. 1990, AJ, 100, 356
- Keto et al. (1997) Keto, E., Hora, J. L., Deutsch, L., Hoffmann, W., Fazio, G. G., Ball, R., Meixner, M., Skinner, C., Arens, J. F. & Jernigan, G. 1997, ApJ, 485, 598
- Komossa, Schulz & Greiner (1998) Komossa, S., Schulz, H. & Greiner, J. 1998, A&A, 334, 110
- Lester, Harvey & Carr (1988) Lester, D. F., Harvey, P. M. & Carr, J. 1988, ApJ, 329, 641
- Lester & Gaffney (1994) Lester, D. F. & Gaffney, N. I. 1994, ApJ, 431, L13
- Lisenfeld, Voelk & Xu (1996) Lisenfeld, U., Voelk, H.J. & Xu, C. 1996, A&A, 314, 745
- Lutz et al. (1996) Lutz, D., Genzel, R., Sternberg, A., Netzer, H., Kunze, D., Rigopoulou, D., Sturm, E., Egami, E., Feuchtgruber, H., Moorwood, A. F. M. & De Graauw, T. 1996, A&A, 315, L137
- Mihos & Hernquist (1996) Mihos, J. C. & Hernquist, L. 1996, ApJ, 464, 641
- Mihos & Bothun (1998) Mihos, J. C. & Bothun, G. D. 1998, ApJ, 500, 619
- Miller & Scalo (1979) Miller, G. E. & Scalo, J. M. 1979, ApJS, 41, 513
- Oliva et al. (1995) Oliva, E., Origlia, L., Kotilainen, J. K. & Moorwood, A. F. M. 1995, A&A, 301, 55
- Origlia, Moorwood & Oliva (1993) Origlia, L., Moorwood, A. F. M. & Oliva, E. 1993, A&A, 280, 536
- Rigopoulou et al. (1999) Rigopoulou et al. 1999, in preparation
- Salpeter (1955) Salpeter, E. E. 1955, ApJ, 121, 161
- Sanders et al. (1988) Sanders, D. B., Soifer, B. T., Elias, J. H., Madore, B. F., Matthews, K., Neugebauer, G. & Scoville, N. Z. 1988, ApJ, 325, 74
- Schreiber (1999) Schreiber, N. M. 1999, PhD thesis,
- Schulz et al. (1998) Schulz, H., Komossa, S., Berghofer, T. W. & Boer, B. 1998, A&A, 330, 823
- Springel & White (1998) Springel, V. & White, S. D. M. 1998, astro-ph/987320
- Stanford et al. (1990) Stanford, S. A., Sargent, A. I., Sanders, D. B. & Scoville, N. Z. 1990, ApJ, 349, 492
- Sugai et al. (1997) Sugai, H., Malkan, M. A., Ward, M. J., Davies, R. I. & MCLean, I. S. 1997, ApJ, 481, 186
- Tacconi et al. (1999) Tacconi, L. J., Genzel, R., Tecza, M., Gallimore, J. F., Downes, D. & Scoville, N. Z. 1999, ApJ, 524, 732
- Thatte et al. (1995) Thatte, N., Kroker, H., Weitzel, L., Tacconi-Garman, L. E., Tecza, M., Krabbe, A. & Genzel, R. 1995, in Proc. SPIE, 2475, 228
- Thornley et al. (1999) Thornley, M. 1999, in preparation
- Thronson et al. (1990) Thronson, H. A., Jr., Majewski, S., Descartes, L. & Hereld, M. 1990, ApJ, 364, 456
- Toomre & Toomre (1972) Toomre, A. & Toomre, J. 1972, ApJ, 178, 623
- Van der Hulst et al. (1992) Van der Hulst, J. M., Terlouw, J. P., Begeman, K., Zwitser W. & Roelfsema, P. R. 1992, in ASP Conf. Ser. 25, Astronomical Data Analysis Software and Systems I, ed. D. M. Worall, C. Biemesderfer & J. Barnes (San Fransisco: ASP), 131
- Van der Werf et al. (1993) Van der Werf, P. P., Genzel, R., Krabbe, A., Blietz, M., Lutz, D., Drapatz, S., Ward, M. J. & Forbes, D. A. 1993, ApJ, 405, 522
- Van der Werf (1996) Van der Werf, P. P. 1996, in Cold Gas at High Redshift, eds. Bremer, M.N., Van der Werf, P.P., Roettgering, H.J.A. & Carilli, C.L., (Dordrecht: Kluwer), 37
- Vignati et al. (1999) Vignati, P., Molendi, S., Matt, G., Guainazzi, M., Antonelli, L. A., Bassani, L., Brandt, W. N., Fabian, A. C., Iwasawa, K., Maiolino, R., Malaguti, G., Marconi, A. & Perola, G. C. 1999, A&A, 349, L57
- Weitzel et al. (1996) Weitzel, L., Krabbe, A., Kroker, H., Thatte, N., Tacconi-Garman, L. E., Cameron, M. & Genzel, R. 1996, A&AS, 119, 531
- Wright et al. (1984) Wright, G. S., Joseph, R. D. & Meikle, W. P. S. 1984, Nature, 309, 430
- Yun, Scoville & Knop (1994) Yun, M. S., Scoville, N. Z. & Knop, R. A. 1994, ApJ, 430, L109


| Wave Band | Aperture | Diameter | ||
|---|---|---|---|---|
| (1) | (2) | (3) | (4) | (5) |
| 1 | ||||
| S | ||||
| 2 | ||||
| K-Band | ||||
| 1 | ||||
| N | ||||
| 2 | ||||
| 4 | ||||
| 4 | ||||
| 4 | ||||
| 4 | ||||
| S | ||||
| Brackett | N | |||
| N3 |
Note. — Columns: (1) Wave band; (2) Position of circular aperture: southern nucleus (S), northern nucleus (N), emission peak () and radio peak N3 (see Colbert et al., 1994); (3) Diameter of circular aperture in seconds of arc; (4) Luminosity in (); (5) Dereddened K-band luminosity in . Extinction values are for a foreground screen model from §3.2.
| Nucleus | |||||
|---|---|---|---|---|---|
| (1) | (2) | (3) | (4) | (5) | (6) |
| North | |||||
| South |
Note. — Columns: (1) Nucleus; (1) Stellar mass in within ; (2) Stellar mass in within ; (3) Inclination of stellar disks; (4) Rotation velocity in ; (5) Dynamical mass in within ; (6) Ratio of dynamical and stellar mass.