Microjansky radio sources in DC010746 (Abell 2877)
Abstract
The cluster DC010746 (Abell 2877) lies within the Phoenix Deep Survey, made at 1.4 GHz with the Australia Telescope Compact Array. Of 89 known optical cluster members, 70 lie within the radio survey area. Of these 70 galaxies, 15 (21%) are detected, with luminosities as faint as W Hz-1. Spectroscopic observations are available for 14/15 of the radio-detected cluster galaxies. Six galaxies show only absorption features and are typical low-luminosity AGN radio sources. One galaxy hosts a Seyfert 2 nucleus, two are star-forming galaxies, and the remaining five may be star-forming galaxies, AGNs, or both.
1 Introduction
While “classical” radio galaxies powered by an active galactic nucleus (AGN) dominate 1.4 GHz source counts above 1 mJy, deeper radio surveys reveal a “new” population of radio galaxies at sub-millijansky levels. Spectroscopy and multicolour photometry (Windhorst et al., 1985; Thuan & Condon, 1987; Benn et al., 1993; Windhorst et al., 1994; Hammer et al., 1995; Georgakakis et al., 1999) show that the faint radio population comprises an increasing proportion of star forming galaxies and a decreasing proportion of AGN-powered galaxies. The evolutionary status of the star-forming galaxies, and the role of interactions and mergers in the population are only partially understood. This paper presents one of the first studies of the sub-mJy population in an Abell cluster (see also Moffet & Birkinshaw, 1989).
Radio surveys of clusters of galaxies typically detect only a few sources that are true cluster members. For example, Robertson & Roach (1990) found that the detection rate of bright radio sources (S mJy) in Abell clusters is about 5% when corrected for chance coincidences. Any such detections are intrinsically luminous, AGN-powered radio galaxies. At fainter flux density limits, (S mJy), Ledlow & Owen (1995) detected at least one radio source in just under 40% of a distance-limited cluster sample (), with a mean number of 1.4 radio sources per cluster. Similar studies have been reported by Stocke et al. (1999) and Zhao et al. (1989). The sources detected in these deep surveys are again almost all AGN-powered, with radio luminosities greater than W Hz-1. Late-type galaxies in clusters are sometimes detected (e.g., Andersen & Owen, 1995), but less frequently due to their low radio luminosity and low space density.
The importance of excising cluster radio source contributions in measurements of the Sunyaev-Zeldovich effect has prompted a few deep surveys of selected clusters (e.g., Moffet & Birkinshaw, 1989; Herbig et al., 1995; Myers et al., 1997). However, these studies have not intended to explore the astrophysical properties of the detected sources, and have not done so.
This paper discusses the cluster radio sources found in a deep 1.4 GHz survey (the Phoenix Deep Survey, PDS) which covers part of DC010746 (Abell 2877, see Dressler 1980b and Abell et al. 1989; Appendix A summarises the main properties of this cluster). The survey region was chosen to avoid if possible sources brighter then mJy, and it contains none of the apparently bright, intrinsically luminous, AGN-powered sources described above. We show, however, that the sub-mJy radio source population in the cluster is dominated by low-power (L W Hz-1) sources which are still generally powered by AGNs. We adopt kms-1Mpc-1 and in the following analysis and discussion.
2 Observations
The Phoenix Deep Survey (PDS, Hopkins et al., 1999, and references therein) covers a high-latitude region of low optical obscuration and devoid of bright radio sources. Australia Telescope Compact Array (ATCA) observations of the PDS field at 1.4 GHz reach a limiting flux density of Jy over a two degree diameter field, and encompass a diameter field having a level ranging from Jy at the perimeter to Jy at its most sensitive (Hopkins et al., 1999, 1998). A radio source list has been compiled using the sfind package of Miriad.
Optical observations of the PDS field have been undertaken using the Anglo-Australian Telescope (AAT). CCD imaging includes R-band photometry for almost the complete field and V-band for slightly more than half (Georgakakis et al., 1999). Optical catalogues constructed from the CCD images using focas (Jarvis & Tyson 1981; see Georgakakis et al. 1999 for details of the catalogue construction) are complete to . Optical identifications of the radio sources have been attempted by cross-matching the radio and optical catalogues. Approximately 50% of the radio sources have candidate optical identifications. Optical spectra of over 200 of the optical candidates have been taken using the 2 degree field facility (2dF) of the AAT. These have been analysed to yield redshifts and, in many cases, spectroscopic classifications of the host galaxy (Georgakakis et al., 1999).
The 2 degree PDS field overlaps part of A2877. While almost all of the PDS galaxies lie beyond the cluster, the overlap nevertheless provides an opportunity to explore the sub-mJy population in the cluster itself. This exploration is assisted by a study of galaxy cluster dynamics by Malumuth et al. (1992) reporting redshifts for 125 galaxies which were candidates for membership of A2877. Of these 125 objects, spectroscopy by Malumuth et al. (1992) showed that 2 are foreground galaxies and a further 34 have radial velocities outside the clipped sample or lying in a sheet behind the cluster. This leaves 89 spectroscopically confirmed cluster galaxies.
Radio counterparts of these A2877 members have been sought by cross-matching the optical sources of Malumuth et al. (1992) with the PDS radio catalogue. The region of the PDS overlaps about 75% of A2877 and contains 70 of the 89 cluster galaxies within the radio survey area. Of these 70 galaxies, 15 (21%) are detected at 1.4 GHz. There are 6 other radio detections identified with galaxies excluded from the cluster by Malumuth et al. (1992): 2 from the background sheet (velocities between 9000 and 10000 kms-1) and 4 at higher redshifts (). The 1.4 GHz flux density for the radio-detected cluster galaxies ranges from 0.1 mJy to 14 mJy. The cD galaxy is the fifth brightest source at 1.6 mJy. Of the 15 PDS/A2877 sources, 14 have 2dF spectra. Table 1 presents radio flux densities, optical magnitudes, and morphologies for the 15 radio-detected galaxies. The redshifts and luminosities are also shown, and H luminosities are given for the galaxies with H emission.
3 Results
Figure 1 shows radio contours overlayed on the AAT CCD images for the 15 radio-detected cluster galaxies. These images were produced using the kview application from the Karma software suite (Gooch, 1995). Figure 2 shows spectra of the 8 radio-detected cluster galaxies with emission features. It is important to note that the projected area of the 2dF fibres is approximately 1 kpc at the distance of A2877, so that these spectra are from the nuclear regions only. The beam of the ATCA 1.4 GHz observations corresponds approximately to 3 kpc at the cluster distance.
Notes on individual cluster objects:
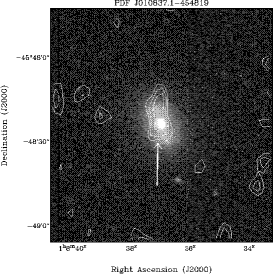
PDF J010837.1454819: The radio emission in this S0 galaxy is extended. The spectrum shows H, [Nii]( nm) and [Sii]( nm) emission, but no H, [Oiii]( nm) or [Oi]( nm). The [Nii]/H and [Sii]/H equivalent width (EW) ratios are 0.5 and 0.4, respectively. In spectral diagnostic diagrams, (e.g., Veilleux & Osterbrock, 1987), such ratios place the galaxy on the locus separating star forming galaxies from Seyfert 2s and LINERs. Both AGN and star formation processes may be present.
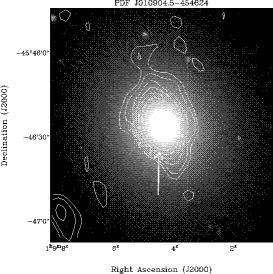
PDF J010904.5454624: Also catalogued as ESO 243 G 045, this galaxy has an E/S0 morphology and unresolved radio emission centred on the optical nucleus. The spectrum shows no emission and has absorption lines characteristic of an evolved stellar population. The radio emission is likely to be due solely to an AGN.
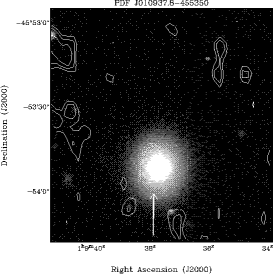
PDF J010937.8455350: The radio contours in this S0 galaxy are displaced from the optical nucleus, perhaps indicating a radio lobe. No emission lines are seen in this galaxy’s spectrum, consistent with the radio source being excited by an AGN.
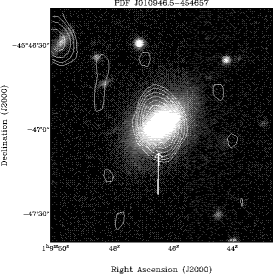
PDF J010946.5454657: This galaxy has an S0 morphology, with radio contours centred on the optical nucleus. The spectrum shows emission lines which unambiguously identify it as a Seyfert 2 or LINER in spectral diagnostic diagrams. The absence of strong [Oi] emission and the presence of strong [Oiii] emission suggest a Seyfert 2 interpretation (Heckman, 1980). The galaxy was also detected by Caldwell & Rose (1997) with an emission-line spectrum (their Figure 10a, spectrum 43b).
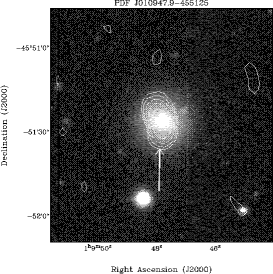
PDF J010947.9455125: This S0 galaxy has radio contours centred on the optical nucleus. The spectrum shows H, [Nii] and [Sii] emission, while H is present in absorption, and no [Oiii] is detected. The [Nii]/H and [Sii]/H EW ratios of 0.6 and 0.3, respectively, give conflicting suggestions as to the nature of the activity. The relative strength of the [Nii]/H emission is suggestive of a Seyfert 2 nucleus, but [Sii] and [Oiii] are rather weak. Both AGN and star-formation processes may be present. The presence of H in absorption suggests that this is a post-starburst galaxy, possibly with a current AGN (e.g., Smail et al., 1999).
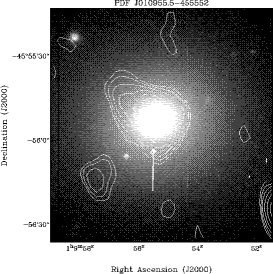
PDF J010955.5455552: This is IC 1633, the cluster cD galaxy. The radio contours are centred on the optical nucleus. An extension to the north-east is possible evidence of a radio lobe. The spectrum shows no emission features, and has absorption lines characteristic of an evolved stellar population.
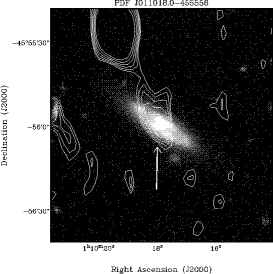
PDF J011018.0455556: This S0 galaxy has extended radio contours centred on the optical nucleus. The outer parts of the optical object have discernible structure, perhaps due to dust. A nearby, brighter radio source is associated with a faint () optical object. This is most likely a background source, but could possibly be a dwarf companion showing interaction-induced star formation. The spectrum shows no identifiable emission features, and evolved stellar population absorption features are clearly detected.
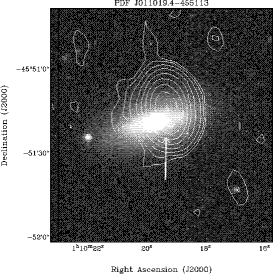
PDF J011019.4455113: This S0 galaxy is the strongest radio source in the sample. The radio contours are displaced significantly from the optical nucleus. No spectrum is available. The radio source could be (1) a coincidentally located background source; (2) nuclear emission displaced due to astrometric errors; (3) strong, localised disk star formation; (4) a radio lobe; or (5) a radio supernova associated with the galaxy. Case (1) is unlikely, as there is only a 0.2% chance of an accidental coincidence between optical and radio sources of this magnitude. The close agreement between the positions of the weak radio source to the southwest and its faint optical counterpart argue against a large astrometric error. The radio emission is of a luminosity about an order of magnitude greater than that due to the extreme Type II radio supernova RSN 1986J (Weiler et al., 1990; Smith et al., 1998). Hence, if a supernova origin for the radio emission is correct, it is unlikely to be due to a single object. Perhaps several radio supernovae are present in a localised burst of star formation. While planned optical spectroscopy will detect any star formation activity, a single displaced radio lobe remains another possible interpretation.
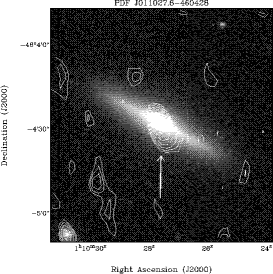
PDF J011027.6460428: Also catalogued as ESO 243 G 049, this S0 galaxy has radio contours centred on the optical nucleus. The spectrum shows evolved stellar population absorption features. An AGN origin for the radio emission is likely.
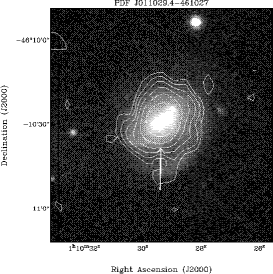
PDF J011029.4461027: Dressler’s classification is Sb(p). This face-on flocculent spiral shows knots of optical emission towards the nucleus. The radio contours are extended but centred on the optical nucleus. The spectrum has emission lines which indicate the galaxy has strong Hii regions. The IRAS 60 flux density is 0.455 Jy, giving , consistent with the well-established radio/FIR correlation for spiral galaxies. Star formation is the likely cause of the radio emission in this galaxy. The calibration of radio luminosity to SFR given in Cram et al. (1998) implies this galaxy has SFRyr-1. This is significantly higher than the SFR derived from the H luminosity, (again using the relations given by Cram et al. 1998), SFRyr-1.
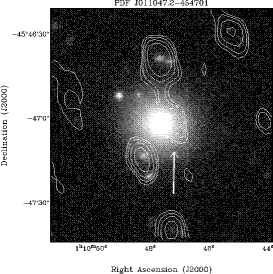
PDF J011047.2454701: This S0 galaxy has six apparent dwarf companions in the optical image. The radio contours are displaced from the optical nucleus, and two apparent companions show radio emission. The spectrum shows an evolved stellar population and no hint of emission. This suggests that the offset radio source could be the radio lobe of an AGN. This group of radio and optical sources is quite unusual and invites further study.
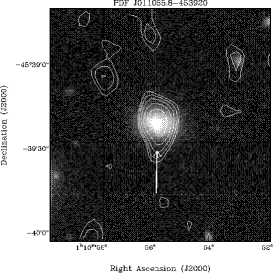
PDF J011055.8453920: This galaxy is present but unclassified in Dressler’s catalogue. The optical isophotes hint at a three-armed spiral or the presence of a second nucleus. The radio contours, centred on the peak of the optical emission, show a slight extension in the direction of the optical asymmetry. The spectrum shows emission features which clearly define the galaxy as an Hii-region type in spectral diagnostic diagrams. The radio emission is probably due to star formation. If so, this is the only galaxy in the cluster whose unusual optical morphology gives possible evidence of merger-induced star formation. The implied SFRs from 1.4 GHz and H luminosities are 0.08 and yr-1 respectively. Note that the H luminosity in this case has been derived from the equivalent width of the emission line.
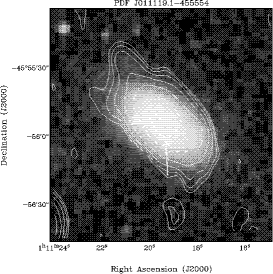
PDF J011119.1455554: This galaxy is ESO 243 G 051. Dressler’s classification is Sb. The radio contours are centred close to the optical nucleus and show extension tracing the optical emission. The spectrum shows absorption features with weak H and [Nii] emission, with [Nii] stronger and indicative of an AGN. However, the 60 flux density is 0.598 Jy, giving , consistent with the well-established radio/FIR correlation for star-forming galaxies. Both AGN and star-formation processes may be present. The radio and H luminosities can be used in this case to provide an upper limit to the SFR, giving SFRyr-1 and SFRyr-1. Again, the SFR from H is much lower than the radio estimate.
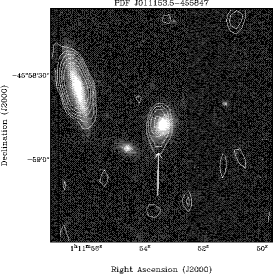
PDF J011153.5455847: This galaxy has early-type optical morphology. The radio source is displaced from the optical nucleus. The spectrum shows emission features and the galaxy’s location in spectral diagnostic diagrams is ambiguous. The radio emission may be coming from both star formation and nuclear activity. The large nearby edge-on spiral galaxy is unrelated, being at a redshift of 0.089, but there is a faint apparent optical companion lying close to the direction of displacement of the radio emission.
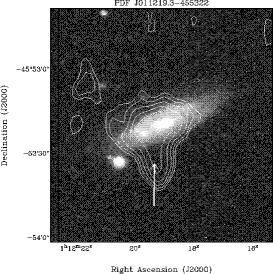
PDF J011219.3455322: Catalogued as ESO 244 G 001, this galaxy has an Scd morphology, and shows knotty or dusty features. The radio emission is asymmetric with respect to the optical nucleus, and extended southward where no optical emission is present. The apparent optical companions show no radio emission, and a low-level radio companion is also present with no optical counterpart. The spectrum shows emission features, and has an ambiguous classification between diagnostic diagrams. This galaxy may be hosting both star formation and AGN activity. The implied upper limits to the SFRs derived from radio and H luminosities are 0.3 and yr-1 respectively, again with SFRHα much lower than SFR1.4.
4 Discussion
Of the 70 spectroscopically confirmed members of A2877 overlapping the PDS, % have early-type (E/S0) morphology. This is consistent with the 63% quoted by Caldwell & Rose (1997), who give the proportions for the total of both Dressler clusters DC010746 and DC010347. Of the 15 galaxies with radio detections, 3 have Sb or Scd morphology. A fourth, unclassified galaxy is likely to be a spiral or peculiar spiral. The remainder are S0 galaxies apart from the cD, one E/S0 and one unclassified but early-type galaxy. There is no obvious tendency for radio detections to favour a particular Hubble type in this cluster.
Our survey is unusually deep for a radio survey of an Abell cluster, and it detects a relatively large fraction ( %) of the optical cluster members. However, our results are consistent with the known properties of early-type galaxies in the field. Sadler et al. (1989) studied 5 GHz emission from nearby optically selected early type (E/S0) galaxies. They found that 20–30% of their sample (with optical luminosities similar to those probed here) show radio emission with luminosities similar to those of the sources in the present sample.
Sadler et al. (1989) (hereafter SJK) find that the probability distribution of radio luminosity is roughly uniform across the range of luminosities found in our study ( – W Hz-1), with some tendency for a smaller fraction at higher luminosities. This is also consistent with our study, as is demonstrated in Figure 3 comparing the fractional bivariate luminosity function (FBLF) of SJK with that of the present sample. The FBLF estimates the distribution of radio luminosities () for galaxies in a given optical magnitude () range. The construction of the FBLF for the cluster sample used 31 cluster galaxies which fall in the luminosity ranges of Figure 3 (with radio detections or upper limits from the PDS and magnitudes from the COSMOS database, Drinkwater et al. 1995; Yentis et al. 1992). To improve the statistics of this calculation, the galaxies with 1.4 GHz upper limits were distributed uniformly throughout the bins they could possibly occupy, rather than using a more sophisticated maximum-likelihood method (e.g., Avni et al., 1980). This simple approach still gives consistent results, however, with the the method described by Avni et al. (1980), where there are sufficient cluster detections for its use.
There is good agreement between the samples in the two brighter magnitude bins where the range of radio luminosities overlaps, and the apparent excess for the cluster sample in the fainter bin is still consistent with the data of SJK. Although no morphological distinction was made when compiling the cluster sample for this analysis, differences resulting from the inclusion of late-type cluster galaxies are small given that the cluster is dominated by early-type galaxies. Within the statistical uncertainty of our small sample, our cluster results are consistent with the results of SJK.
The different distribution of Hubble-type between cluster and field environments has long been known (e.g., Dressler, 1980a) and this does influence the statistics of our cluster sample compared with the field. According to Condon (1989), for example, the space density of star-forming field galaxies with – W Hz-1 is at least an order of magnitude larger than that of early-type (AGN) galaxies. However, the galaxy population in A2877, like other nearby clusters, is dominated by early types. The absence of a statistically significant difference between our cluster sample and the SJK early-type galaxy sample suggests that at least in A2877 the power of the radio sources are not influenced by the cluster.
The few late-type galaxies positively classified in A2877 and detected in the radio appear to have properties (such as FIR emission) analogous to comparable field galaxies. For these objects it has been possible to estimate star formation rates from the 1.4 GHz and H luminosities. The estimates of H luminosity derived from EW measurements predict SFRs higher than the radio, and those from flux calibrated spectra systematically lower. This may be the result of two effects. First, the EW measurements yield an H luminosity based on the R-band luminosity for the whole galaxy, which may well overestimate the true value in low SFR galaxies (c.f. Cram et al., 1998, their Figure 1). Second, the flux calibrated spectra are sampling only a small portion of these galaxies, and not necessarily the region containing current star formation. The presence of any extinction would serve to lower these luminosities even further. Hence it is unsurprising that the SFRs implied from these luminosities are significantly lower than that deduced from the radio (and the FIR). These results are not inconsistent with the large scatter revealed by Cram et al. (1998), although the systematic underestimates are uncharacteristic of the trend they observe at low star formation rates.
5 Conclusion
We have detected 1.4 GHz emission from 15 galaxies confirmed as members of the cluster A2877. For 2 of these, the radio emission is likely to be due to star formation processes, with star formation rates of 1.3 and yr-1. One source (PDF J010946.5454657) is probably a Seyfert 2, and in a further 5 galaxies both AGN and star formation processes may be contributing to the detected radio emission. Of the remaining 7 galaxies, 6 show only absorption features in their spectra, typical of evolved stellar populations, and one has no spectrum available.
Our deep survey has allowed us to probe radio luminosities at the distance of the cluster to the same depth as that reached by Sadler et al. (1989) in the field, albeit with far fewer numbers in our sample. The fraction and luminosity distribution of radio sources in the early-type galaxies in A2877 is indistinguishable from the properties of field galaxies of the same type. We do, however, find two examples in which the presence of companions might play a role in the radio emission. Whether this is a special characteristic of the cluster environment, however, we cannot say.
None of the radio-detected galaxies in the cluster show evidence for strong morphological distortion. Interactions between galaxies and detectable dwarf companions do not appear to be necessary to excite radio emission, although in specific cases such interactions may still occur, with PDF J011047.2454701 being one potential example.
Appendix A Abell 2877
Abell 2877 was catalogued by Dressler (1980b) as DC010746. It is the richer half of a pair of clusters, DC010746 and DC010347 (see also Caldwell & Rose, 1997). Other names for the cluster include AM 0107-461, SCL 018 NED05, APM 010740.1-461028 (Dalton et al., 1994), and EXSS 0107.6-4610. A2877 is Abell-type R (regular). It has a prominent central cD galaxy and thus is Bautz-Morgan type I (Bautz & Morgan, 1970). The cluster lies at a redshift of (distance class 2), and is “poor”, having a richness class R=0 (Abell et al., 1989). A2877 shows evidence of substructure (Malumuth et al., 1992; Girardi et al., 1997), as do about a third of galaxy clusters (Girardi et al., 1997). The cluster is an X-ray source with a temperature of keV (David et al., 1993); it shows no evidence for a cooling flow (e.g., White et al., 1997). Girardi et al. (1998) estimate a virial radius of Mpc, a velocity dispersion of kms-1, and a corrected virial mass of .
References
- Abell et al. (1989) Abell, G. O., Corwin, H. G. Jr, Olowin, R. P. 1989, ApJS, 70, 1
- Andersen & Owen (1995) Andersen, V., Owen, F. N. 1995, AJ, 109, 1582
- Avni et al. (1980) Avni, Y., Soltan, A., Tananbaum, H., Zamorani, G. 1980, ApJ, 238, 800
- Bautz & Morgan (1970) Bautz, L. P., Morgan, W. W. 1970, ApJ, 162, L149
- Benn et al. (1993) Benn, C. R., Rowan-Robinson, M., McMahon, R. G., Broadhurst, T. J., Lawrence, A. 1993, MNRAS, 263, 98
- Caldwell & Rose (1997) Caldwell, N., Rose, J. A. 1997, AJ, 113, 492
- Condon (1989) Condon, J. J. 1989, ApJ, 338, 13
- Cram et al. (1998) Cram, L., Hopkins, A., Mobasher, B., Rowan-Robinson, M. 1998, ApJ, 507, 155
- Dalton et al. (1994) Dalton, G. B., Efstathiou, G., Maddox, S. J., Sutherland, W. J. 1994, MNRAS, 269, 151
- David et al. (1993) David, L. P., Slyz, A., Jones, C., Forman, W., Vrtilek, S. D., Arnaud, K. A. 1993, ApJ, 412, 479
- Dressler (1980a) Dressler, A. 1980a, ApJ, 236, 351
- Dressler (1980b) Dressler, A. 1980b, ApJS, 42, 565
- Drinkwater et al. (1995) Drinkwater, M. J., Barnes, D. G., Ellison, S. L. 1995, PASA, 12, 248
- Georgakakis et al. (1999) Georgakakis, A., Mobasher, B., Cram, L., Hopkins, A., Lidman, C., Rowan-Robinson, M. 1999, MNRAS, 306, 708
- Gooch (1995) Gooch, R. E. 1995, “Karma: a Visualisation Test-Bed”, in Astronomical Data Analysis Software and Systems V, ASP Conf. Series vol. 101, ed. G.H. Jacoby & J. Barnes, ASP, San Francisco, p.80-83, ISSN 1080-7926
- Girardi et al. (1997) Girardi, M., Escalera, E., Fadda, D., Giuricin, G., Mardirossian, F., Mezzetti, M. 1997, ApJ, 482, 41
- Girardi et al. (1998) Girardi, M., Giuricin, G., Mardirossian, F., Mezzetti, M., Boschin, W. 1998, ApJ, 505, 74
- Hammer et al. (1995) Hammer, F., Crampton, D., Lilly, S. J., Le Fèvre, O., Kenet, T. 1995, MNRAS, 276, 1085
- Heckman (1980) Heckman, T. M. 1980, A&A, 87, 152
- Herbig et al. (1995) Herbig, T., Lawrence, C. R., Readhead, A. C. S., Gulkis, S. 1995, ApJ, 449, L5
- Hopkins et al. (1998) Hopkins, A. M., Mobasher, B., Cram, L., Rowan-Robinson, M. 1998, MNRAS, 296, 839
- Hopkins et al. (1999) Hopkins, A., Afonso, J., Cram, L., Mobasher, B. 1999, ApJ, 519, L59
- Jarvis & Tyson (1981) Jarvis, J. F., Tyson, J. A. 1981, AJ, 86, 476
- Lauberts & Valentijn (1989) Lauberts, A., Valentijn, E. A. 1989, “The surface photometry catalogue of the ESO-Uppsala galaxies”
- Ledlow & Owen (1995) Ledlow, M. J., Owen, F. N. 1995, AJ, 109, 853
- Malumuth et al. (1992) Malumuth, E. M., Kriss, G. A., Van Dyke, D. W., Ferguson, H. C., Ritchie, C. 1992, AJ, 104, 495
- Moffet & Birkinshaw (1989) Moffet, A. T., Birkinshaw, M. 1989, AJ, 98, 1148
- Myers et al. (1997) Myers, S. T., Baker, J. E., Readhead, A. C. S., Leitch, E. M., Herbig, T. 1997, ApJ, 485, 1
- Robertson & Roach (1990) Robertson, J. G., Roach, G. J. 1990, MNRAS, 247, 387
- Sadler et al. (1989) Sadler, E. M., Jenkins, C. R., Kotanyi, C. G. 1989, MNRAS, 240, 591
- Smail et al. (1999) Smail, I., Morrison, G., Gray, M. E., Owen, F. N., Ivison, R. J., Kneib, J.-P., Ellis, R. S. 1999, astro-ph/9905354
- Smith et al. (1998) Smith, H. E., Lonsdale, C. J., Lonsdale, C. J., Diamond, P. J. 1998, ApJ, 493, L17
- Stocke et al. (1999) Stocke, J. T., Perlman, E. S., Gioia, I. M., Harvanek, M. 1999, AJ, 117, 1967
- Thuan & Condon (1987) Thuan, T. X., Condon, J. J. 1987, ApJ, 322, L9
- Veilleux & Osterbrock (1987) Veilleux, S., Osterbrock, D. E. 1987, ApJS, 63, 295
- Weiler et al. (1990) Weiler, K. W., Panagia, N., Sramek R. A. 1990, ApJ, 364, 611
- White et al. (1997) White, D. A., Jones, C., Forman W. 1997, MNRAS, 292, 419
- Windhorst et al. (1994) Windhorst, R. A., Gordon, J. M., Pascarelle, S. M., Schmidtke, P. C., Keel, W. C., Burkey, J. M., Dunlop, J. S. 1994, ApJ, 435, 577
- Windhorst et al. (1985) Windhorst, R. A., Miley, G. K., Owen, F. N., Kron, R. G., Koo, D. C. 1985, ApJ, 289, 494
- Yentis et al. (1992) Yentis, D. J., Cruddace, R. G., Gursky, H., Stuart, B. V., Wallin, J. F., MacGillivray, H. T., Collins, C. A. 1992, in “Digitised Optical Sky Surveys”, ed. H. T. MacGillivray & E. B. Thomson, (Kluwer:Dordrecht), 67
- Zhao et al. (1989) Zhao, J., Burns, J. O., Owen, F. N. 1989, AJ, 98, 64
| Name | Hubble | ||||||
|---|---|---|---|---|---|---|---|
| (mJy) | type | (W Hz-1) | (W) | ||||
| PDF J010837.1454819 | 0.61 | 15.85 | S0aaAll the morphological types are from Dressler (1980b) apart from these two, which have been taken from Caldwell & Rose (1997). | 0.027 | 20.94 | 19.33 | 33.49bbThese H luminosities were derived indirectly from EWs (Georgakakis et al., 1999). |
| PDF J010904.5454624 | 5.00 | 12.45 | E/S0 | 0.026 | 21.82 | 22.65 | |
| PDF J010937.8455350 | 0.11 | 13.91 | S0 | 0.022 | 20.01 | 20.83 | |
| PDF J010946.5454657 | 1.12 | 14.47 | S0 | 0.020 | 20.94 | 20.05 | 32.81 |
| PDF J010947.9455125 | 0.35 | 14.96 | S0 | 0.020 | 20.43 | 19.56 | 33.27bbThese H luminosities were derived indirectly from EWs (Georgakakis et al., 1999). |
| PDF J010955.5455552 | 1.59 | 11.09ccThese are Cousins magnitudes measured by Lauberts & Valentijn (1989). | D | 0.024 | 21.25 | 23.83 | |
| PDF J011018.0455556 | 0.20 | 15.18 | S0aaAll the morphological types are from Dressler (1980b) apart from these two, which have been taken from Caldwell & Rose (1997). | 0.028 | 20.49 | 20.08 | |
| PDF J011019.4455113 | 14.3 | 14.23 | S0 | 0.024 | 22.20 | 20.69 | |
| PDF J011027.6460428 | 0.18 | 13.52 | S0 | 0.023 | 20.27 | 21.31 | |
| PDF J011029.4461027 | 4.69 | 14.30 | Sb(p) | 0.024 | 21.72 | 20.63 | 33.10 |
| PDF J011047.2454701 | 0.10 | 14.62 | S0 | 0.025 | 20.09 | 20.40 | |
| PDF J011055.8453920 | 0.28 | 15.74 | 0.024 | 20.50 | 19.18 | 33.62bbThese H luminosities were derived indirectly from EWs (Georgakakis et al., 1999). | |
| PDF J011119.1455554 | 6.65 | 12.80ccThese are Cousins magnitudes measured by Lauberts & Valentijn (1989). | Sb | 0.022 | 21.80 | 21.93 | 32.12 |
| PDF J011153.5455847 | 0.14 | 16.69 | 0.025 | 20.24 | 18.33 | 33.19bbThese H luminosities were derived indirectly from EWs (Georgakakis et al., 1999). | |
| PDF J011219.3455322 | 0.87 | 15.28 | Scd | 0.027 | 21.09 | 19.90 | 32.92 |