The Deuterium Abundance in QSO Absorption Systems : A Mesoturbulent Approach111Based on data obtained at the W. M. Keck Observatory, which is jointly operated by the University of California, the California Institute of Technology, and the National Aeronautics and Space Administration.
Abstract
A new method, based on simulated annealing technique and aimed at the inverse problem in the analysis of intergalactic or interstellar complex spectra of hydrogen and metal lines, is outlined. We consider the process of line formation in clumpy stochastic media accounting for fluctuating velocity and density fields self-consistently. Two examples of the analysis of ‘H+D’-like absorptions seen at and 3.378 towards APM 08279+5255 are presented.
Department of Theoretical Astrophysics, Ioffe Physico-Technical Institute, 194021 St. Petersburg, Russia
1. Introduction
The cosmological significance of the deuterium abundance measurements in metal-deficient QSO absorption systems has been widely discussed in the literature (see e.g. the review by Lemoine et al. 1999). Practical applications of such measurements were clearly outlined in Tytler & Burles (1997) : (i) the primordial D/H value gives the density of baryons at the time of big bang nucleosynthesis (BBN), a precise value for might be used (ii) to determine the fraction of baryons which are missing, (iii) to specify Galactic chemical evolution, and (iv) to test models of high energy physics. A measurement of the D/H ratio, together with other three light element abundances (3He/H, 4He/H, and 7Li/H), provides the complete test of the standard BBN model.
Deuterium has been reported up-to-now in a few QSO Lyman limit systems (LLS), – the systems with the neutral hydrogen column densities of cm-2 (Kirkman et al. 1999). The difficulties inherent to measurements of D/H in QSO spectra are mainly caused by the confusion between the D i line (which is always partially blended by the blue wing of the saturated hydrogen line) and the numerous neighboring weak lines of H i observed in the Ly forest at redshifts (Burles & Tytler 1998).
Currently, there are two methods to analyse the absorption spectra : (i) a conventional Voigt-profile fitting (VPF) procedure which usually assumes several subcomponents with their own physical parameters to describe a complex absorption profile, and (ii) a mesoturbulent approach which describes the line formation process in a continuous medium with fluctuating physical characteristics. It is hard to favor this or that method if both of them provide good fitting. But the observed increasing complexity of the line profiles with increasing spectral resolution gives some preference to the model of the fluctuating continuous medium.
Here, we set forward a mesoturbulent approach to measure D/H and metal abundances, which has many advantages over the standard VPF procedures. A brief description of a new Monte Carlo inversion (MCI) method is given in this report. For more details, the reader is referred to Levshakov, Agafonova, & Kegel (2000b).
An example of the MCI analysis of two ‘H+D’-like profiles with accompanying metal lines observed at and 3.378 towards the quasar APM 08279+5255 is described. The high quality spectral data have been obtained with the Keck-I telescope and the HIRES spectrograph by Ellison et al. (1999).
2. The MCI method and results
The MCI method is based on simulated annealing technique and aimed at the evaluation both the physical parameters of the gas cloud and the corresponding velocity and density distributions along the line of sight. We consider the line formation process in clumpy stochastic media with fluctuating velocity and density fields (mesoturbulence). The new approach generalizes our previous Reverse Monte Carlo (Levshakov, Kegel, & Takahara 1999) and Entropy-Regularized Minimization (Levshakov, Takahara, & Agafonova 1999) methods dealing with incompressible turbulence (i.e. the case of random bulk motions with homogeneous gas density and kinetic temperature ).
The main goal is to solve the inverse problem, i.e. the problem to deduce physical parameters from a QSO absorption system. The inversion is always an optimization problem in which an objective function is minimized. To estimate a goodness of the minimization we used a function augmented by a regularization term (a penalty function) to stabilize the MCI solutions. The MCI is a stochastic optimization procedure and one does not know in advance if the global minimum of the objective function is reached in a single run. Therefore to check the convergency, several runs are executed for a given data set with every calculation starting from a random point in the simulation parameter box and from completely random configurations of the velocity and density fields. After these runs, the median estimation of the model parameters is performed.
Our model supposes a continuous absorbing gas slab of a thickness . The velocity component along a given line of sight is described by a random function in which the velocities in neighboring volume elements are correlated with each other. The gas is optically thin in the Lyman continuum. We are considering a compressible gas, i.e. is also a random function of the space coordinate, . Following Donahue & Shull (1991) and assuming that the ionizing radiation field is constant, the ionization of different elements can be described by one parameter only – the ionization parameter . Furthermore, for gas in thermal equilibrium, Donahue & Shull give an explicit relation between and . The background ionizing spectrum is taken from Mathews & Ferland (1987).
In our computations, the continuous random functions and the normalized density , being the mean hydrogen density, are represented by their sampled values at equally spaced intervals , i.e. by the vectors {} and {} with large enough to describe the narrowest components of complex spectral lines. For the ionization parameter as a function of , we have , with being the reduced mean ionization parameter defined below.
Absorption system at . A measurement of the primordial D/H in the system has been recently made by Molaro et al. (1999). They suggested that the blue wing of H i Ly is contaminated by D i and evaluated a very low deuterium abundance of D/H in the cloud with cm-2. They considered, however, the derived D abundance as a lower limit because their analysis was based on a simplified one-component VPF model which failed to fit the red wing of the Ly line as well as the profiles of Si iii, Si iv, and C iv lines exhibiting complex structures over approximately 100 km s-1 velocity range. They further assumed that additional components would decrease the H i column density for the major component and, thus, would yield a higher deuterium abundance. Given the MCI method, we can test this assumption since the MCI accounts self-consistently for the velocity and density fluctuations.
Our aim is to fit the model spectra simultaneously to the observed H i, C ii, C iv, Si iii, and Si iv profiles. In this case the mesoturbulent model requires the definition of a simulation box for the six parameters : the carbon and silicon abundances, and , respectively, the rms velocity and density dispersion , the reduced total hydrogen column density , and the reduced mean ionization parameter . For the model parameters the following boundaries were adopted : ranges from to , from to , from 25 to 80 km s-1, from 0.5 to 2.2, from to cm-2, and ranges from to . We fix (the value adopted by Molaro et al.) as a more or less arbitrary reference velocity at which .
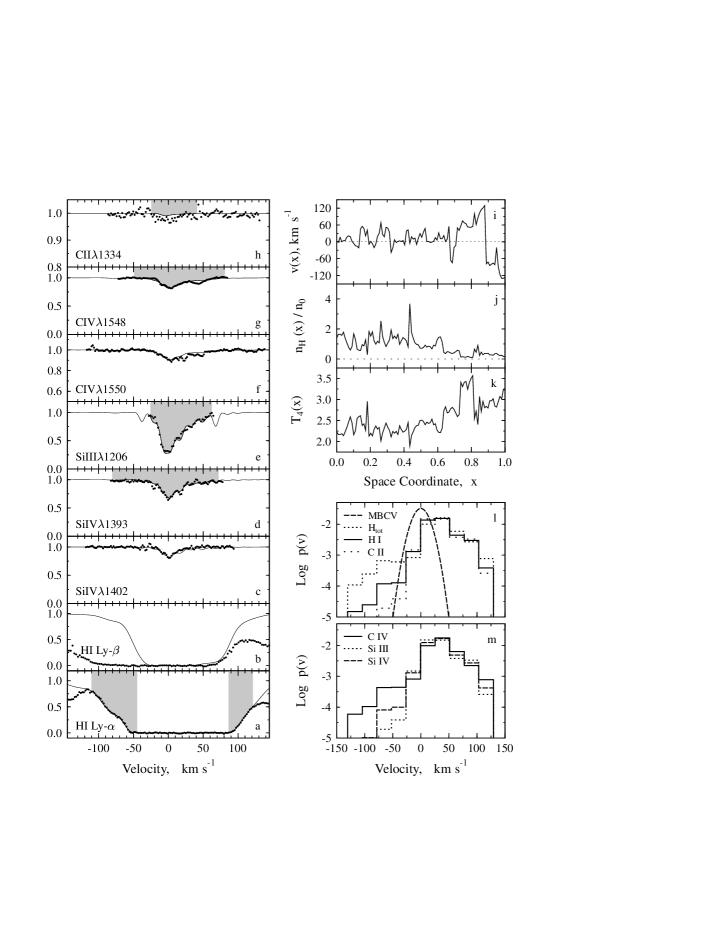
Having specified the parameter space, we minimize the value. The objective function includes those pixels which are critical to the fit. In Fig. 1, these pixels are marked by shaded areas. In Fig. 1 (panels f and c), the observed profiles of C iv and, respectively, Si iv are shown together with the model spectra computed with the parameters derived from Ly, C ii, C iv, Si iii, and Si iv fitting to illustrate the consistency. For the same reason the Ly model spectrum is shown in panel b at the expected position. All model spectra in Fig. 1 are drawn by continuous curves, whereas filled circles represent observations (normalized fluxes). The corresponding distributions of , , and are shown in panels i, j, and k. The restored velocity field reveals a complex structure which is manifested in non-Gaussian density-weighted velocity distribution as shown in panels l and m for the total hydrogen as well as for the individual ions. We found that the radial velocity distribution of H i in the vicinity of km s-1 may mimic the deuterium absorption and, thus, the asymmetric blue wing of the hydrogen Ly absorption may be readily explained by H i alone.
The median estimation of the model parameters gives cm-2, cm-2, , km s-1, and . The results were obtained with and the correlation coefficients (for more details, see Levshakov, Agafonova, & Kegel 2000a).
The MCI allowed us to fit precisely not only the blue wing of the saturated Ly line but the red one as well. We found that the actual neutral hydrogen column density may be a factor of 250 lower than the value obtained by Molaro et al. if one accounts for the velocity field structure. Besides we did not confirm the extremely low metallicity of [C/H] , and [Si/H] reported by Molaro et al. Our analysis yields [C/H] , and [Si/H] . A similar silicon overabundance has also been observed in halo (population II) stars (Henry & Worthey 1999).
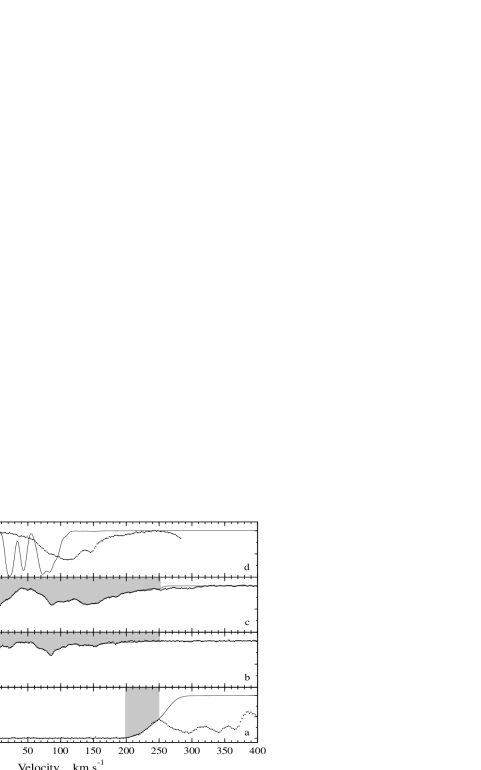
Absorption system at . The following example illustrates how the realibility of the inversion procedure can be controlled. We have chosen the system since at the position of the narrowest C iv subcomponent with and km s-1 (see Ellison et al.) one can see an ‘H+D’-like absorption in the blue wing of the saturated Ly line (Fig. 2a). The C iv, and Si iv profiles from this system were treated by Ellison et al. separately. They found cm-2 and cm-2. For the neutral hydrogen, they estimated cm-2 and km s-1 (errors for both quantities are greater than 30%).
In this example, we assumed no deuterium absorption and tried to force a common fit to the lines shown in panels a–c (Fig. 2). Pixels used in the fitting are labeled by shaded areas. The MCI fit, shown by solid curves, looks excellent, and gives cm-2, cm-2, cm-2, km s-1, and . The results were obtained with and the correlation coefficients .
The obtained MCI solution should, however, be rejected because the synthetic spectrum of C ii (solid curve in Fig. 2d), computed with the parameters derived from the Ly, C iv, and Si iv fitting, differs significantly from the observed intensities (dots in Fig. 2d). This example shows that we can always control the MCI results using additional portions of the analysed spectrum.
Another issue of this example is that we can, in principle, fit an ‘H+D’-like absorption by H i alone even for the systems with cm-2 and accompanying metal lines. Examples of false deuterium identifications in systems with 10 times lower neutral hydrogen column densities and without supporting metal lines have been discussed in Tytler & Burles. Both cases stress the importance of the comprehensive approach to the analysis of each individual QSO system showing possible D absorption.
We may conclude that up-to-now deuterium was detected in only four QSO spectra (Q 1937-1009, Q 1009+2956, Q 0130-4021, and Q 1718+4807) where was measured with a sufficiently high accuracy. These measurements are in concordance with .
Acknowledgements. This paper includes results obtained in collaboration with I. I. Agafonova and W. H. Kegel. The author is grateful to Ellison et al. for making their data available. I would also like to thank the conference organizers for financial assistance.
References
Burles, S., & Tytler, D. 1998, in Primordial Nuclei and Their Galactic Evolution, ed. N. Prantzos, M. Tosi & R. von Steiger (Dordrecht : Kluwer Academic Publishes), 65
Donahue, M., & Shull, J. M. 1991, ApJ, 383, 511
Ellison, S. L., Lewis, G. F., Pettini, M., Sargent, W. L. W., Chaffee, F. H., Foltz, C. B., Rauch, M., & Irwin, M. J. 1999, PASP, 111, 919
Henry, R. B. C., & Worthey, G. 1999, PASP, 111, 919
Kirkman, D., Tytler, D., Burles, S., Lubin, D., & O’Meara, J. M. 1999, AAS, 194, 3001 (astro-ph/9907128)
Lemoine, M., Audouze, J., Jaffel, L. B., Feldman, P., Ferlet, R., Hébrard, G., Jenkins, E. B., Mallouris, C., Moos, W., Sembach, K., Sonneborn, G., Vidal-Madjar, A., & York, D. C. 1999, New Astronomy, 4, 231
Levshakov, S. A., Kegel, W. H., & Takahara, F. 1999, MNRAS, 302, 707
Levshakov, S. A., Takahara, F., & Agafonova, I. I. 1999, ApJ, 517, 609
Levshakov, S. A., Agafonova, I. I., & Kegel, W. H. 2000a, A&A, in press
Levshakov, S. A., Agafonova, I. I., & Kegel, W. H. 2000b, A&A., submit.
Mathews, W. D., & Ferland, G. 1987, ApJ, 323, 456
Molaro, P., Bonifacio, P., Centurion, M., & Vladilo, G. 1999, A&A, 349, L13
Tytler, D., & Burles, S. 1997, in Origin of Matter and Evolution of Galaxies, ed. T. Kajino, Y. Yoshii & S. Kubono (Singapore : World Scientific), 37