Properties of disk galaxies in a hierarchical formation scenario
Abstract
We used galaxy evolutionary models in a hierarchical inside-out disk formation scenario to study the origin of the main local and global properties of disk galaxies as well as some of the correlations between their global properties. We found that most of disk galaxy properties and their correlations are the result of three (cosmological) initial factors of the system and their dispersions: the virial mass, the halo mass aggregation history (MAH), and the angular momentum given through the spin parameter . The MAH determines mainly the dark halo structure and the integral color indexes while determines mainly the disk surface brightness and the bulge-to-disk ratio. We calculated star formation using a gravitational instability criterion and a self-regulation mechanism driven by the energy balance in the disk turbulent interstellar medium. The efficiency of star formation in this model is almost independent from the mass of the system. Therefore, the galaxy integral color index or the stellar mass-to-luminosity ratio, , do not depend upon mass. We show that the luminosity-dependent dust absorption empirically determined by Wang & Heckman explains the observed color-magnitude and color Tully-Fisher (TF) relations without the necessity of introducing a mass-dependent star formation efficiency. The star formation history in our models is driven by both the MAH and the surface density (). The disks in centrifugal equilibrium form within growing cold dark matter halos with a gas accretion rate proportional to the halo MAH. The disks present exponential surface density and brightness profiles, negative radial color index gradients, and nearly flat rotation curves. We also calculated the secular formation of a bulge due to gravitational instabilities in the stellar disk. The intensive properties of our models agree very well with the observational data and they follow the same trends galaxies follow across the Hubble sequence. The infrared TF relations and the luminosity-radius relation predicted for the cosmological model used here also agree with the observational data. The main shortcomings of the inside-out hierarchical formation models presented in this paper are the excessive radial color gradients and the dark halo dominion in the rotation curve decompositions.
keywords:
galaxies: evolution — galaxies: formation — galaxies: disk — galaxies: fundamental parameters — cosmology: theory —dark matterOctober 14, 1999
1 Introduction
The study of galaxy formation and evolution may be approached in a deductive or in an inductive way (e.g., Renzini 1994). In the former case, starting from some ab-initio conditions given by a theory of cosmic structure formation, one tries to model the galaxy evolution in order to predict the observable properties of the galaxies. In the latter case, starting from the present-day properties of galaxies, and through galaxy evolutionary models, one tries to reconstruct the initial conditions of galaxy formation. In this paper we introduce models of disk galaxy formation and evolution based on both approaches.
Deductive approach. Most of current models about cosmic structure formation are based on the gravitational paradigm and the inflationary cold dark matter (CDM) cosmology. In these models, cosmic structures build up hierarchically by a continuous mass aggregation process. From the point of view of galaxy cosmogony, a key question is whether this aggregation occurs through violent mergers of collapsed substructures or through a gentle process of mass accretion. According to this, two could be the most general scenarios of large-galaxy formation. (i) In one case, the main properties of luminous galaxies, including those which define their morphological types, are supposed to be basically result of a given sequence of mergers. This picture —that we shall call the merger scenario— has been widely applied in semianalytical models of galaxy formation, where the global properties of galaxies are calculated from the cosmological dark matter (DM) halo merging histories using preconceived recipes for the gas cooling, disk mergers, star formation (SF), supernova (SN) feedback, etc. (e.g., Lacey et al. 1993; Kauffmann, White, & Guiderdoni 1993; Cole et al. 1994; Heyl et al. 1995; Kauffmann 1995; 1996; Baugh, Cole, & Frenk 1996; Baugh et al. 1997; Somerville & Primack 1999). (ii) In the other case, the formation and evolution of galaxies is related to a gentle and coherent process of mass aggregation dictated by the shapes of the density profiles of the primordial fluctuations: galaxies coherently grow inside-out. We shall call this picture —firstly developed by Gunn (1981, 1987) and by Ryden & Gunn (1987)— the extended collapse scenario. Since disk galaxies ( of present-day normal galaxies) could not have suffered major mergers due to the dynamical fragility of the disks (Tóth & Ostriker 1992; Weinberg 1998), the extended collapse scenario appears to be more appropriate to study their evolution.
The question of whether the major mergers dominate or not in the assembly of protogalaxies depends on the statistical properties of the density fluctuation field. However, even if the DM structures assemble through chaotic and violent mergers of substructures, the baryon gas tends to aggregate and collapse in a more (spatially) uniform fashion than DM do it (e.g., Kepner 1997). On the other hand, the reionization of the universe probably heated the gas at high redshifts to temperatures enough to prevent further its collapse within the small DM substructures of the hierarchy (e.g., Blanchard, Valls-Gabaud, & Mamon 1992; Prunet & Blanchard 1999). This way, large galaxies could have formed smoothly with the gas trapped into the potential wells of their surrounding DM halos, avoiding an assembly through the merging of baryon substructures. Only in high density regions of the universe, as in clusters of galaxies, luminous galaxies could have efficiently interacted among each other, thickening and disrupting their disks and probably forming lenticular and elliptical systems. Disk galaxies indeed typically are isolated objects. On the other hand, the interpretation of high velocity clouds as build-blocks of the formation of galaxies in the Local Group (Blitz et al. 1999) is one possible observational evidence for the extended collapse scenario: these clouds might constitute large reservoirs of cold gas which is smoothly accreted onto the galaxies (López-Corredoira, Beckman, & Casuso 1999).
Inductive approach. Galaxy evolutionary models have shown that due to the relatively rapid disk gas consumption in SF, closed models are not able to explain several properties of disk galaxies, as well as the wide range of colors, gas fractions, etc. that galaxies present across the Hubble sequence (e.g., Larson & Tinsley 1978; Tinsley 1980; Larson, Tinsley, & Caldwell 1980; Kennicutt 1983; Gallagher, Hunter, & Tutukov 1984; Firmani & Tutukov 1992, 1994). On the other hand, it was shown that the SF time scale in disk galaxies is not mainly controlled by the initial gas surface density (Kennicutt 1983; Firmani & Tutukov 1994; Kennicutt, Tamblyn, & Congdon 1994). Hence, models where accretion of fresh gas is introduced are more realistic. What is more, in order to reproduce the radial abundance gradient of the Galaxy, the gas accretion should be such as an inside-out disk formation scenario (e.g., Portinari & Chiosi 1999, and more references therein). Gas accretion might also be necessary to maintain spiral structures. In the case of open (infall) models, galaxy formation and evolution could be two related processes where the SF time scale is mainly driven by the gas accretion rate at which the disk is being built up.
Gas infall and SF. The gas infall rate onto the disks may be controlled by the global process of galaxy formation (cosmological accretion) and/or by a self-regulated process of SF. This latter process, proposed in the seminal papers by White & Rees (1978) and White & Frenk (1991), is commonly applied in the merger scenario models. According to this mechanism, the gas accretion rate is driven by the cooling of the hot gas corona sustained by the SN-injected energy. However, the self-regulated disk-halo SF models suffer from some inconsistencies. As Nulsen & Fabian (1996) pointed out, SN feedback over large scales occurs on roughly the same time scales as the SF, not fast enough to tightly regulate the SF rate. On the other hand, because the disk turbulent interstellar medium is a very dissipative system (Avila-Reese & Vázquez-Semadeni 2000), gas and energy outflows tend to be confined into a region close to the disk. The thick gaseous disk and the global magnetic fields are efficient shields that prevent any feedback toward the halo on large scales (e.g., Mac Low, McCray, & Norman 1989; Slavin & Cox 1992; Franco et al. 1995). The lack of observational evidence for significant amounts of hot gas in the halos of disk galaxies confirms this picture and suggests that the halo-disk connection is not enough to self-regulate and drive the disk SF at the halo scales.
An unified scenario of galaxy formation. The galaxy infall models suggested by the inductive approach can in a natural fashion be incorporated into the cosmological (deductive) extended collapse scenario. In Avila-Reese, Firmani, & Hernández (1998, hereafter AFH98), starting from the cosmological settings, the formation and evolution of galaxy DM halos were calculated through a simplified approach whose results are in good agreement with those of the cosmological N-body simulations (see also Avila-Reese et al. 1999). In Firmani & Avila-Reese (2000a, hereafter FA), the formation and evolution of baryon disks within the growing halos produced with this approach was calculated in order to study the structural and dynamical properties of disk galaxies. Here, we apply a similar method including bulge formation, with the aim to explore whether the origin of the main properties of disk galaxies and their correlations (the Hubble sequence, for example) can be related or not to cosmological initial conditions and factors. In an acompanying paper (Firmani & Avila-Reese 2000b) results about the evolution of the model galaxies will be presented and compared with the observational data.
In the extended collapse scenario we develop here, the relevant assumptions we introduce are: (1) spherical symmetry and adiabatic invariance in the gravitational collapse of DM halos, (2) spin parameter produced by cosmological torques and constant in time for a given halo, (3) gentle incorporation of the gas (no mergers) into a disk in centrifugal equilibrium, (4) detailed angular momentum conservation and adiabatic invariance during the gas collapse, (5) stationary SF induced by global disk gravitational instabilities and regulated by an energy balance within the disk interstellar medium, and (6) formation of a bulge due to gravitational instabilities in the stellar disk (secular formation scenario).
A consequence of item (5) is that in our models the SF efficiency is almost independent from the galaxy mass or circular velocity. An important question is whether the observed “color” Tully-Fisher or color-magnitude relations can be explained without invoking SF efficiency and/or disk-to-total mass ratios depending upon mass (luminosity). We propose that the observed luminosity-dependent dust absorption (e.g., Wang & Heckman 1996) explain these empirical relations.
In the last years, several methods to model galaxy formation and evolution were proposed: the numerical simulations (N-body+hydrodynamics), the semianalytical method, and the analytical method. We have called our method seminumerical, essentially with the aim to differentiate it from the other ones. In fact, the virialization of the halos is calculated with an itterative procedure and the disk formation and evolution is followed by solving the hydrodynamical equations (in the radial direction) with a full numerical method. As in the numerical simulations, with the seminumerical method, we try to model the evolution of the internal structural, dynamical, kinematical and SF processes of an individual galaxy (dark+luminous). On the other hand, we are also interested in calculating statistical properties of a whole population of galaxies. The techniques used in semianalytical and analytical methods have proved to be especially powerful in this undertaking. In our method we use some related techniques. It is important to mention that, from the physical point of view, our seminumerical method and the analytical method are similar: both are based on the extended collapse scenario. The results obtained with the analytical method in recent papers (Dalcanton, Spergel, & Summers 1997; Mo, Mao, & White 1998; van den Bosch 1998, 1999) encourage us to study in more detail this scenario, following the overall process of formation and evolution of individual disk galaxies (dark+luminous).
The plan of the paper is as follows: in 2 we describe our method and explain the strategy in order to calculate the galaxy models; in 3 and 4 we present the local and global properties of the model galaxies at , respectively, and compare them with the observational data; in 5 we study some important correlations among the global properties of the models, particularly those which go across the Huble sequence, and we explore whether the “color” Tully-Fisher and color-magnitude relations can be explained by the luminosity-dependent dust absortpion; the fundamental factors of the galaxy models and the way they determine the galaxy properties are presented in 6; we discuss the main difficulties found in the extended collapse scenario in 7, and finally, in 8, we summarize the paper and present the conclusions.
2 The method
Following, we briefly describe the seminumerical method used to calculate the formation and evolution of isolated disk galaxies in the extended collapse scenario based on the hierarchical formation picture. Most of the steps of this method were already described in previous works (Firmani et al. 1996; Avila-Reese 1998; AFH98; FA).
Virialization of the DM halos. The first step in our model is to calculate the gravitational collapse and virialization of isolated DM halos starting from a primordial density fluctuation field. This was done in AFH98 and in Avila-Reese 1998. In order to generate the hierarchical MAHs of the DM halos we use the extended Press-Schechter approximation based on the conditional probabilities for a Gaussian random field (Bower 1991; Bond et al. 1991; Lacey & Cole 1993). For a given present-day mass , we generate a set of MAHs through Monte Carlo simulations. We follow the aggregation history of the main progenitor by identifying the most massive subunit of the distribution at each time. The gravitational collapse and virialization of the DM halos is calculated with an iterative seminumerical method, assuming spherical symmetry and adiabatic invariance during the collapse. This method is based on the secondary infall model (e.g., Gunn 1977; Zaroubi & Hoffman 1993), and it expands upon it by allowing non-radial motions and arbitrary initial conditions (MAHs in our case).
Not all the mass virializes at . The mass shells that are already virialized roughly correspond to those within the virial radius at which the halo mean overdensity drops below the critical value given by the spherical collapse model. For the cosmological model used here (e.g., Padmanabhan 1993). Analysis of halos identified in numerical simulations confirm this result (Cole & Lacey 1996; Eke, Navarro, & Frenk 1998). The mass contained within is the virial mass which, depending upon the MAH, is equal to 0.7-0.9 times (see also Kull 1999).
The halos calculated with our method present a diversity of density profiles, the most typical being close to that suggested by Navarro, Frenk, & White (1996, 1997) (AFH98). This diversity in the structure of the halos is related to the dispersion in the MAHs. As it was tested for a flat CDM model with cosmological constant, the diverse density profiles obtained with our method agree rather well with the results of cosmological N-body simulations (Avila-Reese et al. 1999).
Disk build-up. Baryon matter is able to cool and further collapse within the virialized DM halo. The collapse can be halted only by centrifugal forces or when gas is transformed into stars. While the second case could be related to the origin of large bulges and elliptical galaxies, the former is commonly invoked to explain the formation of disk galaxies. The build-up of disks within the evolving DM halos is carried out as follows:
(1) We consider that, at the beginning, baryon matter has mass and angular momentum distributions similar to those of the DM; it is assumed that the spherical shells are in solid body rotation.
(2) Once the current mass shell has attained its maximum expansion radius, a fraction of its mass is transferred in a virialization time into a disk in centrifugal equilibrium. This mass fraction is assumed to be only in form of gas. Since for galaxy halos the time scale of gas cooling is generally smaller than the dynamical time scale, the shell virialization time is a reasonable —probably minimum— time scale for gas incorporation into the disk, considering that the gas will be shock-heated during the virialization process. The radial mass distribution of the disk gas is calculated equating its specific angular momentum to the one of its final circular orbit (detailed angular momentum conservation is assumed). The specific angular momentum acquired by each collapsing shell during the linear regime is estimated under the assumption of a constant spin parameter ():
| (1) |
where , and are the total mass, angular momentum and energy of the object at time , respectively. According to analytical studies and to the outcomes of cosmological N-body simulations, the DM halos have values of given by a log normal distribution with an average of 0.05 and a width in the logarithm less than one (e.g., Catelan & Theuns 1996 and references therein).
(3) The gravitational drag on the total system produced by the central disk is calculated at each time with the adiabatic invariant formalism (e.g., Flores et al. 1993).
Disk star formation and hydrodynamics. In our model, the SF and the internal hydrodynamics of the disk are regulated by an energy balance between the SN and gas accretion kinetic energy input, and the turbulent energy gas dissipation (Firmani et al. 1996). Star formation is turned on at radius when the Toomre gravitational instability parameter for the gas disk,
| (2) |
falls below a given threshold (Toomre 1964); is the epicyclic frequency, the gas rms turbulent velocity, and the gas surface density. Thus, the SF is controlled by a feedback mechanism such that, when a gas disk column is overheated by the SF activity, SF is inhibited and the disk column dissipates the excess energy to lower back to the value determined from the Toomre criterion threshold. Owing to several theoretical and observational pieces of evidence (see references in FA) we fix instead of the value of 1 given by Toomre (1964) for an infinitely thin disk. While the SF rate is rather insensitive to , the disk thickness strongly depends upon it. When is used, for a model of the Galaxy we obtain the observed gas and stellar thicknesses. The gas loss from stars is also included. The gravitational dynamics of the evolving star and gas disks, and the DM halo are treated in detail.
The local disk galaxy models presented in Firmani & Tutukov (1994) included the integration of luminosities in and bands for all the stellar population. A Salpeter initial mass function with a minimal star mass of 0.1M⊙, and solar metallicities were used. Here, the results from these models are used to calculate the surface and band brightness at every radius and throughout the evolution of the galaxy models (see Firmani et al. 1996). We find that the approximation to the population synthesis we use provides colors that can be less by mag in the red, and by mag in the blue than the respective values given by more sophisticated models (e.g., Bruzual & Charlot 1993; Charlot, Worthey, & Bressan 1996).
According to our scheme, time by time and at each radius, the growing disk is characterized by the infall rate of fresh gas by unit of area, , the gas and stellar disk surface density profiles, and , the total rotation curve (including the growing DM halo component), , and the SF rate determined by the energy balance in the vertical gaseous disk and by a Toomre criterion. It is important to note that in our self-regulating SF mechanism the feedback happens only within the disk and not at the level of the whole halo. This is justifiable, as was already explained in the Introduction, because the galaxy disks are dense and very dissipative systems that confine gas and energy outflows.
Bulge formation. Recent observational and theoretical studies are challenging common preconceptions about galactic bulges; for a review see Wyse, Gilmore, & Franx (1997). These studies tend to show that several bulge formation mechanisms could be working in galaxies. Bulges in galaxies with low and intermediate bulge-to-disk (b/d) ratios may be formed through secular dynamical evolution of the disks, whereas bulges in galaxies with large b/d ratios could have been formed separately from the disks, through an early dissipative collapse, and/or from mergers.
In order to estimate the bulge mass we have introduced a recipe according to which the stars of the central “cold” disk region where the stellar Toomre instability parameter is less than 1, are transferred to a spherical component in such a way that remains equal to 1; and are the radial stellar velocity dispersion and stellar surface density. The physical sense of this recipe is in agreement with the secular scenario of bulge formation where gravitational instabilities in the stellar disks produce bars which dissolve forming a “hot” component, the bulge (see Norman, Sellwood, & Hasan 1996, and references therein). Indeed, the similarity found in colors (Peletier & Balcells 1996), and scalelengths (de Jong 1996a; Courteau, de Jong, & Broeils 1997) between disk and bulge for late-type galaxies might mean that the disk and the bulge are closely related. It is worth emphasizing that our recipe of bulge formation is a very crude approximation to a complex phenomenon about which, in fact, not much is known, both from the theoretical and observational points of view.
2.1 Selection of the models
The seminumerical method described above allows us to calculate the properties of disk galaxies at any time, particularly at the present-day, starting from the cosmological initial conditions. Since our aim is to study general behaviors, here we shall use only one representative cosmology, the standard CDM model with the following parameters: matter density , baryon fraction density , Hubble parameter kms-1Mpc-1 with , the amplitude of fluctuations on Mpc scale . At galaxy scales, the power spectrum of this model is similar to that of the popular flat CDM model with cosmological constant (, ) normalized to the satellite measurements. We calculate the power spectrum according to Sugiyama (1996). Once the cosmological model is fixed, the galaxy model to be studied should be defined. A given model is characterized by its (dark+baryon) virialized mass 111As it was explained above, we give as initial parameter the nominal mass . Nevertheless, not all this mass is virialized; the most outer mass shells that encompase this mass are still in the process of virialization. We use the virial mass as the current mass of the halo. This mass is approximately , depending on the MAH., its MAH, its initial spin parameter , and by the mass fraction of that is incorporated into the disk. In order to obtain a complete galaxy population, one should calculate models with masses, MAHs, and drawn from the corresponding statistical distributions given by the cosmological framework. A complete modeling of the disk galaxy population, however, is beyond the scope of this paper. Regarding , it is probably the same for all the galaxies, although some astrophysical process could change their initial values (e.g., Natarajan 1999). Here we shall assume constant and equal to 0.05 (see Mo et al. 1998 and FA for some justifications for taking this value). This value is within the range predicted by the theory of light elements production, , as well as by the range given by the global budget of baryons, (Fukugita, Hogan, & Peebles 1998). Note that, taking for the standard CDM model, we are assuming that in the galaxy halos almost all the baryon matter is incorporated into the disk.
The aim of this paper is to explore to what extent the extended collapse scenario is able to provide the correct initial conditions for galaxy evolutionary models. With this aim in mind, we shall study and compare with observations (i) the main structural and luminosity characteristics of galaxies corresponding to a local disk galaxy population, and (ii) the main correlations among the global properties, particularly those which go across the Hubble sequence. To achieve the former item, it is enough to calculate models for a significant range of masses, MAHs and , and test whether the obtained galaxy properties are realistic for these ranges. Regarding the latter item, as was mentioned above, we shall not model a complete galaxy population; only general trends in the correlations among the global galaxy properties will be obtained. As a matter of fact, the available observational galaxy samples are not complete enough so as to provide complete statistical information on galaxy properties and their correlations. Only certain relations, as the Tully-Fisher relation (TFR), were observationally studied with enough detail as to have a statistical description.
We calculate models for three representative masses: 5M 5M and 5M. For each mass, three MAHs are selected from its distribution: the average, and two symmetrical deviations such that roughly of all the MAHs are contained between them (see AFH98). For each mass and for each MAH, we calculate models taking three values of 0.035, 0.05, and 0.1. Thus, we obtain a grid of 27 models.
3 The local properties of the models
Local star formation rate. We obtain that
| (3) |
with , for most of the models and along a major portion of the disks, where is the SF rate per unit of area (see also Firmani et al. 1996). This SF law is basically a consequence of the self-regulation feedback mechanism used in our models (Firmani & Avila-Reese, in preparation). Other self-regulation SF models also yield SF rates with (near to 2) power-law dependences on local (see references in Struck & Smith 1999). Unfortunately, the observational data on the local SF rate of disks galaxies are still very poor. The data presented in Kennicutt (1989, 1998) show that the disks at intermedium radii typically have a SF law, while at inner radii the index is typically smaller than 2 and near to 1. Our SF prescription in inside-out forming disks is just a simple approximation to very complex phenomena; at this level, we think that our model predictions are succesful.
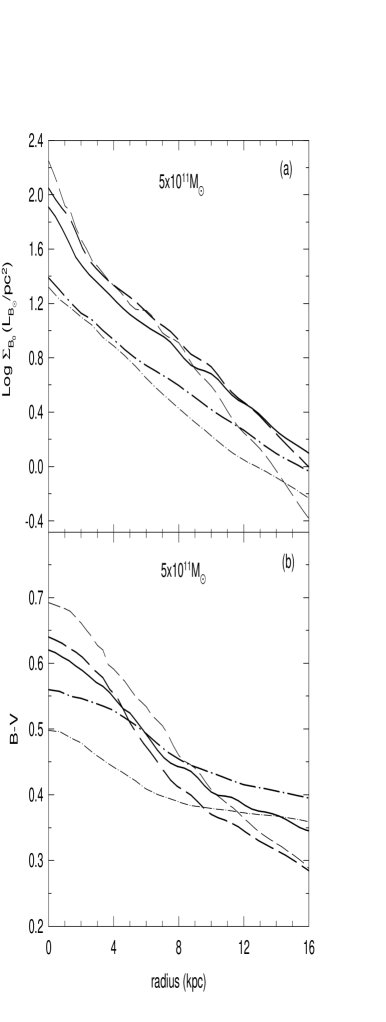
Surface brightness profiles. The mechanism of disk formation used here naturally leads to an exponential radial distribution of the disk surface density. Note that we have not assumed initial angular momentum distribution corresponding to an object in solid body rotation (e.g., Fall & Efstathiou 1980; Dalcanton et al. 1997). The crucial point is that we have assumed constant in time (see eq. 1). Analysis of cosmological N-body simulations seem to confirm this assumption (Gottlober, personal communication). In Figure 1a we show the surface brightness (SB) profiles in the band for different models of 5M⊙. The SB profiles are nearly exponential and the models with large form low SB galaxies (see also Dalcanton et al. 1997; Jiménez et al. 1998). For other masses the situation is the same, although with the mass the SB increases on average.
Radial distribution of the color index. A natural consequence of the inside-out disk galaxy formation mechanism is the existence of negative radial color index gradients along the disk. In Figure 1b we plot the radial color distributions for the same models of Figure 1a. Multiwavelength surface photometry studies of galaxies (e.g., de Jong 1995,1996b) confirm that galaxy disks tend to be bluer at the periphery, although these gradients are typically smaller than those predicted by our models. We shall return to this point in .
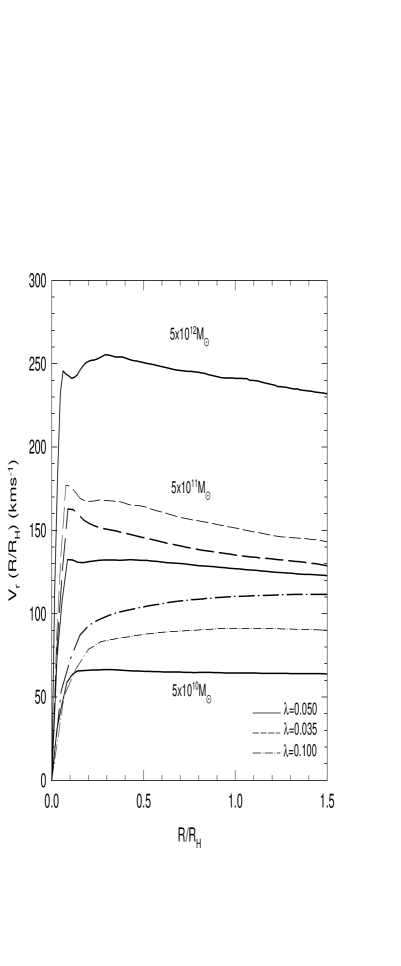
Rotation curves. In Figure 2, the rotation curves for the same models of Figure 1 are depicted. The shape of the rotation curve depends mainly upon the spin parameter and the MAH, and it correlates with the central SB. Observational studies seem to confirm the fact that galaxies with higher SB have more peaked rotation curves (e.g., Casertano & van Gorkom 1991; Tully & Verheijen 1997; Verheijen 1997). Models with the early active MAH have more concentrated rotation curves than models with an extended MAH. In Figure 2, the rotation curves of the and 5M⊙ models, corresponding to the average MAHs and , are also depicted. At the Holmberg radius the less massive models have nearly flat rotation curves, while the more massive galaxies present decreasing rotation curves. A similar trend was found from a large observational sample (Persic, Salucci, & Stel 1996). This could seem contradictory with the result that less massive DM halos are more concentrated than the more massive ones (Navarro et al. 1996,1997; AFH98; Avila-Reese et al. 1999). However, in our models, this is compensated by the fact that the disks in massive halos are more concentrated than in small halos (see also Dalcanton et al. 1997), with the result that their contribution to the total rotation curve is more significant in the more massive halos than in the less massive ones. The disk mass fraction also influences on the rotation curve shape. If we fix then the rotation curves of all the model result less peaked than those presented in Figure 2 (see also Mo et al. 1998, FA).
Regarding the decomposition of the rotation curves, as it was already shown in AFH98 and FA, we obtain that the halo component dominates almost everywhere for most of the models. This result is in potential disagreement with the rotation curve decompositions inferred from observations (e.g., Carignan & Freeman 1985; Sancisi & van Albada 1987; Begeman 1987; Verheijen 1997; Corsini et al. 1998). In 6.3 we shall return to this question.
4 The global properties of the models
Among the global properties that our models predict for a disk galaxy, we shall take into account for this study the integral color index (calculated within a Holmberg radius), the -band luminosity the -band exponential disk scale length , the -band central SB or ( is given in magnitudes per arcsec and in per pc-2), the disk gas fraction (), the stellar bulge-to-disk ratio b/d, and the maximum rotation velocity The correlation matrix from a principal component analysis of these properties for the 27 models calculated here is given in Table 1. The correlation coefficients give only a qualitative estimate of the correlations; note that the initial parameters of the models were not drawn randomly from the corresponding statistical distributions (.
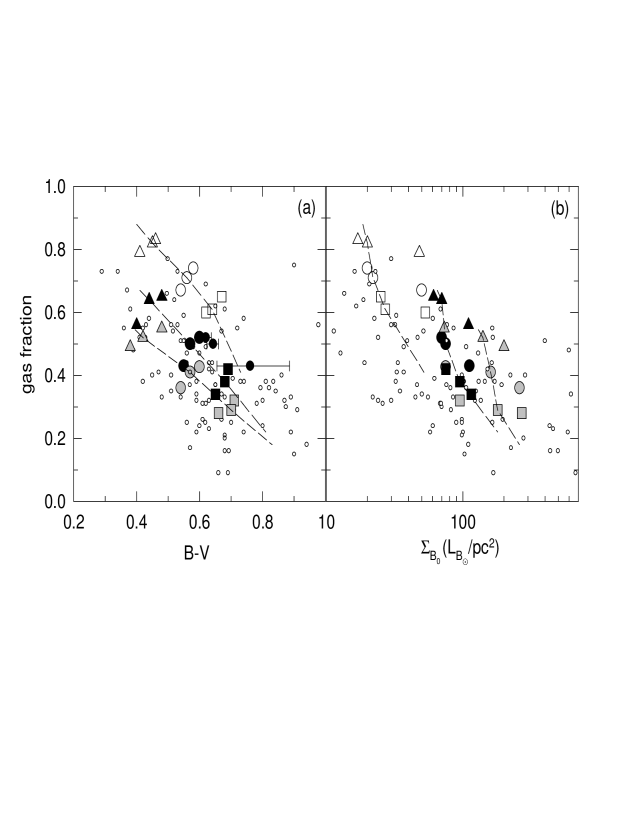
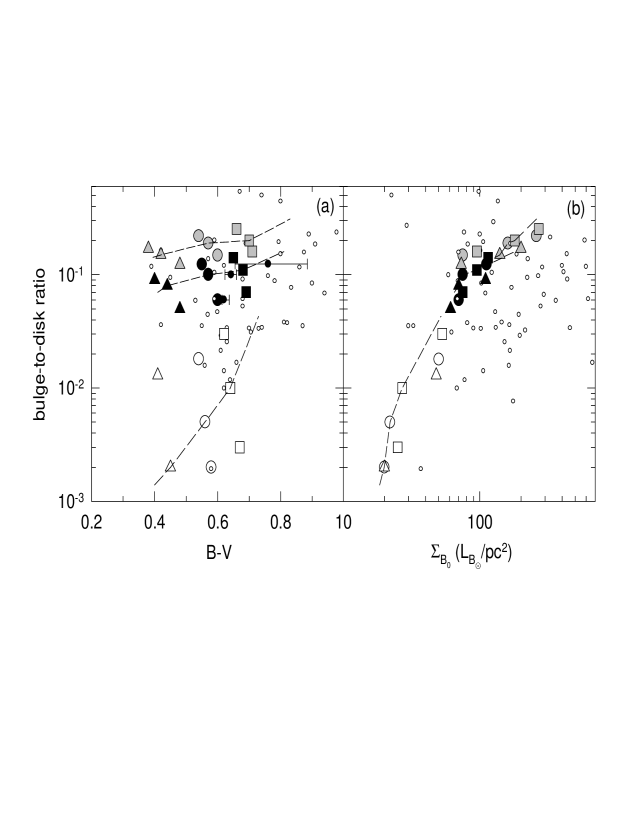
From Table 1 is seen that the observational trends across the Hubble sequence are reproduced for the intensive properties: the redder and more concentrated is the disk, the smaller is the gas fraction and the larger is the b/d ratio. Moreover, the models seem to populate a planar region in the or spaces, in agreement with observations (McGaugh & de Blok 1997). and are almost independent one from the other, so that we can express and b/d as functions of these two parameters. In Figure 3, is plotted versus and . The gas fraction is larger for bluer colors (panel a), which means that is larger for the MAHs whose present-day gas infall rate is still high. On the other hand, in panel b it is seen how a less concentrated disk (larger ) presents a higher than a disk with high (low ). On the basis of this result is the influence of the disk gravitational compression upon the capability of gas to form stars (Firmani & Tutukov 1992, 1994). The disk surface density strongly influences the b/d ratio. This is because the stellar surface density enters in the Toomre gravitational instability criterion which is used in our models to calculate the formation of bulges. The larger the central SB (stellar density), the larger is the b/d ratio (Fig. 4b). The mass and MAH introduce a dispersion in this correlation because they influence the other quantities which appear in the Toomre criterion. In Figure 4a is seen how marginally does b/d depend upon . The observational data show that b/d correlates better with than with (e.g., de Jong 1996a).
In Figures 3 and 4 are also plotted the observational data taken from a compilation presented in McGaugh & de Block (1997) where low SB galaxies are included. The color indexes were not corrected for the internal (inclination) galaxy extinction. We have applied this correction according to the formula given in the RC3 catalog (de Vaucouleurs et al. 1991). The b/d ratios for the low SB galaxies presented in McGaugh & de Block (1997) were not estimated, so that in the panels where this ratio is plotted the low SB galaxies are not considered. In general, the model properties fall rather well within the observational ranges and are in agreement with the empirical correlations (compare also Table 1 with the correlation matrix presented in McGaugh & de Block 1997). It is encouraging that the b/d ratios predicted by the models using the simple gravitational instability criterion (secular bulge formation) are in agreement with those inferred from observations (de Jong 1996a,c). Note that de Jong (1996c) used an exponential profile in his two dimensional bulge-to-disk decomposition procedure instead of the de Vaucouleour’s profile for the bulges, arguing that such a profile fits better the observations (see also Andrekakis & Sanders 1994; Andrekakis, Peletier, & Balcells 1995). That is why the b/d ratios obtained by him are smaller than those given by previous b/d decompositions (e.g., Simien & de Vaucouleurs 1986). The bulges of galaxies with b/d ratios larger than those our models predict can be the product of the collapse and/or merger mechanisms of bulge formation which we do not treat.
The most serious inconsistency between theory and observation in Figures 3 and 4 is probably that the color index of the models are bluer than those of the observed galaxies. Part of this inconsistency might be due to the imprecision of our population synthesis model (see . Nevertheless, other explanations are also possible. The statistical range ( of the MAHs calculated here for the Gaussian fluctuations leads to disks with between approximately and . Models with colors redder than 0.7 mag may be produced, although only for extreme cases. We have found that the color index becomes very sensitive to the MAH when this corresponds to early active MAHs: for some extreme cases the color may be as red as mag. Thus, some models can easily attain colors redder than 0.7 mag; of course the frequency of such models will be low. In Figures 3 and 4, with dashed lines we show the range of values of the different properties of the 5 models for the three when the statistical range in the MAHs is symmetrically extended to (symbols consider only ). As is seen, the models can be as red as some observed galaxies are.
The addition of some extra phenomena in our models may help to obtain galaxies redder than those presented in Figures 3 and 4. For example, the internal extinction in combination with the metallicity-luminosity relation can introduce an important effect of reddening, particularly for the most massive galaxies (see §5.2). Using the results presented in Wang & Heckman (1996) (hereafter WH96), and the Galactic extinction curve for (Cardelli, Clayton, & Mathis 1989), we have reddened the models corresponding to the average MAH and , represented in Figures 3 and 4 with black filled circles. The error bars account for the range of parameter values given in WH96 (see Appendix).
The influence of environment on the galaxy evolution might also help to produce models redder than 0.7 mag. In dense environments, the gentle mass aggregation is probably truncated early. Experiments show that if gas accretion is truncated in the models at 6 Gyrs and 4 Gyrs, then roughly increases by 0.08 and 0.15 mag, respectively. On the other hand, the early interactions in the dense environments can induce non stationary SF which produces a fast gas consumption into stars. In a recent work, Márquez & Moles (1999) studied a sample of very isolated galaxies and they found that the corrected total color index of the galaxies lies between 0.35 and 0.85 magnitudes with an average value of 0.48 magnitudes, i.e. the very isolated galaxies indeed tend to be blue.
The observational sample presented in Figures 3 and 4 is statistically incomplete and plagued of observational uncertainties. This and possible effects of extinction could account for the large scatters in the empirical correlations among the intensive properties with respect to those of the models. Nevertheless, it is probable that the intrinsic scatters are, in any case, larger than those found in our simulations. This is because the scenario proposed here takes into account only the most relevant ingredients of galaxy formation and evolution, omiting certain phenomena which are not dominant, but are observed in some galaxies. For example, the SF prescription used in the models is basically a stationary process, while in real galaxies SF sometimes may appears in bursting modes. This fact introduces a stochastic component in the photometric features, particularly for low mass galaxies (Firmani & Tutukov 1994).
5 Correlations between global properties
5.1 The Tully-Fisher relation in the infrared bands and its scatter
The galaxy luminosity in the infrared bands is a reliable tracer of the disk stellar mass (e.g., Pierce & Tully 1992; Gavazzi 1993; Gavazzi, Pierini, & Boselli 1996). Thus, the TFR in the infrared bands may be translated to a relation between the disk stellar mass and the maximum rotation velocity of disk galaxies. In AFH98 it was already shown that this relation for the SCDM model is in good agreement with that derived from most of observations. AFH98 assumed that the total disk mass is directly proportional to . Since here we calculate the SF, this assumption is relaxed. The relation we obtain is actually very similar to that estimated in AFH98. However, the scatter in the relation now is smaller than in AFH98. This is because depends upon disk surface density. The efficiency of SF is larger in disks with larger surface densities. Thus, for a fixed disk total mass (stars+gas), the model galaxies with higher surface densities have larger than models with low surface densities, but they also have larger stellar masses . In the diagram, the models in the high velocity side shift to high values of , while the models in the low velocity side shift to low values of . This compensating effect is responsible for a scatter in the relation smaller than that we would expect if one assumes that is directly proportional to the total disk mass. This effect also produces that high and low surface density (brightness) models have approximately the same relation, i.e. the TFR of low and high models is nearly the same (see also FA). The observational data point out to the same fact (c.f., Zwaan et al. 1995; Verheijen 1997).
In our models the rms scatter in the relation (or TFR) is originated by the scatter in the structure of the DM halos (due to the scatter in the MAHs), and by the dispersion of the spin parameter . The contribution of the latter to the total scatter is diminished due to the effect just mentioned above. To estimate the scatter in the relation we should generate a catalog of models where, at least, the MAH and are drawn through Monte Carlo simulations from their corresponding statistical distributions. This was done in FA for a low density CDM model with cosmological constant. At galaxy scales the power spectrum of fluctuations of this model is similar to the SCDM model used here. In FA it was obtained that the quadratic contributions to the scatter in the relation due to the scatters in the MAHs and in are approximately and , respectively. Thus, the scatter in the MAH is the main source of the scatter in the relation (or TFR).
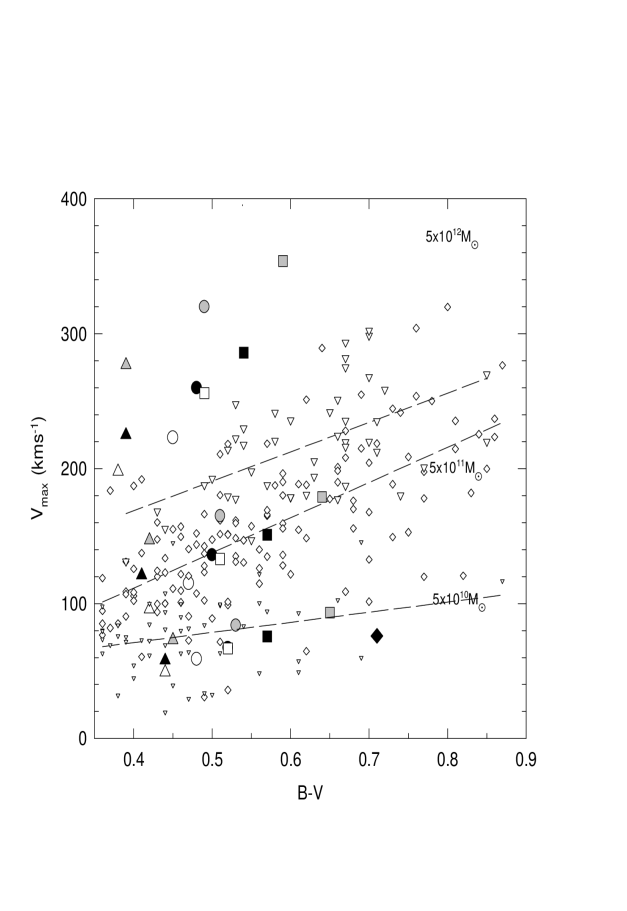
It is important to note that this scatter is correlated with some intensive properties. For example, in Figure 5 is seen that, for a given mass, increases with the color. This is also evident from Table 1 where we show the correlation coefficients for which reflects the deviations from the TFR. This behaviour is easily understood from the point of view of the extended collapse scenario: galaxies formed through gentle MAHs will be less concentrated (smaller ) and with SF histories more extended in time (bluer colors) than galaxies formed through early active MAHs. The observational data confirm this prediction of the models. In Figure 5, galaxies from a cross of the RC3 (de Vaucouleurs et al. 1991) and the Tully (Tully 1988) catalogs are also depicted. To estimate the behavior of with the color for a given mass (luminosity), the data were divided into three broad bins according to the luminosities presented in the mentioned catalogs. The dashed lines are lineal regression to each one of these bins. Although the estimate is very qualitative, we see that the observed trend is in agreement with the models’ predictions.
5.2 The color Tully-Fisher and color-magnitude relations
The measured slope of the TFR is smaller as the color passband in which the luminosity is measured is bluer. This dependence of the TFR slope with the color band gives rise to the so called color TFR (Gavazzi 1993; Bothun et. al 1985):
| (4) |
where and indicate a given color band, and and are the corresponding slopes of the TFR in these bands. For example, for the and bands, according to the empirical estimates reported in the literature, (e.g., Gavazzi 1993; Strauss & Willick 1995, and more references therein). As it was mentioned in the previous subsection, . Thus, according to eq. (4) we have that
| (5) |
where , i.e. the ratio increases with . This is an important result which should be seriously considered in any theory of disk galaxy formation. We find at least three possible causes for this dependence of the mass-to-luminosity ratio on : (i) the SF efficiency could depend on the gravitational potential of the system in such a way that in galaxies with larger the gas is consumed into stars more efficiently than in galaxies with low ; (ii) if disk galaxies build up inside-out by a continuous process of gas accretion, then the dependence given by eq. (5) is expected in the case the rate of gas accretion at late epochs decreases more rapidly for larger galaxies than for smaller ones222Such a situation is possible if, for example, in large systems a fraction of the accreting gas is trapped and efficiently transformed into stars within the potential wells of relative large substructures (satellites) around the central disk galaxy.; (iii) the color TFR or the dependence given by eq. (5) may be explained by the effect of internal dust absorption —which affects the luminosity in the blue bands but not in the infrared ones—, if the absorption increases with the galaxy mass (rotation velocity).
The results of our models show that the slopes and of the TFRs in the and bands are approximately equal, or, what is the same, the ratio is constant with . This is (i) because, according to our SF mechanism, the SF efficiency scarcely depends on mass (or ), and (ii) because we assume that the rate of gas accretion is determined only by the cosmological rate, avoiding possible intermediate processes like that mentioned in the footnote. In fact, in our models, at late epochs the cosmological accretion rates —given by the MAHs— for larger systems decrease more slowly than for smaller systems (small halos collapse on average earlier than big halos, Navarro, et al. 1996, AFH98). However, this dependence on mass (oposite to observations) is compensated by the fact that larger galaxies have on average slightly higher surface densities (see ; Dalcanton et al. 1997; FA), and in our models, the SF efficiency is larger for higher surface densities. It is interesting to note that the same argument was used to explain why the shape of the rotation curves is nearly independent of mass in spite of that less massive CDM halos are more concentrated than the more massive ones ().
We propose that the dependence given by eq. (5) is basically produced by dust absorption. It is well known that the metallicity abundance of spiral galaxies correlates with their luminosities, , where (see references in Roberts & Haynes 1994). Since dust particles form from heavy elements, this relation suggests that more luminous galaxies have higher dust abundance than the less luminous galaxies. Direct galaxy images also show that the dust abundances increase with the galaxy luminosity (van den Bergh & Pierce 1990). Indeed, WH96 based on studies of the UV and FIR fluxes of a sample of normal late-type galaxies, have found a clear correlation between the dust opacity and the band luminosity of galaxies.
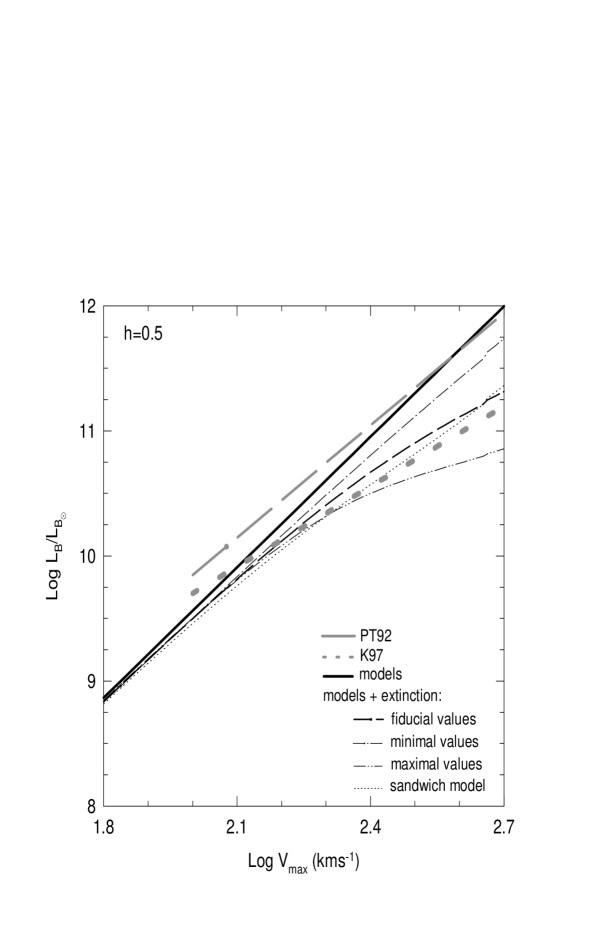
In the Appendix, from the results of WH96 and using the uniform slab model, we calculate the extinction in the band, , as a function of (eq. A2). Applying this luminosity-dependent extinction to our models we obtain that the slope of the TFR in the band becomes flatter than in the original models. Figure 6 shows that this relation in the range log is approximated by a line with slope 2.7, as many observations suggest. Note that the dependence of extinction on luminosity does not only produce a change of slope, but also some nonlinearity, particularly at the bright end of Figure 6. A similar result was previously reported by Giovanelli et al. (1995). If the samples used by different observers cover different luminosity ranges, this could explain why the reported slopes of the -band TFRs are so disparated. Recently, Kudrya et al. (1997) have presented the band TFR for a large sample of galaxies in a large range of luminosities; from their Figure 6 it is clearly seen how the slope of this relation tends to be steeper for the less luminous galaxies (see also e.g., Pierce & Tully 1992). In Figure 6 are also depicted the predicted TFRs after applying extinctions calculated with the maximal and minimal optical depths given in WH96 (see Appendix). The more realistic “sandwich” model (Disney, Davies, & Philipps 1989) was also considered (dotted line, see Appendix).
Since the early eighties a correlation between the galaxy total color and its magnitude was reported for spiral galaxies (Vishnavatan 1981; Wyse 1982; Tully, Mould, & Aaranson 1982). The more luminous is the galaxy the redder tends to be its color. As a matter of fact, this relation is intimately related to the color TFR mentioned above. For instance, by dividing the band and band TFR one to another, one obtains:
| (6) |
For the same range of values for and used in eq. (5), we have that with . This is in rough agreement with the slopes reported for the color-magnitude relation. Thus, according to the above discussion, dust absorption may be responsible for this relation. Assuming that in the band dust absoption is negligible, while in the band absorption depends upon luminosity as WH96 found (eq. A1), the galaxy color will redden proportionally to the extinction estimated in the Appendix. As a first approximation, using the linear fitting to (eq. A3), one obtains that
| (7) |
WH96 suggested that the dependence of internal absorption upon luminosity (eq. A1) may be explained by the observed increase of metallicity and/or surface density with the luminosity. Less luminous (massive) galaxies can have lower metallicity abundances than more luminous galaxies because the dust expelling from the galaxy is more effective in the former than in the latter. Shustov, Wiebe, & Tutukov (1997), using models of disk galaxy evolution that take into account the process of dust expelling by radiation pressure, show that dust loss is much more effective in low-mass galaxies than in massive ones. They obtained a dependence of iron abundance on galaxy luminosity near to the observed, and found that the other properties of the galaxy models do not significantly change with dust loss. Hydrodynamical simulations of starburst-driven mass ejection indeed have shown that the efficiency of metal ejection is much larger than that of the gas and this efficiency of metal ejection decreases with mass (Mac Low & Ferrara 1999). Regarding the disk surface density, our models indeed show that more massive galaxies have typically slightly higher surface density disks. Although this dependence is not too pronounced as the one Dalcanton et al. (1997) obtained, it could also contributes to give rise to the absorption-luminosity relation (eq. A1).
Finally, we note that metallicity, in addition to the absorption effect, also influences the spectrophotometric evolution. For example the spectrophotometric models of Bressan, Chiosi, & Fagotto (1994) applied to single stellar populations with different initial metallicities show that at Gyr the differences in the and colors are 0.88 mag and 0.23 mag, respectively for a factor of 20 of variance in metallicity. These models roughly agree with the observed color-magnitude relation of elliptical galaxies, and in accordance with Kodama & Arimoto (1997), this relation is consequence of a metallicity effect, instead of an age effect.
5.3 The luminosity-radius relation
The mass-radius relation predicted by the models (the average values in the MAH and were used) is:
| (8) |
where is the disk stellar mass, and is the Holmberg radius. The radius scales with as The scatter in these relations is large and it correlates with the SB (AF99). The Holmberg and scale radii do not correlate with any intensive galaxy property (see Table 1), suggesting that the evolution of disk galaxies and the Hubble sequence are size independent (de Jong 1996a; McGaugh & de Block 1997).
6 The fundamental physical factors of disk galaxies and the Hubble sequence
One of the aims of this paper is to investigate which physical factors determine the properties of present-day disk galaxies. According to the extended collapse scenario, these fundamental factors are: the virial present-day mass of the system, the MAH, and the angular momentum expressed through the spin parameter . These factors and their statistical distributions are related to the initial cosmological conditions and they are able to produce most of the disk galaxy properties and their correlations. As a first approximation, here we assumeed independence between and the MAH. Analytical studies (c.f., Hoffman 1986, 1988; Heavens & Peacock 1988) suggest that is almost independent from the fluctuation peak height (related to the MAH) for CDM power spectra. We also assumed independence between and (see §2.3). Concerning the dependence of MAH upon , the less massive galaxies undergo a faster early collapse than the more massive galaxies for the CDM power spectra (AFH98).
The correlation coefficients from a principal analysis of these three factors with the model galaxy properties are given in Table 2. The MAH was quantified through the parameter, where
| (9) |
The MAH, which partially drives the SF history, strongly influences the color index, and moderately influences the gas fraction . The range of colors that the models span is mainly associated with the statistical dispersion in the MAHs. This dispersion is also reflected in the TFR scatter (the coefficient correlates with ), and as it was shown above (see Figure 5), observations confirm a correlation between and the maximum circular velocity for a given luminosity (mass).
The parameter strongly influences the SB, the b/d ratio, and . For a given and MAH, determines the degree of concentration (SB) of the disks. According to the SF mechanism used in our models, the surface density influences the SF efficiency and therefore, the . Furthermore, as it was mentioned in 4, the stellar Toomre parameter is small for small stellar surface densities. Therefore, the b/d ratio is larger for systems with small .
Mass strongly correlates with luminosity and the Holmberg radius and slightly influences the b/d ratio and the SB (both in the same direction as suggested by observations). As it was pointed out in §3.2, and are the two parameters on which the other intensive properties depend, i.e. the intensive properties of disk galaxies may be described in a biparametrical sequence, whose origin deals with two of the fundamental physical factors of galaxies, the MAH and respectively. Moreover, we have found that these properties correlate between them following the same trends that observed galaxies present across the Hubble sequence. Most of the intensive properties are almost independent from the third fundamental factor, the mass (luminosity). We have found that the mass-dependent dust absorption may be responsible for the color TF and color-magnitude relations ().
The morphological Hubble classification has been a useful guide to study the observational properties and correlations of galaxies. Nevertheless, most of the classification criteria deal with morphological characteristics that probably are transient phenomena related to more fundamental galaxy properties. The main classification criteria for spirals are the pitch angle and the strength of the spiral arms, and the b/d ratio. Despite the big effort done, the problem of the origin and maintenance of arms in disk galaxies is still not well understood. Bertin & Romeo (1987), Bertin et al. (1989a,b) and other authors (see for references Combes 1993) coincide in pointing out that gas, dynamically speaking, is crucial for the excitation and maintenance of spiral structures. According to Bertin & Lin (1996), the gas fraction mainly determines the sequence of types a, b, and c, i.e. the pitch angle of arms. As is seen in Table 1, the gas fractions in our models correlate with the other secondary indicators of the Hubble sequence which go across the a, b, and c sequence, such as b/d, and , suggesting that the origin of the Hubble morphological types is closely related to the galaxy formation and evolution processes of the extended collapse scenario.
Several observers have pointed out that, for a given luminosity, galaxies with larger maximum rotation velocities (the TFR scatter) are of earlier types than those with smaller velocities (Roberts 1978; Rubin, Thonnard, & Ford 1980, Rubin et al. 1985; Giraud 1986, 1987; Krann-Korteweg, Cameron, & Tamman 1988; Giovanelli et al. 1997). The TFR, where is a given band, predicted by the models has a dispersion that, at a first approximation, we express only through variations in the coefficient . As has been commented in § 3.2 (see also Fig. 5), the models present correlations between and some secondary Hubble type indicators as , and b/d (Table 1). Thus, within the framework of the extended collapse scenario, the empirical correlation found between galaxy type and rotation velocity for a given luminosity finds a natural explanation.
7 Discussion
7.1 Problems of the hierarchical formation scenario
We have studied disk galaxy formation and evolution in the cosmological context taking into account several key factors and processes of this phenomenon. Our models represent an extreme case of galaxy formation where we have assumed: (i) gentle and spherical symmetric gas infall at the center of hierarchically growing CDM halos (no mergers), (ii) no gas reheated and expelled back into the halo or lost from the system, and (iii) stationary self-regulated SF within the disk. We have seen that at the level of this simple picture many properties and correlations of the observed disk galaxies were predicted. However, the models are in potential conflict with some observational pieces of evidence. As we shall see, these conflicts may be partially solved invoking some extra ingredients in our scenario, but it is also possible that they are pointing out to serious inconsistences of the hierarchical clustering scenario in general.
In an accompanying paper (Firmani & Avila-Reese 2000b) we study the evolution of the models presented here. We find that the size and SB evolution of the disks is more dramatic than that one the deep field observations seem to suggest. This problem, toghether with the too steep negative radial color gradients our models predict (), constitute serious difficulties for the extended collapse scenario. The color gradients we obtain might be even steeper if the galaxy’s internal extinction significantly depends on surface density. The model disks also tend to be somewhat less dense and more extended than real galaxy disks, and the gas fractions of the models are slightly larger than those measured in galaxies (see Figs. 3 and 4). On the other hand, the integral colors of observed red galaxies seem to be redder than the red models (Figs. 3 and 4). In we have extensively discussed the solutions to the last conflict.
If some transfer of angular momentum from baryon matter to DM is allowed, then the disks result smaller and more concentrated. If this transfer of angular momentum tends to be more important at latter epochs and/or if a fraction of the late, high angular momentum accreting gas is trapped within substructures and does not fall to the disk, then the color gradient will be smaller, the total color index will be redder, and the size evolution will be less pronounced than we have obtained. It is also possible that during the gas collapse, the original gas angular momentum is redistributed due to several dynamical and hydrodynamical processes related to the deviations from the homogeneity and sphericity. Experiments where a moderate “flattening” of the radial angular momentum distribution of the infalling gas was introduced, show us that the disk radial color index gradients significantly decrease and the disk sizes change more slowly in time with respect to the original models.
It is interesting to note that the above mentioned conflicts of the extended collapse scenario tend to be opossed to those of the merger scenario. The merging seem to cause serious difficulties for conserving the gas initial angular momentum, with the consequence that disks result too small. This problem, called the “angular momentum catastrophe”, has been observed in the N-body+hydrodynamical numerical simulations without SF (e.g., Navarro & Steinmetz 1997). When SF is included, the merging of the large stellar subunits as the system evolves, also produces loss of angular momentum with the consequent formation of a elliptical-like object instead of a disk (c.f., Katz 1992). It is probable that reality lies in between the extended collapse and merger scenarios. More observational and theoretical studies on the formation and evolution of disks, their SF histories, and the radial distribution of color indexes and extinction are needed in order to arrive at definitive conclusions.
While some physical ingredients not considered in our scenario actually might work in the direction of improving the predictions, we do not discard the possibility that in general the hierarchical formation picture is in conflict with reality. On the other hand, as already has been pointed out, if the merging activity in the hierarchical formation picture based on the Gaussian inflationary CDM models is actually too high, then it is difficult to figure out the existence of a large number of galaxy disks in the framework of this picture (e.g., Tóth & Ostriker 1992). To the problems related with the formation of disks in the standard hierarchical formation picture, we add other potential conflict: the inner structure of the CDM halos. This is the subject of the next subsection.
7.2 Effects of a shallow core in the DM halo
The rotation curves of dwarf and low SB galaxies suggest that the inner density profiles of DM halos are shallower than (Moore 1994; Flores & Primack 1994; Burkert 1995; de Blok & McGaugh 1997). Our results and the results of high-resolution cosmological N-body simulations (e.g., Navarro et al. 1996,1997; Fukushige & Makino 1997; Moore et al. 1998, 1999; Jing 1999; Jing & Suto 1999) show that for the CDM models the halo inner density profiles are not shallower than . The rotation curve decomposition of the galaxies formed within the CDM halos also seem to be in conflict with the decompositions inferred from observations for high SB galaxies (AFH98; FA; but see Navarro 1998).
In order to explore the effects of a shallow core on the properties of the model disk galaxies, we introduce an artificial core in our evolving CDM halos. Our approach is purely phenomenological: the inner density profile of the evolving halos is flattened in such a way that the final rotation curves of low SB model galaxies (those with large ) resemble the observed rotation curves of low SB (see for details FA). The inner halo density profile obtained for the SCDM model treated here is very similar to that obtained for the CDM model in FA.
As in FA, we find that the main effect of the shallow core is to raise the contribution of the disk component with respect to the halo component in the rotation curve decomposition. This makes the rotation curve decompositions of the model galaxies more realistic. The intensive properties are almost the same for the models with and without a shallow core. The of the models with a shallow core are slightly smaller than for the original ones. This shifts our predicted and band TFRs to lower velocities thus giving a better agreement with the observational data (see also FA). For a fixed rotation curve shape, the central surface densitites (SB) are higher for the models with core. This is because in order to have the same rotation curve shape, a model with a shallow core should have a more concentrated disk (smaller ) that would compensate the smaller halo contribution to the total rotation curve with respect to the model with a more dense halo core.
8 Summary and conclusions
We studied the formation and evolution of individual disk galaxies within the framework of an inflationary Gaussian SCDM model normalized to . We built-up disks in centrifugal equilibrium within hierarchically growing DM halos; the disks form inside-out with gas (no mergers) accreted with a rate proportional to the cosmological infall rate given by the mass aggregation history (MAH), and under the assumption in time and detailed angular momentum conservation during the gas collapse. The SF in the disk is produced by global gravitational instabilities and it self-regulates by an energy balance in the turbulent ISM. We calculated the secular formation of a bulge using a gravitational instability criterion for the stellar disk. Our main conclusions are:
1). The main properties of present-day high and low SB disk galaxies and their correlations may principally be explained by the combination of three fundamental physical factors and their statistical distributions. These factors are the halo virial mass , the MAH, and the spin parameter , and they are related to the cosmological initial conditions.
2). The SF efficiency of the models does not sustantially depend upon the mass or of the galaxy. Therefore, the integral color index or the mass-to-luminosity ratio do not depend upon mass. We showed that the empirical correlation of dust extinction upon luminosity reported by WH96 explains the observed color-magnitud and color TFRs without the necessity of introducing a mass-dependent SF efficiency.
3). Several global and local properties of present-day disk galaxies and their correlations are a natural consequence of the extended collapse scenario. We remark the following results:
- The redder and more concentrated is the model disk, the smaller is its gas fraction and the larger is its b/d ratio. The values of these intensive properties are in rough agreement with the observational data. The intensive properties of the models are described by a biparametrical sequence, where the parameters are the color index and the central SB, . These parameters are mainly determined by the MAH and by , respectively. Thus, according to our models, the Hubble sequence is biparametrical as some observations suggest.
-The model results agree with the near-infrared TFRs, suggesting that the origin of the TFR is cosmological. This relation is almost independent from the SB and its scatter is mainly dominated by the dispersion in the MAHs (or the dispersion in the DM halo structures). For a given luminosity, the larger the is (TFR deviation), the redder is the galaxy and the smaller is its gas fraction . This is because, on one hand the MAH influences on the galaxy color index and , and on the other hand, it is the dispersion in the MAHs that mainly produces the deviations from the TFR.
-The stellar surface density and brightness profiles are nearly exponential. This is a result of the inside-out disk formation assuming detailed angular momentum conservation and constant in time. The SB of the models mainly depends on .
-Also as a result of the inside-out disk formation, the radial gradients along the disks are negative: the outer disk regions are younger than the inner ones.
-The shape of the total rotation curves depends on the the disk mass fraction , and the MAH. For reasonable values of , the approximate flatness of the rotation curves presented by most of the models is due to a “conspiration” among the CDM halo and the baryon disk. The rotation curve decompositions, however, show excesive dominance of the halo component over the disk component with respect to observational estimates.
The main shortcomings of the models presented here are (i) the probably excesive radial color index gradients and disk size evolution, and (ii) the DM dominion in the rotation curve decompositon. The inclusion in the models of other, less important ingredients and processes as merging, angular momentum transfer, and non-stationary SF work in the direction of overcoming the former shortcomings. The latter problem is solved if the inner density profile of the CDM is shallower than predicted. It is probable that these problems are in general pointing to a more serious difficulty of the hierarchical formation scenario based on the Gaussian CDM models.
Acknowledgements.
Acknowledgments We are grateful to the referee for helpful comments.Appendix A Calculation of the luminosity-dependent band exctinction
Wang & Heckman (1996), based on studies of the far UV and FIR fluxes of a sample of normal late type galaxies, have concluded that the dust opacity increases with the luminosity of the young stellar population. They find that a power law relation between the optical depth and the UV luminosity explains this observational dependence. This relation, referred to the B band, is:
| (10) |
where the best fits to observations are for and . According to the uniform slab model WH96 have used, the extinction in magnitudes may be expressed as , and in the range using (A1) with the central values, is well approximated by
| (11) |
In the range of the linear fitting
| (12) |
is also a good approximation.
To calculate the extinction for the two extreme cases of maximal and minimal optical depths, we use and for the former, and and for the latter. To calculate the extinction with the more realistic “sandwich” model (Disney, Davies, & Philipps 1989), we use the fiducial value of given by WH96, and and the ratio of the height scale of dust to young stars, are fixed to the values suggested by Bosselli & Gavazzi (1994) for the optically thin case in the band (1.33 and 0.74).
References
- [1] Andredakis, Y.C., Peletier, R.F., & Balcells, M. 1995, MNRAS, 275, 874
- [2] Andredakis, Y.C., & Sanders, R.H. 1994, MNRAS, 267, 283
- [3] Avila-Reese, V. 1998, PhD. Thesis, U.N.A.M. (in Spanish).
- [4] Avila-Reese, V., & Vázquez-Semadeni 2000, in ”Astrophysical Plasmas: Codes, Models and Observations”, Eds. J.Franco, J.Arthur, N.Brickhouse, Rev.Mex.AA Conf. Series, in press
- [5] Avila-Reese, V., Firmani, C., & Hernández, X. 1997, ApJ, 505, 37 (AFH98)
- [6] Avila-Reese, V., Firmani, C., Klypin, A., & Kravtsov, A. 1999, MNRAS, 310, 527
- [7] Baugh, C.M., Cole, S., & Frenk, C.S. 1996, MNRAS, 283, 1361
- [8] Baugh, C.M., Cole, S., & Frenk, C.S., & Lacey, C. 1997, ApJ, 498, 504
- [9] Begeman, K. 1987, Ph.D. Thesis, University of Groningen
- [10] Bertin, G., & Lin, C.C. 1996, “Spiral Structure in Galaxies. A Density Wave Theory” (The MIT Press)
- [11] Bertin, G., & Romeo, A.B. 1988, A&A, 195, 105
- [12] Bertin, G., Lin, C.C., Lowe, S.A., & Thurstans, R.P. 1989a, ApJ, 338, 78
- [13] _____. 1989b, ApJ, 338, 104
- [14] Blanchard A., Valls-Gabaud D., Mamon G., 1992, A&A, 264, 365
- [15] Blitz, L., Spergel, D.N., Teuben, P.J., Hartmann, D., & Burton, W.B. 1998, ApJ, 514, 818
- [16] Bond, J.R., Cole, S., Efstathiou, G., Kaiser, N. 1991, ApJ, 379, 440
- [17] Bothun, G., D., Mould, J., Schommer, R.A., & Aaranson, M. 1985, ApJ, 291, 586
- [18] Bower, R. 1991, MNRAS, 248, 332
- [19] Bressan, A., Chiosi, C., & Fagotto, F. 1994, ApJS, 94, 63
- [20] Bruzual, G.A., & Charlot, S. 1993, ApJ, 405, 538
- [21] Burkert, A. 1995, ApJ, 447, L25
- [22] Cardelli, J.A., Clayton, G.C., & Mathis, J.S. 1989, ApJ, 345, 245
- [23] Carignan, C., & Freeman, K.C. 1985, ApJ, 160, 811
- [24] Casertano, S., & van Gorkom, J.H. 1991, AJ, 101, 1231
- [25] Catelan, P., & Theuns, T. 1996, MNRAS, 282, 436
- [26] Charlot, S., Worthey, G., & Bressan A. 1996, ApJ, 457, 625
- [27] Cole, S., & Lacey, C. 1996, MNRAS, 281, 716
- [28] Cole, S., Aragon-Salamanca, A., Frenk, C.S., Navarro, J., & Zepf, S. 1994, MNRAS, 271, 781
- [29] Combes, F. 1993, in “The Formation and Evolution of Galaxies”, eds. Muñoz-Tuñón & F. Sánchez (Cambridge Univ. Press), p. 317
- [30] Corsini, E.M. et al. 1998, A&A, 342, 671
- [31] Courteau, S., de Jong, R.S., & Broeils, A.H. 1997, ApJ, 457, L73
- [32] Dalcanton, J.J., Spergel, D.N., & Summers, F.J. 1997, ApJ, 482, 659
- [33] de Blok, W.J.G., McGaugh, S.S. 1997, MNRAS, 290, 533
- [34] de Jong, R.S. 1995, Ph.D. Thesis, University of Groningen
- [35] _____. 1996a, A&A, 313, 45
- [36] _____. 1996b, A&A, 313, 377
- [37] _____. 1996c, A&ASS, 118, 557
- [38] de Vaucouleurs, G., et al. 1991, Third Reference Catalogue of Bright Galaxies (Springer, Berlin Heidelberg New York)
- [39] Disney, M.J., Davies, J., & Philipss, S. 1989, MNRAS, 205, 1253
- [40] Eke, V., Navarro, J.F., & Frenk, C.S. 1998, ApJ, 503, 569
- [41] Fall, S.M., & Efstathiou, G., 1980, MNRAS, 193, 189
- [42] Firmani, C., & Avila-Reese, V. 2000a, MNRAS, accepted (FA)
- [43] Firmani, C., & Avila-Reese, V. 2000b, preprint
- [44] Firmani, C., & Tutukov, A.V. 1992, A&A, 264, 37
- [45] _____. 1994, A&A, 288, 713
- [46] Firmani, C., Hernández, X., & Gallagher 1996, A&A, 308, 403
- [47] Flores, R.A., & Primack, J.R. 1994, ApJ, 427, L1
- [48] Flores, R.A., Primack, J.R., Blumenthal, G.R., & Faber, S.M. 1993, ApJ, 412, 443
- [49] Franco, J., Santillán, A., & Martos, M. 1995, in “The formation of the Milky Way”, G.Tenorio-Tagle, M.Prieto, & Sánchez, F. eds. (Cambridge Univ. Press), p. 515
- [50] Fukugita, M., Hogan, C.J., & Peebles, P.J.E. 1998, ApJ, 503, 518
- [51] Fukushige, T., & Makino, J. 1996, ApJ, 477, L9
- [52] Gallagher, J.S., Hunter, D.A., & Tutukov, A.V. 1984, ApJ, 284, 544
- [53] Gavazzi, G. 1993, ApJ, 419, 469
- [54] Gavazzi, G., Pierini, D., & Boselli, A. 1996, A&A, 312, 397
- [55] Giovanelli, R., Haynes, M.P., Herter, T.H., Vogt, N.P., da Costa, L.N., Freudling, W., Salzer, J.J., & Wegner, G. 1997, AJ, 113, 53
- [56] Giovanelli, R., Haynes, M., Salzer, J.J., Wegner, G., Da Costa, L.N., Freudling, W. 1995, AJ, 110, 1059
- [57] Giraud, E. 1986, ApJ, 309, 512
- [58] _____. 1987, A&A, 174, 23
- [59] Gunn, J.E. 1977, ApJ, 218, 592
- [60] _____. 1981, in “Astrophysical Cosmology”, M.S. Longair, Coyne G.V., & H.A. Brück, eds. (Pontificia Academia Scientarium:Citta del Vaticano), p.191
- [61] _____. 1987, in “The Galaxy”, G. Gilmore & B. Carswell, eds. (Reidel Publishing Company), p.413
- [62] Heyl, J.S., Cole, S., Frenk, C., Navarro, J. 1995, MNRAS, 274, 755
- [63] Heavens, A., & Peacock, J. 1988, MNRAS, 232, 339
- [64] Hoffman, Y. 1986, ApJ, 301, 65
- [65] _____. 1988, ApJ, 329,8
- [66] Jimenez, R., Padoan, P., Matteucci, F., & Heavens, A.F. 1998, MNRAS, 299, 123
- [67] Jing, Y.P. 1999, ApJ, submitted (astro-ph9901340)
- [68] Jing, Y.P., & Suto, Y.S. 2000, ApJ, 529, L69
- [69] Katz, N. 1992, ApJ, 391, 502
- [70] Kauffmann, G. 1995, MNRAS, 274, 161
- [71] _____. 1996, MNRAS, 281, 475
- [72] Kauffmann, G., White, S.D.M., & Guiderdoni, B. 1993, MNRAS, 264, 201
- [73] Kennicutt, R.C. 1983, ApJ, 272, 5
- [74] _____. 1989, ApJ, 344, 6854
- [75] _____. 1998, ApJ, 498, 541
- [76] Kennicutt, R.C., Tamblyn, P., & Congdon, C.W. 1994, ApJ, 435, 22
- [77] Kepner, J. 1997, preprint (astro-ph/9710329)
- [78] Kodama, T., & Arimoto, N. 1997, A&A, 320, 41
- [79] Kraan-Korteweg, R.C., Cameron, L.M., & Tammann, G.A. 1988, ApJ, 331, 620
- [80] Kudrya, Yu.N., Karachentseva, V.E., Karachentsev, I.D, & Parnovsky, S.L. 1997, Asrtonomy Letters, 23, 633
- [81] Kull, A. 1999, ApJ, 516, L5
- [82] Lacey, C.G., & Cole S., 1993, MNRAS, 262, 627
- [83] Lacey, C.G., Guiderdoni, B., Rocca-Volmerange, & Silk, J. 1993, ApJ, 402, 15
- [84] Larson, R.B., & Tinsley, B. M. 1978, ApJ, 219, 46
- [85] Larson, R.B., & Tinsley, B. M., & Caldwell, C.N. 1980, ApJ, 237, 692
- [86] López-Corredoira, M., Beckman, J.E., & Casuso, E. 1999, A&A, 351, 920
- [87] Mac Low, M.-M., & Ferrara, A. 1999, ApJ, 513, 142
- [88] Mac Low, M.-M., McCray, R., Norman, M.L. 1989, ApJ, 337, 141
- [89] Márquez, I., & Moles, M. 1999, A&A, 344, 421
- [90] McGaugh, S.S., de Blok, W.J.G. 1997, ApJ, 481, 689
- [91] Mo, H.J., Mao, S., & White, S.D.M. 1998, MNRAS, 295, 319
- [92] Moore, B. 1994, Nature, 370, 629
- [93] Navarro, J.F. 1998, preprint (astro-ph/9807084)
- [94] Navarro, J.F., & Steinmetz, M. 1997, ApJ, 478, 13
- [95] Navarro, J.F., Frenk, C.S. & White, S.D.M. 1996, ApJ, 462, 563
- [96] _____. 1997, ApJ, 490, 493
- [97] Natarajan, P. 1999, ApJ, 512, L105
- [98] Norman, C.A., Sellwood, J.A., & Hassan, H. 1996, ApJ, 462, 114
- [99] Nulsen, P.E.J., & Fabian, A.C. 1995, MNRAS, 277, 561
- [100] Padmanabhan, T. 1993, “Structure formation in the universe” (Cambridge Univ. Press, New York)
- [101] Peletier, R., & Balcells, M. 1996, AJ, 111, 2238
- [102] Persic, M., Salucci, P., & Stel, F. 1996, MNRAS, 281, 27
- [103] Pierce, M.J., & Tully, R.B. 1992, ApJ, 387, 47
- [104] Portinari, L., & Chiosi, C. 1999, A&A, accepted
- [105] Prunet, S., & Blanchard, A. 1999, A&A, accepted
- [106] Renzini, A. 1994, in “Galaxy Formation”, J.Silk & N. Vittorio, eds. (Elsevier Science Publishers B.V., The Netehrlands), p.303
- [107] Roberts, M.S. 1978, AJ, 83, 1026
- [108] Roberts, M.S., & Haynes, M.P. 1994, ARA&A, 32, 115
- [109] Rubin, V.C., Thonnard, N., & Ford, W.K. 1980, ApJ, 238, 471
- [110] Rubin, V.C., Burstein, D., Ford, W.K., & Thonnard, N. 1985, ApJ, 289, 81 i
- [111] Ryden, B.S., & Gunn, J.E. 1987, ApJ, 318, 15
- [112] Sancisi, R., & van Albada, T.S. 1987, in “Dark matter in the universe”, IAU Symposium 117, eds. J.Kormendy, & G.R.Knapp, (Reidel:Dordrecht), p.67
- [113] Shustov, B., Wiebe, D., & Tutukov, A. 1997, A&A, 317, 397
- [114] Simien, F., & de Vaucouleurs, G. 1986, ApJ, 302, 564
- [115] Slavin, J.D., & Cox D.P. 1992, ApJ, 392, 131
- [116] Somerville, R.S., & Primack, J.R. 1998, preprint (astro-ph/9802268v2)
- [117] Strauss, M.A., & Willick, J.A. 1995, Phys. Rep., 261, 271
- [118] Struck, C., & Smith, D.C. 1999, ApJ, accepted
- [119] Sugiyama, N. 1996, ApJS, 100, 281
- [120] Tinsley, B. 1980, Fundamental Cosmic Phys., 5, 287
- [121] Toomre, A. 1964, ApJ, 139, 1217
- [122] Tóth, G., & Ostriker, J.P. 1992, ApJ, 389, 5
- [123] Tully, R.B. 1988, Nearby Galaxies Catalog (Cambridge, U.P.)
- [124] Tully, B., Mould, J., & Aaranson, M. 1982, ApJ, 257, 527
- [125] Tully, R.B., & Verheijen, M.A.W. 1997, ApJ, 484, 145
- [126] van den Bergh, S., & Pierce, M.J. 1990, ApJ, 364, 444
- [127] van den Bosch, F.C. 1998, ApJ, 507, 601
- [128] _____., 1999, ApJ, accepted (astro-ph/9909298)
- [129] Verheijen, M.A.W. 1998, PhD. Thesis, Groningen University
- [130] Vishnavatan, N. 1981, A&A, 100, L20
- [131] Wang, B., & Heckman, T.M. 1996, ApJ, 457, 645 (WH96)
- [132] Weinberg, M. 1998, MNRAS, 299, 499
- [133] Weyl, M.L., Eke, V.R., & Efstathiou, G. 1998, MNRAS, 300, 773
- [134] White, S.D.M, & Frenk, C.S. 1991, ApJ, 379, 52
- [135] White, S.D.M., & Rees, M.J. 1978, MNRAS, 183, 341
- [136] Wyse, R. 1982, MNRAS, 199, 1P
- [137] Wyse, R.F.G., Gilmore, G., & Franx, M. 1997, ARA&A, 35, 637
- [138] Zaroubi, S., & Hoffman, Y. 1993, ApJ, 416, 410
- [139] Zwaan, M.A., van der Hulst, J.M., de Blok, W.J/G., & McGaugh, S.S. 1996, MNRAS, 273, 35
| \nodata | B-V | b/d | log | ||||
|---|---|---|---|---|---|---|---|
| 0.07 | 0.84 | 0.93 | 0.55 | 0.65 | 0.29 | 0.33 | |
| B-V | \nodata | 0.56 | 0.18 | 0.22 | 0.05 | 0.29 | 0.82 |
| \nodata | \nodata | 0.87 | 0.27 | 0.45 | 0.01 | 0.68 | |
| b/d | \nodata | \nodata | \nodata | 0.38 | 0.54 | 0.10 | 0.51 |
| \nodata | \nodata | \nodata | \nodata | 0.94 | 0.95 | 0.20 | |
| \nodata | \nodata | \nodata | \nodata | \nodata | 0.84 | 0.04 | |
| log | \nodata | \nodata | \nodata | \nodata | \nodata | \nodata | 0.34 |
(a) reflects the deviations of the models from the TFR
| \nodata | BV | b/d | log | |||||
|---|---|---|---|---|---|---|---|---|
| 0.44 | 0.24 | 0.17 | 0.27 | 0.9 | 0.92 | 0.98 | 0.25 | |
| 0.01 | 0.95 | 0.48 | 0.12 | 0.24 | 0.05 | 0.29 | 0.82 | |
| 0.86 | 0.07 | 0.81 | 0.88 | 0.13 | 0.23 | 0.51 | 0.34 |
(a) nominal present-day mass
(b) MAH parameter (see eq. 9)
(c) spin parameter