A Unified Scaling Law in Spiral Galaxies
Abstract
We investigate the origin of a unified scaling relation in spiral galaxies. Observed spiral galaxies are spread on a plane in the three-dimensional logarithmic space of luminosity , radius and rotation velocity . The plane is expressed as in -passband, where is a constant. On the plane, observed galaxies are distributed in an elongated region which looks like the shape of a surfboard. The well-known scaling relations, (Tully-Fisher relation), (also the Tully-Fisher relation) and (Freeman’s law), can be understood as oblique projections of the surfboard-like plane into 2-D spaces. This unified interpretation of the known scaling relations should be a clue to understand the physical origin of all the relations consistently. Furthermore, this interpretation can also explain why previous studies could not find any correlation between TF residuals and radius.
In order to clarify the origin of this plane, we simulate formation and evolution of spiral galaxies with the -body/SPH method, including cooling, star formation and stellar feedback. Initial conditions are set to isolated 14 spheres with two free parameters, such as mass and angular momentum. The CDM (, ) cosmology is considered as a test case. The simulations provide the following two conclusions: (a) The slope of the plane is well reproduced but the zero-point is not. This zero-point discrepancy could be solved in a low density () and high expansion () cosmology. (b) The surfboard-shaped plane can be explained by the control of galactic mass and angular momentum.
Subject headings:
galaxies : formation — galaxies : evolution — galaxies : kinematics and dynamics — galaxies : statistical1. INTRODUCTION
Luminosity , radius and rotation velocity are basic parameters for spiral galaxies. We have known the correlations between each two of them: the log-log (Tully & Fisher 1977; TF), log-log (also Tully & Fisher 1977) and log-log (Freeman 1970) correlations. These scaling relations provide an observational benefit to measure galaxy distances (e.g., Strauss & Willick 1995; Giovanelli et al. 1997), and also provide theoretical benchmarks to understand the structure, formation and evolution of spiral galaxies (e.g., Dalcanton, Spergel & Summers 1997; Silk 1997; Mo, Mao & White 1998).
There have been many efforts to search tighter correlations than these three. In order to improve the accuracy of distance estimation, a third-parameter effect on the TF relation, i.e. a correlation between TF residuals and a third parameter, have been sought by many authors (e.g., Willick et al. 1997; Courteau & Rix 1999). Most of them have concluded that the third-parameter effect may not be crucial, while Willick (1999) has found a slight dependence of TF residuals on surface brightness. On the other hand, principal component analyses have suggested that two parameters are necessary and sufficient to describe spiral galaxies (see Djorgovski 1992, for a review), in contrast to stars which are described by one parameter (mass). Kodaira (1989) has found that the correlation among all the three parameters, log, log and log, is much tighter than the correlations between each two of them. Koda & Sofue (2000) have recently found that spiral galaxies are distributed on a surfboard-shaped plane in the 3-D space (log, log, log). The 2-D scaling relations (-, -, -) can be understood uniformly as oblique projections of this surfboard-shaped plane. Koda & Sofue (2000) also argued that this unified scaling relation would be produced through galaxy formation which is affected by galactic mass and angular momentum.
Theoretically the importance of mass and angular momentum in the structure of spiral galaxies has, of course, been discussed by many authors (e.g., Fall & Efstathiou 1980; Kashlinsky 1982). Recently, the 2-D scaling relations (-, -, -) have been discussed as the products of galaxy formation which is controlled by mass and angular momentum (Dalcanton, Spergel & Summers 1997; Mo, Mao & White 1998; Koda, Sofue & Wada 2000). In this Letter, we discuss whether the unified scaling relation (plane) in the 3-D space can also be a product of mass and angular momentum. We take the -body/SPH approach which includes cooling, star formation and stellar feedback (see Tissera, Lambas & Abadi 1997; Weil, Eke & Efstathiou 1998; Steinmetz & Navarro 1999; Elizondo et al. 1999; Koda, Sofue & Wada 2000), and consider the formation of 14 galaxies with different masses and angular momenta. The simulated galaxies show internal structures as observed in spiral galaxies, e.g., the exponential density profile, flat rotation curve, and distributions of stellar age and metallicity. Using these simulated “spiral galaxies”, we try to confirm the origin of the unified scaling relation.
2. OBSERVATIONAL FACT
We briefly introduce the unified scaling relation in spiral galaxies. Throughout this Letter, we use the data set presented by Han (1992), which consists of member galaxies in 16 clusters. All the sample galaxies in each cluster are assumed to be at the same distance indicated by the systemic recession velocities of the host cluster, which are measured in the CMB reference frame (Willick et al. 1995). We assume , where is the present Hubble constant in units of . In order to select exact members of a cluster, we reject galaxies whose recession velocities deviate more than from the mean velocity of the cluster. We use total -band magnitude , HI velocity width and face-on -band isophotal radius . Final samples consist of 177 spiral galaxies.
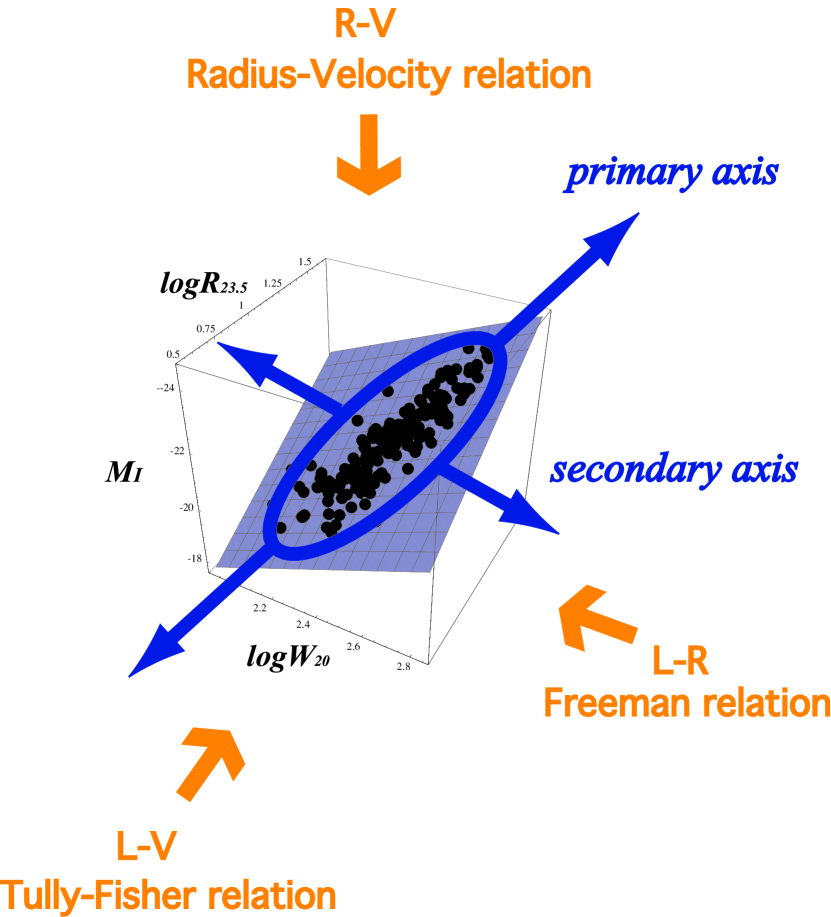
When we consider the 3-D space of luminosity , radius and rotation velocity , observed spiral galaxies are (i) distributed on a plane as and (ii) distributed in a surfboard-shaped region on the plane (Koda & Sofue 2000). Figure 1 schematically illustrates the situation with parameters of radius , velocity and absolute magnitude . Since the well-known 2-D scaling relations (, , ) can be understood uniformly as oblique projections of this surfboard-shaped plane (Figure 1), we hereafter call the plane the scaling plane. The upper panels of Figure 2 show the Tully-Fisher projection (left) and the edge-on projection (right) of the scaling plane. The edge-on projection has tighter correlation than the Tully-Fisher projection. The same plane can be found in the data sets of Mathewson et al. (1992) and Courteau (1999) as well. Note the , and relations themselves may also be found as the projections of a prolate (not thin plane) distribution in a 3-D space. However, the plane distribution unifies the scatters of these three 2-D correlations as well.
In the 3-D space, observed galaxies are spread in the range of the order of two for , and the several factors for and . Hence the scaling plane has exactly the elongated (surfboard) shape. The primary and secondary axes are schematically illustrated in Figure 1. We hypothesize (a) that the 2-D distribution implies the existence of two dominant physical factors in spiral galaxy formation, and (b) that one of them is more dominant than the other because of the surfboard shape.
3. NUMERICAL EXPERIMENT
3.1. Numerical Methods
We simulate formation and evolution of spiral galaxies by the -body/SPH method similar to Katz (1992) and Steinmetz & Müller (1994,1995). We use a GRAPE-SPH code (Steinmetz 1996), a hybrid scheme of the smoothed particle hydrodynamics and the -body integration hardware GRAPE-3 (Sugimoto et al. 1990). This code can treat the gravitational and hydrodynamical forces, radiative cooling, star formation and stellar feedback (see Koda, Sofue & Wada 2000 in details).
We take a phenomenological model of star formation. If a region is locally contracting and Jeans-unstable, stars are formed at a rate , where , , and are the local densities of stars and the gas, dynamical and cooling timescales, respectively. We set . We assume that massive stars with mass explode as type II supernovae and release energy (), mass and metals ( of total released mass on an average; see Nomoto et al. 1997a) into the surrounding gas at a constant rate in the first from their birth. They leave white dwarfs with mass after the explosion. And 15 % of the white dwarfs are assumed to result in type Ia supernovae (Tujimoto et al. 1995), which release energy (), mass () and metals ( of total released mass; see Nomoto et al. 1997b) into the surrounding gas. The number of the massive stars is counted with the initial mass function (IMF) of Salpeter (1955) and we set the lower and upper mass of stars to . The energy is released into the surrounding gas as thermal energy.
3.2. Initial Conditions
We consider 14 homogeneous spheres which are rigidly rotating, isolated, and overdense above the background field by . The spheres follow the reduced Hubble expansion at in the CDM cosmology (, and the rms fluctuation in spheres ). Small scale CDM fluctuations are superimposed on the considered spheres. We use the same realization (random numbers) of the fluctuations for all the 14 galaxies. Two free parameters, total mass and spin parameter , are (), (), (), and (). Since we consider collapses of isolated spheres, there is no infall of clumps at low redshift which causes an extreme transfer of angular momentum from baryons to dark matter (Navarro, Frenk & White 1995; Steinmetz & Navarro 1999).
The gas and dark matter are represented by the same number of particles, and their mass ratio is set to (Steinmetz & Müller 1995). The mass of a gas particle varies between and according to the system mass considered. The mass of a dark matter particle is between and . Low resolution may cause artificial heating due to two-body relaxation, however this range of particle mass is small enough to exclude the artificial heating effect (Steinmetz & White 1997). The gravitational softenings are taken to be for gas and star particles, and for dark matter.
4. RESULTS
We compute absolute magnitude of each “spiral galaxy” at with the simple stellar population synthesis models of Kodama & Arimoto (1997), and take the isophotal radius at the level in -band. The line-width is derived in a way similar to observation by constructing a line-profile of gas, and measuring the width at level of a peak flux. All the simulated galaxies have the exponential-light profile and the flat rotation curve (see Koda, Sofue & Wada 2000).
4.1. The Scaling Plane of Simulated Galaxies
In Figure 2, we compare the observed (upper panels) and simulated (lower panels) distributions of spiral galaxies in the TF projection (right panels) and edge-on (left panels) projection of the scaling plane. In the lower panels, the dotted lines represent the observed correlations (as do the solid lines in the upper panels), and we shift the zero-point of the solid lines to fit the simulations. The ranges of the figures are shifted between the upper and lower panels because of the systemic shift of simulated galaxies. The lengths of the axes, however, are exactly the same and we can compare the slope and scatter between the upper and lower panels.
In this figure, we find the following three points: (i) The slope and scatter of both correlations are well reproduced in the simulation. Note that the slope and scatter of and are also consistent with the observations. (ii) The edge-on projection of the simulated scaling plane shows a much better correlation than the simulated TF projection, similar to the observations. The simulations reproduce the slope and scatter of the scaling plane well. (iii) However, the distribution of simulated galaxies is systematically shifted from that of observed galaxies.
The systemic shift of the simulated distribution from the observed one amounts to in the 3-D space. This shift would result mainly from the adopted cosmology (, ), which could contribute to the shift in two ways: (a) The shifts the observed galaxies through distance estimation. If we change from 0.5 to 1, observed galaxies are shifted by , which are sufficient to explain the above shift. (b) The lower would increase the ratio of baryon to dark matter, and then, decrease the mass-to-light ratio. If we decrease , simulated galaxies would be shifted in the direction of and . [Note on the contrary, if we assume a lower baryon fraction in galaxies than the one adopted here, the simulated galaxies would be shifted in the opposite direction.]
In our simulations, the procedure of galaxy formation and evolution is not affected so much by changing the cosmology since we consider initial conditions of nearly monolithic collapse. Hence the comparison only in simulated galaxies would be possible even though the zero-point is shifted.
4.2. Origin of The Scaling Plane
As discussed in Section 2, the scaling plane has the primary and secondary axes. Here we show that these two axes of the simulated scaling plane correspond to galactic mass and angular momentum, respectively. In order for these two parameters to correspond to the primary and secondary axes exactly, they must satisfy the following three conditions: (a) The axes along these two parameters are on the scaling plane. (b) These axes are not parallel each other. (c) The axis along mass (angular momentum) is parallel to the primary (secondary) axis. In Figure 2, the lower-right panel shows the edge-on projection. All the simulated galaxies, which have different mass and angular momentum, lie on the same scaling plane. The condition (a) is satisfied. The axes along mass and angular momentum are illustrated in the lower-left panel of Figure 2 (see also Koda, Sofue & Wada 2000). In this TF projection, the axes along mass and angular momentum (spin parameter) are not parallel each other, which satisfies the condition (b). It is clear that the projections of the primary and secondary axes onto the TF plot are along the directions of mass and angular momentum, respectively, satisfying the condition (c). We conclude that the scaling plane is spread by the difference of primarily galactic mass and secondarily angular momentum.
The backbone of galactic scaling relations is the virial theorem. Most of parameters would be determined on the domination of galactic mass. However, if the mass is the only parameter which determines galactic properties, galaxies would be distributed on a line in the 3-D space. The secondary factor, spin parameter, causes a slight spread in properties of disk galaxies. Then, spiral galaxies are distributed on a particularly elongated (surfboard-shaped) plane in the 3-D space.
In fact, spin parameter (angular momentum) affects galactic properties in the following three ways: (i) Spin parameter changes the central concentration of disks in dark matter halos. Lower spin parameter produces relatively concentrated disks and leads to higher rotation velocities. (ii) Spin parameter changes the radius of spiral galaxies. Higher spin parameter produces galaxies with larger radii. (iii) Therefore higher spin parameter produces galaxies with lower surface densities, and then leads to slower star formation. It results in brighter galaxies at because of the relatively younger age of their stellar component. These three effects produce the scatters of the three scaling relations (, , ).
5. DISCUSSION
We have introduced the scaling plane (unified scaling relations) of observed spiral galaxies in the 3-D space of luminosity, radius and rotation velocity, and investigated a possible origin of the scaling plane. We have shown that mass primarily determines the galaxy position in the 3-D space, and angular momentum (spin parameter) produces a slight spread on the scaling plane. The scaling plane is originated in the galaxy formation process, controlled by these two factors, mass and angular momentum. In order to clarify the uniqueness of the origin, one could further consider (1) other cosmological models (Mo, Mao & White 1998), (2) different ratios of baryon to dark matter, (3) different mass aggregation histories (Avila-Reese et al. 1998), and (4) other modelings of star formation and feedback (Silk 1997).
Many studies have concluded that there is no correlation of TF residuals with radius and any other parameter. These results appear to be against the existence of the scaling plane. We should note, however, that the existence of the scaling plane does not imply a clear correlation between TF residuals and radius, when the plane contains any kind of scatter, e.g., observational errors or intrinsic one. The apparent discrepancy comes from a confusion of two facts, that is, spiral galaxies are distributed (i) on a plane, and (ii) in a surfboard-shaped region on it (see Section 2). The definition of TF residuals are affected by the property (ii). If the surfboard-shaped region rotates on the same plane, the TF relation (proejcted relation) will be changed in its slope, zero-point and ’the definision of residuals’ as well (cf. Figure 1). Hence the correlation of TF residuals with radius is strongly affected by the property (ii), i.e., how galaxies are distributed on the plane, and if the plane contains any kind of scatter such as errors in observation, the combination of the property (ii) and the scatter could hide the property (i), i.e., the existence of the scaling plane.
Still, the scaling plane implies correlations of each scaling relation (, , ) with surface brightness, at least in normal galaxies. It is interesting to investigate whether low surface brightness (LSB) galaxies are also distributed on the scaling plane. Zwaan et al. (1995) discussed that LSB galaxies lie on the same TF relation as normal galaxies, while O’Neil, Bothun & Schombert (1999) have concluded that their sample of LSB galaxies does not produce the TF relation. So, the question is still under debate, and further researches would be necessary to discuss LSB galaxies in analyses of the scaling plane. There have been studies which concluded that the Freeman’s law would be an artifact due to observational selection effects, because LSB galaxies deviate from the luminosity-radius relation of normal galaxies (recently, de Jong 1996; Scorza & van den Bosch 1998). The scaling plane is so tight that the plane itself would not be an artifact due to selection effects. However, the galaxy distribution on the plane may change, if selection effects affect the sample. LSB galaxies may provide a clue to understand such selection effects, if they are the sequence of normal galaxies.
References
- (1) Avila-Reese, V., Firmani, C. and Hernández, X. 1998, ApJ, 505, 37.
- (2)
- (3) Courteau, S. 1999, astro-ph/9903297.
- (4)
- (5) Courteau, S. and Rix, H.W. 1999, ApJ, 513, 561.
- (6)
- (7) Dalcanton, J., Spergel, D.N. and Summers, F.J. 1997, ApJ, 482, 659.
- (8)
- (9) de Jong, R.S. 1996, A&A, 313, 45.
- (10)
- (11) Djorgovski, S. 1992, in Morphological and Physical Classification of Galaxies, eds. Longo et al., p.337. Kluwer Academic Publishers.
- (12)
- (13) Elizondo, D., Yepes, G., Kates, R., Müller, V. and Klypin, A. 1999, ApJ, 515, 525.
- (14)
- (15) Fall, S.M. and Efstathiou, G. 1980, MNRAS, 193, 189.
- (16)
- (17) Freeman, L.C., 1970, ApJ, 160, 811.
- (18)
- (19) Giovanelli, R., Haynes, M.P., Salzer, J.J., Wegner, G., d a Costa, L.N. and Freudling, W. 1998, AJ, 116, 2632.
- (20)
- (21) Han, M. 1992, ApJS, 81, 35
- (22)
- (23) Kashlinsky, A. 1982, MNRAS, 200, 585.
- (24)
- (25) Katz, N. 1992. ApJ, 391, 502.
- (26)
- (27) Koda, J. and Sofue, Y. 2000, submitted to ApJ.
- (28)
- (29) Koda, J., Sofue, Y. & Wada, K. 2000, ApJ, 532, 1.
- (30)
- (31) Kodaira, K. 1989, ApJ, 342, 122. (K89)
- (32)
- (33) Kodama, T. and Arimoto, N. 1997, A&A, 320, 41
- (34)
- (35) Mathewson, D.S., Ford, V.L. and Buchhorn, M. 1992, ApJS, 81, 413.
- (36)
- (37) Mo, H.J., Mao, S. and White, S.D.M. 1998, MNRAS, 295, 319
- (38)
- (39) Navarro, J.F., Frenk, C.S. and White, S.D.M. 1995, MNRAS, 275, 56.
- (40)
- (41) Nomoto, K. et al. 1997a, Nuclear Physics, A616, 79c
- (42)
- (43) Nomoto, K. et al. 1997b, Nuclear Physics, A621, 467c
- (44)
- (45) O’Neil, K., Bothun, G.D. and Schombert, J. 1999, preprint.
- (46)
- (47) Salpeter, E.F. 1955, ApJ, 121, 161
- (48)
- (49) Scorza, C. and van der Bosch, F.C. 1998, MNRAS, 300, 469.
- (50)
- (51) Silk, J. 1997, ApJ, 481, 703
- (52)
- (53) Steinmetz, M. 1996, MNRAS, 278, 1005
- (54)
- (55) Steinmetz, M. & Müller, E. 1994, A&A, 281, L97
- (56)
- (57) Steinmetz, M. & Müller, E. 1995, MNRAS, 276, 549
- (58)
- (59) Steinmetz, M. & Navarro, J.F. 1999, ApJ, 513, 555
- (60)
- (61) Steinmetz, M. & White, S.D.M. 1997, MNRAS, 288, 545
- (62)
- (63) Sugimoto, D., Chikada, Y., Makino, J., Ito T., Ebiszaki, T. and Umemura, M. 1990, Nature, 345, 33
- (64)
- (65) Tissera, P.B., Lambas, D.G. and Abadi, M.G. 1997, MNRAS, 286, 384.
- (66)
- (67) Tully, R.B. and Fisher, J.R. 1977, A&A, 54, 661
- (68)
- (69) Weil, M.L., Eke, V.R. and Efstathiou, G. 1998, MNRAS, 300, 773.
- (70)
- (71) Willick, J.A., Courteau, S., Faber, S.M., Burstein, D., Dekel, A. 1995, ApJ, 446, 12
- (72)
- (73) Willick, J.A., Courteau, S., Faber, M., Burstein, D., Dekel, A. and Strauss, M.A. 1997, ApJS, 109, 333.
- (74)
- (75) Willick, J.A. 1999, ApJ, 516, 47.
- (76)
- (77) Zwaan, M.A., van der Hulst, J.M., de Block, W.J.G. and McGaugh, S.S. 1995, MNRAS, 273, L35.
- (78)