Irradiation of the secondary star in X-ray Nova Scorpii 1994 (=GRO J1655–40)
Abstract
We have obtained intermediate resolution optical spectra of the black-hole candidate Nova Sco 1994 in June 1996, when the source was in an X-ray/optical active state (15.05). We measure the radial velocity curve of the secondary star and obtain a semi-amplitude of 27910 km s-1; a value which is 30 per cent larger than the value obtained when the source is in quiescence. Our large value for is consistent with 60 per cent of the secondary star’s surface being heated; compared to 35 per cent, which is what one would expect if only the inner face of the secondary star were irradiated. Effects such as irradiation-induced flows on the secondary star may be important in explaining the observed large value for .
keywords:
accretion, accretion discs – binaries: close – stars: individual: X-ray Nova Sco 1994 (GRO J1655–40) – X-rays: stars.1 Introduction
The soft X-ray transients, a subclass of the low-mass X-ray binaries distinguished by their X-ray outbursts, have proved to be an ideal hunting ground for stellar-mass black hole candidates (Tanaka & Shibazaki 1996). The system Nova Sco 1994 (=GRO J1655–40) is particularly interesting, since as well as being a source of superluminal jets (Zhang et al., 1994; Harmon et al., 1995), its optical brightness and partial eclipse features mean that it is one of the few systems that has yielded a reliable estimate for the mass of the collapsed star.
Nova Sco 1994 was discovered on July 27 1994 with BATSE on board the Compton Gamma Ray Observatory (Zhang et al., 1994). It has been studied extensively during the past few years in X-rays and at optical and radio wavelengths (Bailyn et al., 1995a and b, Zhang et al., 1995, van der Hooft et al. 1998). Strong evidence that the compact object in Nova Sco 1994 is a black hole was presented by Bailyn et al. (1995b) who initially established a spectroscopic period of days, classified the secondary as an F2–F6 type star and suggested a mass function =3.160.15 M⊙. An improved value of =3.240.09 M⊙ was presented by Orosz & Bailyn (1997) using both quiescent and outburst data, derived from a radial velocity semi-amplitude of 228.22.2 km s-1. Shahbaz et al. (1999) using only quiescent data, determined the true radial velocity semi-amplitude =215.52.4 km s-1which gives a revised value for the mass function of = 2.730.09 M⊙. They also measured the rotational broadening of the secondary star which then gives the binary mass ratio (=M2/M1, where M1 and M2 are the masses of the compact object and secondary star respectively).
The effect of heating of the secondary is to shift the ‘effective centre’ of the secondary, weighted by the strength of the absorption lines, from the centre of mass of the star. One expects that this results in a significant distortion of the radial velocity curve and renders a sinusoidal fit clearly inadequate, leading to a spuriously high radial velocity semi-amplitude. In order to quantify this effect we have determined the radial velocity variations of the secondary star in Nova Sco 1994, when it was in outburst and compared our results with others obtained using data taken when the source was in different X-ray states.
2 Observations and Data reduction
2.1 Spectroscopy
Intermediate resolution optical spectra of Nova Sco 1994 were obtained on 1996 June 20–24 with the 1.54-m Danish Telescope at the European Southern Observatory (ESO) in Chile using the Danish Faint Object Spectrograph and Camera (DFOSC). We used grating #8 which gave a dispersion of 1.26 Å per pixel and a wavelength coverage from 5865–8336Å. The Loral 20482048 CCD was used, binned by a factor two in the spatial direction in order to reduce the readout noise, but not binned in the dispersion direction. The seeing during the observations was poor and variable (see section 2.2) so we used a slit width of on the first night and then for the other nights. This resulted in spectral resolutions of 7.6 Å and 5.5 Å for the first and other nights respectively. Wavelength calibration was performed using a Cu-Ar arc. A total of 47 spectra were taken each having exposure times of 1800s (see Table 1 for details).
The data reduction and analysis was performed using the Starlink figaro package, the pamela routines of K. Horne and the molly package of T. R. Marsh. Removal of the individual bias signal was achieved through subtraction of a median bias frame. Small scale pixel-to-pixel sensitivity variations were removed with a flat-field frame prepared from observations of a tungsten lamp. One-dimensional spectra were extracted using the optimal-extraction algorithm of Horne (1986), and calibration of the wavelength scale was achieved using 5th order polynomial fits which gave an rms scatter of 0.03 Å. The stability of the final calibration was verified with the OH sky line at 6300.3Å whose position was accurate to within 0.1 Å.
2.2 Photometry
Using the same setup as for the spectroscopy, we also obtained limited Bessell -band images of Nova Sco 1994 every night. The data were debiased using a median bias frame, but not flat-fielded, as none were taken. These images were used to estimate the seeing each night (see Table 1). We applied aperture photometry to Nova Sco 1994 and several nearby comparison stars within the field of view. Johnson - and -band magnitudes of these comparison stars were made available to us by J. Orosz. We determined the relative magnitude of Nova Sco 1994 with respect to three stars having a range of colours [()=0.49, 0.77 and 1.23]. Assuming that the colour correction between the two filter systems is small (0.05 mags; similar to the accuracy of our photometry) and that Nova Sco 1994 has a colour in the same range as the comparison stars used, we estimate 15.05 for Nova Sco 1994.
| Night | of spectra | seeing () | Orbital phase |
|---|---|---|---|
| covered | |||
| Night 1 | 11 | 2.0 | 0.722–0.834 |
| Night 2 | 5 | 2.6 | 0.100–0.225 |
| Night 3 | 11 | 2.3 | 0.501–0.592 |
| Night 4 | 10 | 1.6 | 0.883–0.964 |
| Night 5 | 10 | 3.0 | 0.270–0.353 |
| Night | Orbital phase | EW (Å) |
|---|---|---|
| Night 1 | 0.78 | 9.80.5 |
| Night 2 | 0.16 | 11.90.3 |
| Night 3 | 0.54 | 10.60.4 |
| Night 4 | 0.93 | 3.8010 |
| Night 5 | 0.32 | 10.40.8 |
3 The spectra of Nova Sco 1994
In Figure 1 we show the variance-weighted average and also the nightly averages of the Nova Sco 1994 spectra. A strong H emission line (mean equivalent width of 7.50.06Å) and a much weaker He 6678Å (equivalent width of 0.40.03Å) can be seen. In Table 2 we list the H equivalent width for the nightly averages. The Fe absorption blend at 6485, 6496, 6499, 6502Å is also visible. These features are used to determine the radial velocity of the secondary star (see section 4). The 6613Å diffuse interstellar band is also present.
The emission lines in Nova Sco 1994 are double-peaked, which is presumably a consequence of the system being at high inclination. We can compare the observed peak-to-peak half separation of the H emission line (which arises from the accretion disc) with the projected velocity of the outer disc edge. In a binary system with a mass ratio 0.25 it is generally assumed that the accretion disc cannot grow larger than the tidal truncation radius, (Paczynski 1977; Whitehurst 1988; Osaki, Hirose & Ichikawa 1993), which is approximately given by for 0.03 1, where is the binary separation (Warner 1995). Given the system parameters (=2.62168 days; ; degrees; 6.7 see Shahbaz et al., 1999) the minimum value for the projected velocity of the accretion disc rim is 394 km s-1. The observed peak-to-peak half separation of the H emission line (see Figure 1) in late June 1996 is 385 km s-1(measured by fitting the profile with a double Gaussian), which implies that the accretion disc is close to its maximum possible size. Soria et al. (1998) estimate the H half peak-to-peak separation to be 350/2 km s-1and 550/2 km s-1for their August/September 1994 and June 1996 H observations respectively, velocities much lower than expected, suggesting that the H emission line arises from non-Keplerian regions/flows in the accretion disc.
4 The radial velocity of the secondary star
The radial velocities of the F-type secondary star in Nova Sco 1994 were measured from the spectra by the method of cross-correlation (Tonry & Davis 1979) with a template star. Prior to cross-correlation the spectra were interpolated onto a logarithmic wavelength scale (pixel size 55 km s-1) using a interpolation scheme to minimize data smoothing (Stover et al. 1980), and then normalised. The template star spectrum (HR2906; F6) was then artificially broadened by 90 km s-1(Shahbaz et al., 1999) to account for the rotational velocity of the secondary star. Note that the orbital smearing of the Nova Sco 1994 spectra through the 1800s exposure is at most only 10 km s-1, much less than the resolution of the data. Only regions of the spectrum devoid of emission lines (6400-6520Å) were used in the cross-correlation. The radial velocity of the template star (derived using the position of the H absorption line to be 7 km s-1) was then added to the radial velocities of Nova Sco 1994.
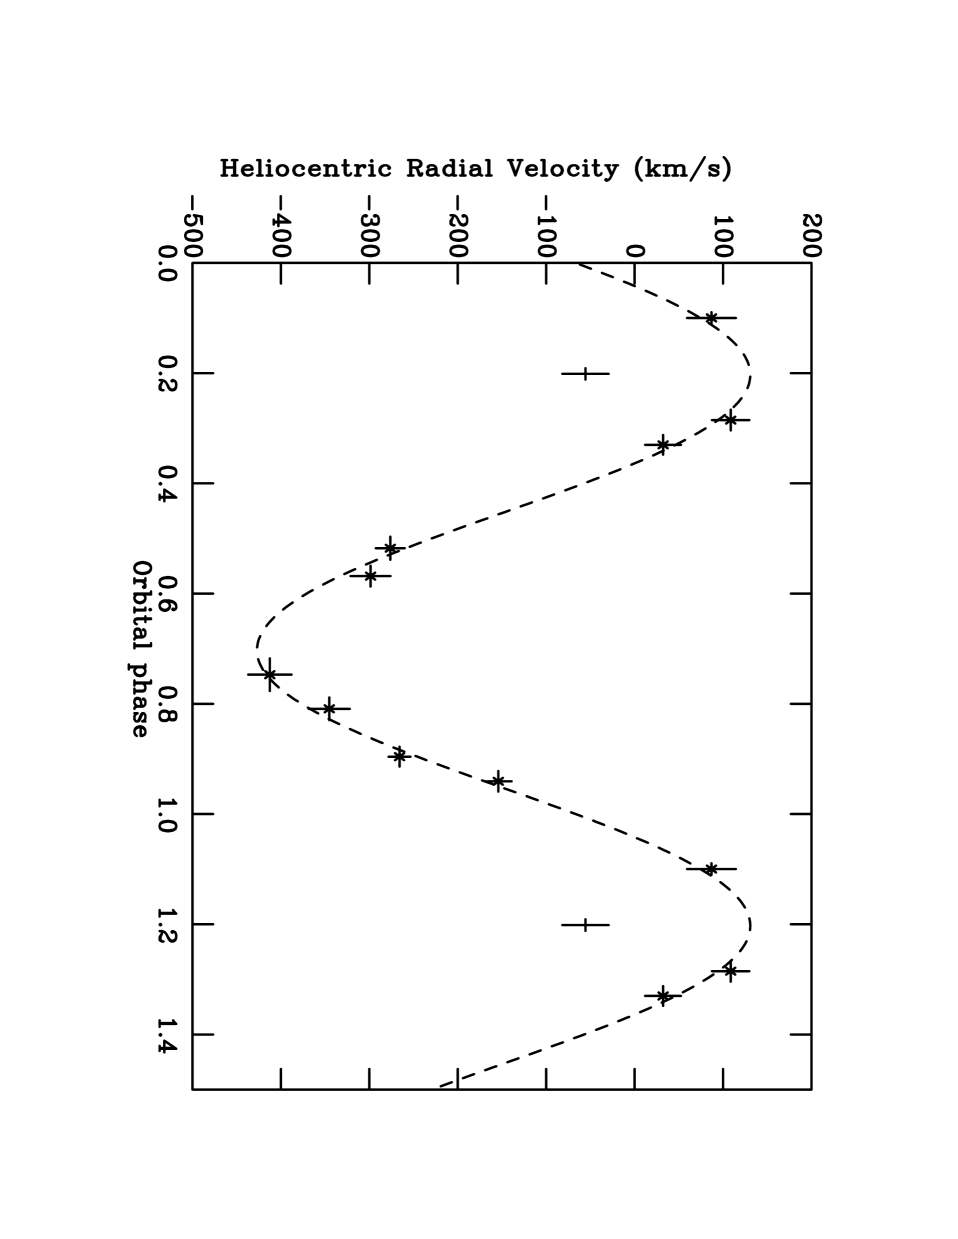
Using the orbital ephemeris given by van der Hooft et al (1998) we phase-folded and binned the heliocentric radial velocities (see Figure 2). From figure 2, it can be seen that the radial velocity measurement at phase 0.2 does not fit the general pattern of the sinusoidal modulation present in the data. This data point was the total of three radial velocity measurements taken on the second night (21st June 1996). Although the seeing and quality of the spectra taken during this night were not as good as the others, no obvious reason could be found as to why these spectra gave much lower radial velocities than expected. A sine wave fit to all the data points does not give an adequate fit (=6.9). However, removing the discrepant data point and then performing a sine wave fit yields a of 1.5, a semi-amplitude km s-1, systemic velocity and a phase shift of (1- errors are given). We also fitted the radial velocity curve with an eccentric orbit, but found the fit to be less than 50 percent significant.
| power-law index | Corrected | ||
|---|---|---|---|
| (km s-1) | (erg s-1) | (erg s-1) | |
| 215.5 | ASCA (1-10 keV) | 1.5 | |
| 232 | BATSE (20-350 kev) | 2.8 | |
| 279 | RXTE (2–12 keV) | 2.8 |
5 The effect of irradiation on the secondary star’s radial velocity
Three absorption line radial velocity curves have been obtained for Nova Sco 1994, using the same absorption features of the F6 secondary star and the standard method of cross-correlation. However, in each case the system was observed to be in a different X-ray state. A sinusoidal fit to the outburst data taken in April/May 1995 of Orosz & Bailyn (1998) gives a radial velocity semi-amplitude of =230 km s-1. During this period BATSE did not detect the source, so we can only put an upper limit of 2.41036 erg s-1(0.03 photons erg cm-2 s-1 in the BATSE 20-350 keV energy range) to the X-ray luminosity of the source. This upper limit alone does not allow us to state unequivocally that the source was not active at X-ray energies, but optical observations suggest that the source was not in quiescence (=16.5; Orosz & Bailyn 1998). In section 4 we determined =279 km s-1from data taken in June 1996 when RXTE ASM (2-12 keV) observations give an X-ray luminosity of =6.81037 erg s-1, and the -band brightness was 1 mag brighter than its quiescent value. The BATSE (20–350 keV) count rate was at least a factor of 4 higher than in April/May 1995. Shahbaz et al. (1999) determined the true radial velocity of the secondary star (=215.5 km s-1) in 1998 May/June, when the source was finally in optical quiescence. The only X-ray quiescent observations were obtained during March 1996 using ASCA (1-10 keV; Robinson et al., 1997) which gave =21032 erg s-1.
In Figure 3 we show the observed radial velocity amplitudes relative to the quiescent value as a function of the observed X-ray luminosity at the time of the measurements. We have converted the X-ray luminosities, which were observed with different instruments, into a common energy range (0.4–10 keV) using a hydrogen column density of cm-2 and a photon power-law model with indices 2.8 and 1.5 for the X-ray high and quiescent states respectively (see Table 3; Zhang et al., 1997; Robinson et al., 1997; Hameury et al., 1997). This energy range is where we expect the total radiated power for X-ray transients in both outburst and quiescence to lie (Chen, Shrader & Livio 1997). Note that there is a correlation between X-ray luminosity and the observed radial velocity semi-amplitude; the higher the X-ray luminosity the larger the observed radial velocity semi-amplitude, exactly as expected. We can use our model to estimate the X-ray luminosity at the time when Orosz & Bailyn (1997) took their radial velocity measurements. We find erg s-1which is consistent with the BATSE upper limit.
6 Irradiation of the secondary star
It has been known for some time, especially in studies of dwarf novae and polars, that substantial heating of the secondary star shifts the effective centre of the secondary, weighted by the strength of the absorption lines, from the centre of mass of the star. This results in a significant distortion of the radial velocity curve leading to a spuriously high semi-amplitude and a radial velocity curve that may be eccentric. Davey & Smith (1992) describe a procedure for detecting the effects of irradiation on the radial velocity curve of the secondary star, whereby one tests the significance of an eccentricity in the orbital solution. However, it should be noted that, although our data does not allow this eccentricity test, due to the poor orbital phase coverage, we can use the spuriously high radial velocity semi-amplitude to show that X-ray heating is present.
In order to investigate the effects of X-ray heating on the secondary star’s radial velocity curve we used the model described by Phillips, Shahbaz & Podsiadlowski (1999). The model uses a crude treatment for X-ray heating, since no satisfactory robust model exists for the effects of external heating in stars. However, it serves to illustrate the extreme effects of X-ray heating. It should be noted that the first order model of X-ray heating by Brett & Smith (1993), which does not include energy transport effects, does show that the whole temperature structure of the outer layers of the secondary is upset by external heating. Figure 3 shows the effects of different amounts of X-ray luminosity on the secondary star’s radial velocity amplitude. is computed by fitting the predicted curve with an eccentric orbit. The regions on the secondary star that are heated do not contribute to the absorption line flux. The maximum possible change that irradiation can have on , based purely on geometry, is 15 per cent. However, from our data presented in this paper, we observe =0.300.05, which when compared with maximum possible value based on geometry, is significant at the 3- level.
In Figure 4 we show how much of the secondary star’s surface needs to be heated in order to produce the observed radial velocity amplitude. We find that based purely on geometry 35 per cent of the secondary star’s surface is directly heated by X-rays produced at the compact object. (This fraction only depends on the shape and size of the secondary star, which in turn is determind by the . Using the extreme values for (Shahhaz et al., 1999), we find that this fraction changes by less than 1 per cent.) However, in order to produce the observed large radial velocity semi-amplitude, 60 per cent of the secondary star needs to be heated. The 1- uncertanties quoted here were estinated using the 1- uncertanties in . This result may seem surprising at first, since one expects only the regions of the secondary star facing the compact object to be irradiated and yet our result implies that some of the regions not directly seen by the compact object are also affected by irradiation. However, one should note that effects such as X-ray scattering and irradiation-induced flows on the surface of the secondary star (Phillips & Podsiadlowski 1999) can increase the fraction of the secondary star that responds to the X-ray source. Note that the regions on the secondary star that are shadowed by the accretion disc will be indirectly heated by such mechanisms. Therefore can be larger than that expected from heating the inner face of the secondary star alone.
7 Discussion
The existence of circulation in rotating stars was first proved in 1924 by von Zeipel (von Zeipel 1924). He demonstrated that for a rotating homogeneous star, the radiative transport equation and equation of conservation of energy cannot be fulfilled simultaneously. This results in the formation of meridional motions. In order to maintain a stationary state as assumed, one has to demand that these meridional motions contribute to the energy transport. In the case of an irradiated rotating star, the situation is still more complicated, since the radiation will induce additional circulation currents.
Evidence for the existence of significant irradiation-driven circulation is provided by several sources. For example, the analysis of the optical light curve of HZ Herculis has shown this to be heated by its accompanying X-ray source HER X-1. Although the main features of the optical light variation are well understood (HZ Her is bright when the X-ray source is in front of it, its brightness is reduced during the occultation of the X-ray source by the secondary), the minimum at phase 0.0 is sharper than expected and indicates some additional source of optical radiation at this phase. Strittmatter et al. (1973) tried to explain this via the illumination of the disk by HZ Her. Other attempts were made by Pringle (1973) and Bahcall, Joss & Avni (1974). However, the most successful explanation was due to Kippenhahn & Thomas (1979). They estimated the energy transported from the X-ray illuminated part of the stellar surface to the shadowed side, and demonstrated that the minimum at phase 0.0 could be reasonably well accounted for (X-ray heating without horizontal transport leads to a flat minimum at phase 0.0).
In addition, Schandl et al. (1997) found circulation to be necessary in order to accurately model the optical light curve of CAL 87, an eclipsing supersoft X-ray source. They calculated the light curve based on the assumption that an accreting, steadily burning white dwarf irradiates the accretion disk and the secondary star, as suggested by van den Heuvel et al. (1992). A simple description of energy transport on the secondary surface was used and then integrated over the whole surface, while conserving the total luminosity. They found that significant energy transport of the irradiated flux to non-illuminated parts on the secondary surface is required to simulate the observed lightcurve, particularly around the primary eclipse, when the shadowed hemisphere of the secondary is in view.
Recent models for irradiation-induced flows in binary stars have been computed by Martin & Davey (1995). They considered circulation in gently-heated secondary stars (where the incident flux is less than the intrinsic flux). Their 2-dimensional calculations included the effects of the Coriolis force and showed upwelling of hot material being carried preferentially towards the direction of rotation of the star. They also concluded that all secondary stars should show asymmetric heating, because of the presence of Coriolis forces. Phillips (1999) has recently extended the study of circulation to 3-dimensions. As well as including the effects of X-ray irradiation i.e. the anisotropic heating of the irradiated surface, and the effects of surface radiation stress, he also considers the large-scale effects of the rotation of the system and includes an approximate treatment of the Coriolis force. His results suggest a realistic analysis of the Coriolis force is essential for a full description of stellar circulation.
In order to study the extent of irradiation of the secondary star one requires good quality spectrophotometric studies throughout an X-ray outburst, during which the level of X-ray irradiation and induced heating changes. This will allow the surface intensity distribution across the secondary star to be mapped (see Rutten & Dhillon 1994 and Davey & Smith 1996), from which effects such as irradiation-induced circulation or star-spots can be investigated.
Acknowledgements
We would like to thank the referee, Prof. Robert Smith for useful comments.
References
- [1] Bahcall J.N., Joss B.C., Avni Y., 1974, ApJ, 191, 211
- [2] Bailyn C.D. et al., 1995a, Nat, 374, 701
- [3] Bailyn C.D., Orosz J.A., McClintock J.E., Remillard R.A., 1995b, Nat, 378, 157
- [4] Brett J.M., Smith R.C., 1993, MNRAS, 264, 641
- [5] Chen W., Shrader C.R., Livio M., 1997, ApJ, 491, 312
- [6] Davey S.C., Smith R.C., 1992, MNRAS, 257, 476
- [7] Davey S.C., Smith R.C., 1996, MNRAS, 280, 481
- [8] Hameury J.-M., Lasota J.-P., McClintock J.E., Narayan R., 1997, 489, 234
- [9] Harmon B.A., et al., 1995, IAU Circ. 6205
- [10] Horne K., 1986, PASP, 98, 609
- [11] Kippenhahn R., Thomas H.C., 1979, A&A, 75, 281
- [12] Martin T.J., Davey S.C., 1995, MNRAS, 275, 31
- [13] Orosz J.A., Bailyn C.D., 1997, ApJ, 477, 876
- [14] Osaki Y., Hirose M., Ichikawa S., 1993, in Accretion Disks in Compact Stellar Systems, ed J.C., Wheeler (Singapore, World Scientific, 272
- [15] Paczynski B., 1977, ApJ, 216, 822
- [16] Phillips S.N., Shahbaz T., Podsiadlowski Ph., 1999, MNRAS, 304, 839
- [17] Phillips S.N., Podsiadlowski Ph., 1999, MNRAS, in prep.
- [18] Phillips S.N., 1999, D.Phil thesis, University of Oxford.
- [19] Pringle J.E., 1973, Nature, 243, 90
- [20] Robinson C., et al., 1997, ApJ, in prep.
- [21] Rutten R., Dhillon V.S., 1994, A&A, 288, 773
- [22] Schandl S., Meyer-Hofmeister E., Meyer F., 1997, A&A, 318, 73,
- [23] Shahbaz T., van der Hooft F., Casares J., Charles P.A., van Paradijs J., 1999, MNRAS, 306, 89
- [24] Soria R., Wickramasinghe D.T., Hunstead R.W., Wu K., 1998, ApJ, 495, L95
- [25] Stover, R.L., Robinson, E.L., Nather, R.E., Montemayer, T.J., 1980, ApJ, 240, 597
- [26] Strittmatter P.A., Scott J., Whelan J., Wickramasinghe D.T., Woolf N.J., 1973, A&A, 25, 275
- [27] Tanaka Y., Shibazaki N., 1996, ARA&A, 23, 607
- [28] Tonry, J., Davis, M., 1979, AJ, 84, 1511
- [29] van den Heuvel E.P.J., Bhattacharya D., Nomoto K., Rappaport S., 1992, A&A, 262, 97
- [30] van der Hooft F. et al., 1998, A&A, 329, 538
- [31] von Zeipel H., 1924, MNRAS, 84, 665
- [32] Warner B., 1995, in Cataclysmic Variables Stars, Cambridge University Press, Cambridge, 57
- [33] Whitehurst R., 1988, MNRAS, 232, 35
- [34] Wilson C.A., Harmon B.A., Zhang S.N., Paciesas W.S., Fishman G.J., 1995, IAU Circ. 6152.
- [35] Zhang S.N., Wilson C.A., Harmon B.A., Fishman G.J., Wilson P.B., Paciesas W.S., Scott M., Rubin B.C., 1994, IAU Circ. 6046
- [36] Zhang S.N., Harmon B.A., Paciesas W.S., Fishman G.J., 1995, IAU Circ. 6209
- [37] Zhang S.N. et al., 1997, ApJ, 479, 381