Spectra of High Redshift Galaxies using a Cluster as a Gravitational Telescope
1 1E 0657 and the Gravitational Telescope Idea
Tucker et al. (1998) identified the extended Einstein source 1E 0657 with a cluster of galaxies at a redshift of , showing a velocity dispersion, measured from 13 galaxies, of . X-ray data from ROSAT and ASCA indicate that merging of at least two subclusters occurs in this highly luminous cluster. Tucker et al. (1998) derive a temperature of the hot gas in 1E 0657 111 Yaqoob (1998) reanalyzed the X-ray data and derived a temperature of only , which, however, still makes it one of the hottest clusters known yet., which makes it the hottest cluster known so far. The total mass of 1E 0657 within 1 Mpc, derived from the X-ray data, is about .
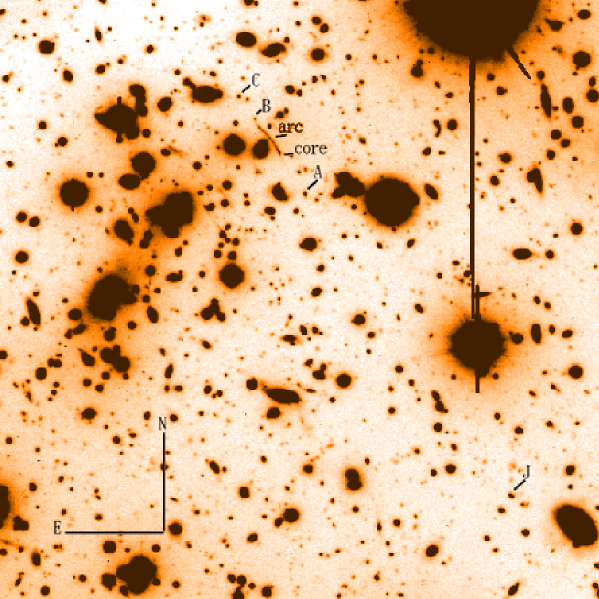
Most important for our project is the fact that optical images of 1E 0657 show the presence of a large gravitational arc NW of the main cluster’s center. Figure 1 and 2 shows part of an R-band image obtained with the Focal Reducer Spectrograph (FORS) at the Very Large Telescope (VLT) during the FORS commissioning time in December 1998 to test the imaging properties of the instrument (Appenzeller et al. 1999). The gravitational arc itself is visible above and to the left of the image center. It has a length of and a width , which is of the order of the seeing FWHM. We distinguish a pure “arc” of length, as the part of the source extremely stretched by the lensing effect, and a “core” at its SW end, which lies outside the caustic and is mapped into one fairly undistorted but still magnified image. Using a simple lens model for the cluster, we derived a magnification of the original background sources (probably situated at high redshift) of in flux. Hence the galaxy cluster 1E 0657 acts as a very efficient gravitational telescope (Fort, Mellier, Dantel-Fort 1997), brightening distant background sources by up to 3 mag.
2 Spectroscopic Observations
Since the arc in the images of 1E 0657 was suspected to be a galaxy at high redshift, magnified by the galaxy cluster, we obtained long-slit spectra of the arc (see Figure 1) with FORS in December 1998 to determine its redshift. Using the grism 150I and a slit width of we covered the spectral range from Å with a spectral scale of 5.6 Å/pixel. In total we gathered 1.5 h of exposure time with a seeing of about and reached a signal-to-noise (s/n) of 7 for the of the arc itself and 5 for the of the core image at its SW end. Moreover, we obtained the spectra of some other interesting objects that also happened to fall on the slit by chance coincidence.
Standard reduction (bias subtraction, correction for flat field variation, cosmic ray elimination) as well as rebinning to the observed wavelength was applied to all obtained spectra, using MIDAS routines.
3 Spectra and Preliminary Results
Figure 2 shows the rest frame spectra of the “arc” and the “core” image. The most prominent feature in both spectra is the Lyα absorption line from which we derived a redshift of . It is obvious that the two spectra have, in fact, their origin in the same background source, being rich in hot stars. From the ratios of some of the metallic lines indicated in Figure 2 we estimate that the metallicity of the dominating stellar population should be low.

Figure 3 shows the spectrum of object B, which lies only a few arcsec NE of the arc. It is obvious that object B does not belong to the arc system. From this fact and the two-dimensional flux distribution of the arc we conclude that the arc is a so-called “cusp arc”, similar to the case of A370 (Fort, Mellier 1994). Since the s/n of object B’s spectrum is only about 3, the estimated redshift is rather uncertain.

Due to the lens magnification we expect that near the critical line (i.e., the arc), galaxies have higher redshifts than galaxies of the same brightness in the field (for example, Franx et al. 1997). In fact, objects A ( SW of the arc) and C ( NE of the arc) also turned out to be young distant galaxies (Figure 4). Again the most dominant feature is the Lyα absorption line, which leads to redshifts of and , respectively. From the continuum slope redwards of Lyα we estimate the temperature of the hottest O stars in Object A to be about , strongly depending on the presence of UV extinction due to intrinsic dust. In object C Lyα may have a weak emission component.

Most surprisingly even at a distance of SW from the arc we find another high redshift object (J; Figure 5), which either is coincident by chance or points to a large extent of the total cluster mass. The latter is not implausible since the subclumps of the cluster are spread over almost the whole field of view. Again the Lyα absorption line is the dominant feature in the spectrum of object J, giving a redshift of . Object J also shows Lyα emission, and from the continuum slope redwards of Lyα we estimate the temperature of its hottest O stars to be about , again strongly dependent on the presence of intrinsic UV extinction.

As a first attempt to model the observed spectra, we have calculated the spectrum of a 25000 K main sequence star with a metallicity of 1/5 solar and a mass loss rate of , which Figure 6 shows overlaid on object J’s spectrum. To account for both galactic and intrinsic reddening, we have dereddened the observed spectrum using Howarth’s (1983) analytical expression for galactic extinction with (Burstein and Heiles 1984) prior to blueshifting, and reddened the synthetic spectrum using the LMC extinction law with (the latter value is, of course, a fit parameter). Apart from Hydrogen (with a column density of at the same assumed redshift as the observation, i. e., the rest frame of the stellar spectrum) we have not yet added interstellar absorption lines to the synthetic spectrum.
| Object | s/n | magnification | intr. exposure | ||
|---|---|---|---|---|---|
| (mag) | (mag) | (mag) | time (s/n ) | ||
| arc/core | 21.5 | 5/7 | 3 | 24.5 | 10 h |
| A | 22.7 | 4 | 1–2 | 23.7–24.7 | 2–14 h |
| C | 23.2 | 3 | 2.5 | 25.7 | 85 h |
| J | 22.3 | 7 | 0.8–2 | 23.1–24.3 | 1–7 h |
| B | 23.8 | 3 | 1–2 | 24.8–25.8 | 17–110 h |
In Table 1 we list the observed R-band magnitudes of the objects investigated spectroscopically. Additionally we list the magnification of the background sources due to the gravitational lens as well as the R-band magnitudes that would be observed in the absence of gravitational amplification. To demonstrate the efficiency of the gravitational telescope we used the exposure time calculator of FORS provided by ESO and estimated the total exposure time that would have been necessary to obtain a spectrum of s/n from the unmagnified galaxies. These numbers show that only by having a gravitational telescope at hand we could obtain acceptable s/n spectra of the distant background sources visible near 1E 0657 with a reasonable exposure time. This confirms that gravitational telescopes offer a unique possibility to investigate the physics and chemistry of high redshift galaxies in detail.
4 Future Plans
With the available spectra we plan to constrain the stellar population of the observed high redshift galaxies using NLTE hot star models (Pauldrach et al. 1998). From the line ratios we hope to derive the mean metallicity of the observed population.
Moreover, the stretched arc itself will be used in an attempt to investigate the spatial distribution of the stellar population and the kinematics of this high redshift galaxy. In principle, reconstructing the original image of the galaxy by means of a lens model should allow us to investigate its dynamical state and estimate its total mass.
Acknowledgements: We are grateful to M. Ramella for sharing his data and knowledge about earlier imaging and spectroscopic observations of 1E 0657, which helped us in optimizing the observational strategy and improved the interpretation of the data. This research was supported by the German Science Foundation (DFG, SFB 439).
References
- [1] appen:etalAppenzeller et al. (1999) Appenzeller, I., Bender, R., Böhnhardt, H., et al. (1999): Science with FORS. Proceedings of the VLT Opening Symposium held in Antofagasta (1–3 March 1999), in press
- [2] burstein:heilesBurstein and Heiles (1984) Burstein, D., Heiles, C. (1984): Reddeneing Estimates for Galaxies in the Second Reference Catalog and the Uppsala General Catalog. ApJS 54, 33.
- [3] fortetalFort et al. (1994) Fort, B., Mellier, Y., (1994): Arc(let)s in clusters of galaxies. A&AR 5, 239
- [4] fortetal2Fort et al. (1997) Fort, B., Mellier, Y., Dantel-Fort, M. (1997): Distribution of galaxies at large redshift and cosmological parameters from the magnification bias in Cl 0024+1654. A&A 189, 353
- [5] franxetalFranx et al. (1997) Franx, M., Illingworth, G. D., Kelson, D. D., et al. (1997): A Pair of Lensed Galaxies at z=4.92 in the Field of CL 1358+62. A&A 486, L75
- [6] howarthHowarth (1983) Howarth, I. D. (1983): LMC and galactic extinction. MNRAS 203, 301
- [7] pauldr:etalPauldrach et al. (1998) Pauldrach, A. W. A., Lennon, M., Hoffmann, T. L., et al. (1998): Realistic Models for Expanding Atmospheres. ASP Conference Series 131, 258
- [8] tucker:etalTucker et al. (1998) Tucker, W., Blanco, P., Rappoport, S., et al. (1998): 1E 0657-56: A Contender For the Hottest Known Cluster of Galaxies. ApJ 496, L5
- [9] yaqoobYaqoob(1999) Yaqoob, T. (1999): On the Unusually High Temperature of the Cluster of Galaxies 1E 0657-56. ApJ 511, L75