Disc galaxy evolution models in a hierarchical formation scenario: structure and dynamics
Abstract
We predict the internal structure and dynamics of present-day disc galaxies using galaxy evolution models within a hierarchical formation scenario. The halo mass aggregation histories, for a flat cold dark matter model with cosmological constant, were generated and used to calculate the virialization of dark matter haloes. A diversity of halo density profiles were obtained, the most typical one being close to that suggested by Navarro, Frenk & White. We modeled the way in which discs in centrifugal equilibrium are build within the evolving dark haloes, using gas accretion rates proportional to the halo mass aggregation rates, and assuming detailed angular momentum conservation. We calculated: the gravitational interactions between halo and disc —including the adiabatic contraction of the halo due to disc formation—, and the hydrodynamics, star formation, and evolution of the galaxy discs. We find that the slope and zero-point of the Tully-Fisher (TF) relation in the infrared bands may be explained as a direct consequence of the cosmological initial conditions. This relation is almost independent of the assumed disc mass fraction, when the disc component in the rotation curve decomposition is non-negligible. Thus, the power spectrum of fluctuations can be normalized at galaxy scales through the TF relation independently of the disc mass fraction assumed. The rms scatter of the model TF relation originates mainly from the scatter in the dark halo structure and, to a minor extension, from the dispersion of the primordial spin parameter . The scatter obtained from our models does not disagree with the observational estimates. Our models allow us to understand why the residuals of the TF relation do not correlate significantly with disc size or surface brightness. We can also explain why low and high surface brightness galaxies have the same TF relation; the key point is the dependence of the star formation efficiency on the disc surface density. The correlations between gas fraction and surface brightness, and between scale length and obtained with our models agree with those observed. Discs formed within the growing haloes, where is assumed to be time independent, have nearly exponential surface density distributions. The shape of the rotation curves changes with disc surface brightness and is nearly flat for most cases. The rotation curve decompositions show a dominance of dark matter down to very small radii, in conflict with some observational inferences. The introduction of shallow cores in the dark halo attenuates this difficulty and produces haloes with slightly smaller rotation velocities. Other features of our galaxy models are not strongly influenced by the shallow core.
keywords:
galaxies: formation - galaxies: evolution - galaxies: structure - galaxies: haloes - galaxies: disc - cosmology: theory - dark matter1 Introduction
The understanding of galaxy formation and evolution provides a crucial link between a large body of astronomical observations and cosmological theories. According to the inflationary cold dark matter (CDM) theory, large-scale cosmic structures arise from primordial density fluctuations that evolve gravitationally through a hierarchical process of mass aggregation (accretion and merging). In order to explain galaxy formation, it is also necessary to take into account the hydrodynamical and dissipative processes related with the baryon matter, as well as the poorly understood processes of star formation (SF) and its feedback. In this paper we use galaxy evolution models, which are able to predict the local and global properties of disc galaxies, and integrate them into the cosmological framework.
In the last decade, several galaxy formation and evolution models based on semi-analytical and analytical approaches were developed (e.g. White & Frenk 1991; Lacey & Silk 1993; Kauffmann, White & Guiderdoni 1993; Cole et al. 1994; Baugh, Cole & Frenk 1996; Somerville & Primack 1998; Fall & Efstathiou 1980; Dalcanton, Spergel & Summer 1997; Mo, Mao & White 1998, hereafter MMW98; van den Bosch 1998). The models we present in this paper make use of some of the ingredients of these approaches. However, as opposed to most of the previous models, we calculate the internal structure, dynamics, hydrodynamics and SF process that define the evolution of a given galaxy (dark+luminous). That is why our approach is based on models of disc galaxy evolution (Firmani, Hernández & Gallagher 1996). We link the initial and boundary conditions of these models to the cosmological setting through the hierarchical mass aggregation histories (MAHs) and the structure of the dark matter (DM) haloes. We relax the simplifying hypothesis of a universal DM halo density profile and model the evolution of disc galaxies in a wide collection of DM structures. Thus, we can explore whether the initial conditions given by the CDM models are consistent with the disc galaxy properties and their correlations in the local universe. We have carried out a sequence of semi-numerical calculations, which include (i) the generation of the hierarchical MAHs from the primordial density fluctuation field, (ii) the gravitational collapse and virialization of the DM haloes, (iii) the formation of discs in centrifugal equilibrium within the evolving haloes, (iv) the gravitational drag of the collapsing gas upon the DM halo, and (v) the evolution of a galaxy disc, including SF and hydrodynamics. Some details were already disscused in previous papers (Firmani et al. 1996; Avila-Reese, Firmani & Hernández 1998, hereafter AFH98; see also Avila-Reese 1998).
Our scenario suggests that discs form inside-out within a growing DM halo with a rate of gas accretion proportional to the rate of cosmological mass aggregation (Gunn 1982; 1987; Ryden & Gunn 1987; Avila-Reese & Firmani 1997; AFH98). We assume that the primordial angular momentum is acquired by the protogalaxy through tidal torques during its linear gravitational regime. This scenario will be called the “extended collapse scenario” as opposed to the “merging scenario” where the main properties of galaxies are a consequence of disc merging. Because the discs are dynamically frail objects (e.g. Tóth & Ostriker 1992), mergers could not have been relevant in establishing the main properties of disc galaxies, which constitute nearly the 80 per cent of normal present-day galaxies. Compelling new observational evidence suggests that a large fraction of baryon matter is in the form of small cold gas clumps which are falling onto galaxies and whose nature probably is cosmological (Blitz et al. 1998; López-Corredoira, Beckman, & Casuso 1999).
The structural and dynamical properties of disc galaxies as well as the correlations amongst them should be self-consistently explained by theories of galaxy formation and evolution. Among the local properties to be explained are the nature of the exponential surface brightness or density distribution in discs, the factors that determine the observed wide range of surface brightnesses (SB), the shapes of the rotation curves (typically flat) and their correlations with the SB. Among the global structural and dynamical correlations of disc galaxies, the Tully-Fisher relation (TFR) and the rotation velocity-radius relation are of great interest. Understanding of the origin of these observational relations —particularly the TFR and its scatter— is an outstanding problem of extragalactic astronomy. We would like to know whether the slope and zero-point of the TFR are produced by evolutionary and/or SF processes (e.g. Silk 1997; Elizondo et al. 1998), or if they are direct imprints from a fundamental scaling law of cosmic structures (e.g. Faber 1982; Frenk et al. 1988; Cole et al. 1994; MMW98; AFH98; Navarro & Steinmetz 1998). Likewise we are interested in understanding why the TFRs for high and low SB galaxies are the same, and why the scatter of this relation is small.
The purpose of this paper is to use an unified scenario of galaxy formation and evolution in the cosmological context in order to explain the items mentioned above. In a forthcoming paper, results concerning the luminosity properties, bulge formation, and the correlations which define the Hubble sequence will be discussed (Avila-Reese & Firmani 2000). Since our aim is to study general trends, we shall only use one representative CDM model. It has the following parameters: the matter density: the vacuum density: the Hubble constant in unities of 100 kms-1Mpc-1: h, the amplitude of perturbations on a 8 Mpch-1 scale: . Hereafter, we shall refer to this model as the CDM0.35 model.
In we briefly describe the methods used to generate the MAHs and to calculate the virialization of the DM haloes. Results concerning the structural and dynamical properties of the DM haloes are presented. The method used to build discs within DM haloes and to follow their evolution, including SF and hydrodynamics, is presented in . In 4, local galaxy properties such as the surface density, the rotation curve, and the decomposition of the rotation curve are presented. Section 5 is devoted to the TFR, its scatter, and the correlations between gas fraction vs. SB and vs. disc size. We interpret why low and high SB galaxies lie on the same location in the TFR, and why the residuals of the TFR are nearly independent of the SB. In §6 we explore how the introduction of a shallow core in the halo influences on the models. A summary and our conclusions are given in .
2 Dark matter haloes
2.1 The method
According to the hierarchical clustering scenario, the DM haloes are the environment in which luminous galaxies form and evolve. Therefore, some features of luminous galaxies depend on the evolution and properties of their surrounding dark haloes. In this subsection we present the method we used to calculate the formation, evolution and structure of the DM haloes.
We calculate the gravitational collapse and virialization of DM haloes beginning from a primordial density fluctuation field. This was done in AFH98 and the reader is referred to it for details (see also Avila-Reese 1998). We assume a Gaussian fluctuation field where all the statistical properties depend only on the power spectrum of fluctuations given by the chosen cosmological model. The conditional probability for Gaussian random fields is used to calculate the mass distribution of haloes at time that will be contained in a halo of mass at a later time (Bower 1991; Bond et al. 1991). Starting from a present-day mass and its cumulative density contrast, we apply recurrently this mass distribution through Monte Carlo simulations in order to construct different realizations of the MAHs of “main progenitors” (Lacey & Cole 1993). Main progenitor in our case is the most massive subunit of the distribution, at each time, and not the larger mass between the chosen mass and its complement , where .
To calculate the virialized profile of the dark halo that emerges from a MAH, we use a method that expands upon the secondary infall model (e.g. Gunn 1977; Zaroubi & Hoffman 1993) by allowing non-radial orbits and arbitrary initial conditions (MAH in our case). Under the assumption of spherical symmetry, an initial density fluctuation —given by the MAH— can be described as a set of concentric mass shells that sequentially attain their first maximum expansion radius . After this maximum, the shell at which contains mass , separates from the expansion of the universe, falls toward the center due the gravitational field of the internal mass, and evolves through a radially oscillatory movement. Each oscilation defines an apapsis radius which is function of . The gravitational field at radius is given by , the sum of the mass shells with that permanently oscillate inside , , and of the mass shells with that only momentarily fall inside , . The estimate of is obtained from the probability
to find a shell inside a radius (), where is the radial velocity of the shell. This velocity is:
where is the gravitational constant, is the total energy of the shell, and is the typical angular momentum per unit mass of a shell mass element due to the thermal motion which will be taken constant in time. The condition defines the apapsis and a value which determines the maximum penetration of the shell towards the center. We express through the parameter and, although it is defined for the first and of every shell, through we are parametrically taking into account the thermal energy that could be produced by the mergers of substructures and tidal forces at all times. This parameter is calibrated to the results of N-body cosmological simulations (). The sequential aggregation of new shells, combined with their motion toward the center, introduces new contributions to the gravitational field which acts on the underlying shells. This non-conservative spherical gravitational field changes , and consequently , , and of each shell. The contraction of leads to an asymptotic value which is identified as the current virialized radius The change of may be estimated by assuming an adiabatic invariant for the orbital motion. A simple iterative numerical method allows us to calculate the solution, i.e. the structure profile at each time step.
The present-day mass used to initiate the Monte Carlo simulations will be called the nominal mass . Our results show that the outer mass shells within are not virialized. The mass shells that have been virialized are roughly within the virial radius, , where the mean over-density drops below the critical value, , given by the spherical collapse model; for the cosmological model used here (e.g. Bryan & Norman 1998). Analysis of numerical simulations show that at radii smaller than , mater is indeed close to virial equilibrium (Cole & Lacey 1996; Eke, Navarro & Frenk 1998). At radii between and 2, matter is still falling onto the halo, while, at larger radii, matter is expanding with the universe. The mass contained within is the virial mass which, depending upon the MAH, is 0.7-0.9 times (see also Kull 1999).
2.2 Structure of the haloes: diversity
In AFH98 it was shown that, due to the statistical nature of the MAHs, a collection of different DM virialized configurations are produced, the most typical configurations being reasonably well described by the density profile proposed by Navarro, Frenk & White (1996, 1997; hereafter NFW). Some features of the galaxies are related to the dispersion about the virialized structures. Therefore, its inclusion in the galaxy models is important. In the present work, we apply a more accurate statistical treatment of the results than in AFH98. Instead of initially selecting some relevant special cases, we generate, for a given mass and through Monte Carlo simulations, a catalog of objects with different MAHs (and eventually different spin parameters taken from a log-normal distribution; see ). Although most of the results of the statistical analysis of this catalog agree with AFH98, we felt it was important to perform this new procedure in order to obtain an accurate estimate of the dispersion in the mass-velocity relation.
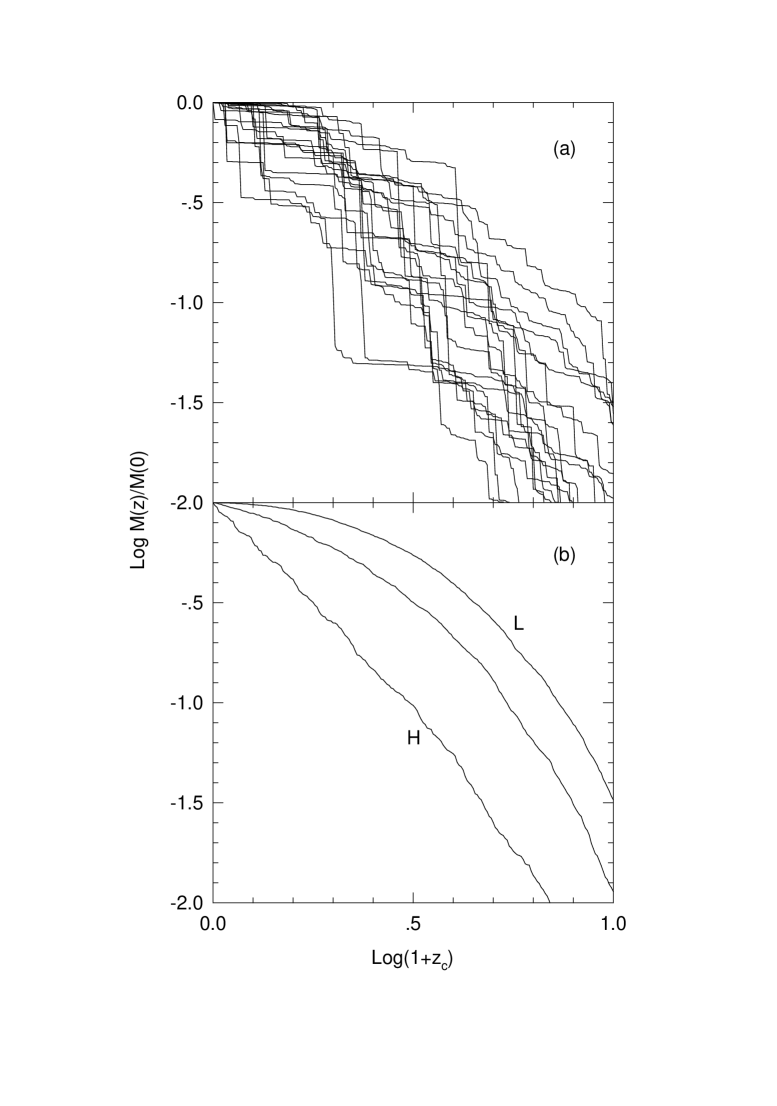
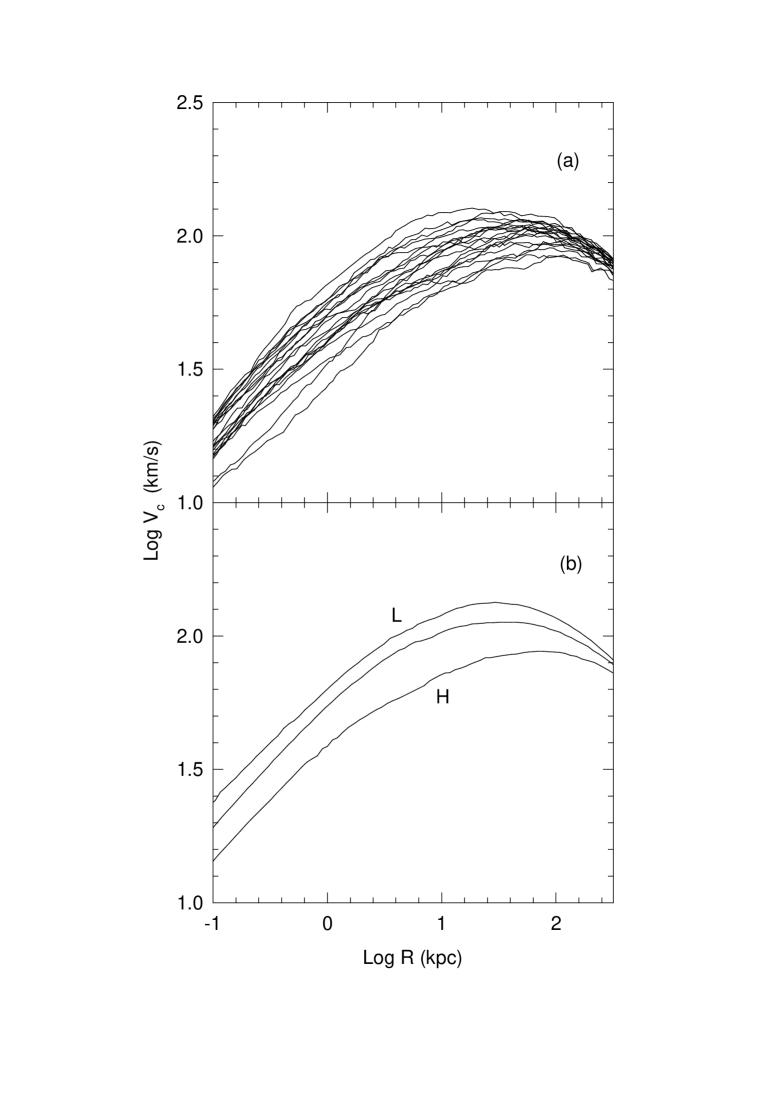
In Figs. 1a and 2a, a sample of twenty MAHs () and the circular velocity profiles of the haloes formed from them, are plotted as functions of the collapse redshift, . The average MAH and two representative cases, a fast early collapse (L: low accretion rate at ) and an extended collapse (H: high accretion rate at ), are shown in Fig. 1b. The circular velocity profiles corresponding to these particular MAHs are plotted in Fig. 2b. These two MAHs were chosen in such a way that roughly 95 per cent of all the trajectories lie between of them. For a given mass, the average MAH is calculated as the mean of a large sample of trajectories.
We find that a DM halo formed from an early fast MAH is more concentrated than a halo produced by a gentle and extended MAH. Nevertheless, as seen in Fig. 1a, the MAHs are diverse and difficult to classify in uniparametrical, or even biparametrical, sequences. That is why we have preferred to generate a a catalog of MAHs for each given and to study the statistics of the DM haloes calculated from these MAHs a posteriori.
Some of the MAH trajectories show pronounced jumps, which indicates the occurrence of major mergers. Halo major merging may imply disc major merging that probably destroys the discs. The fraction of MAHs that show evidence of at least one major merger is between 20 and 30 per cent. When we use the results from our catalogs to calculate the TFR scatter, we keep all the MAHs since we want to obtain an upper limit of this scatter.
2.3 Comparison with N-body simulations and the relation
The density profiles of a large fraction of the calculated haloes are roughly described by the NFW profile. However, as it is seen in Fig. 2b, the haloes present a diversity of structures. In Avila-Reese et al. (1999) the density profiles of the haloes obtained with our method were compared with those of thousands of haloes from a cosmological N-body simulation. The statistical agreement found was rather good, in particular for the isolated haloes. If we compare, for example, the statistical distribution of the outer density profile slope () for our haloes with those from the N-body simulations, we find they are very similar (see Fig. 4 in Avila- Reese et al. 1999). Haloes in the N-body simulations present a slightly broader distribution of than our haloes.
It is also important to mention that the MAHs of our haloes for a given mass agree rather well with the mass evolution measured for the haloes in a cosmological N-body simulation (see Fig. 6 in Gottlober, Klypin & Kravtsov 1999).
As in previous works, we find that the mass and the halo maximum circular velocity obey a relation (in the range and for the CDM0.35 model, and 3.3 from our results and from results of N-body simulations, respectively). This relation is imprinted by the power spectrum of fluctuations and the MAH of the protohalo (AFH98; Avila-Reese et al. 1999).
Owing to the statistical nature of the calculated MAHs, a scatter in the relation is expected. A first attempt to estimate such a scatter was done by Eiseinstein & Loeb (1996) who used Monte Carlo simulations to generate the MAHs, and the simple spherical-collapse model to calculate the halo circular velocities. AFH98 have estimated this scatter making use of their semi-numerical method for calculating the virialization process of the DM haloes. For the SCDM model both methods lead to similar results. Here, for the CDM0.35 model and in the range of , we obtain fractional standard deviations in the velocity, , from to , respectively (see Table 1). The deviations estimated from the cosmological N-body simulations are in rough agreement with these values, being only slightly larger than our results. (see Fig. 10 in Avila-Reese et al. 1999). The deviations in velocity may be translated into logarithmic standard deviations in mass: loglog (multiplying log by 2.5, the standard deviation in mass can be expressed magnitudes). In column (4) of Table 1, the mass scatter of the relation — expressed in magnitudes — is given for several masses.
3 Disc build up and galaxy evolution
During or after DM reaches virial equilibrium, the baryon matter dissipates energy radiatively and falls to the bottom of the gravitational potential well. If the DM halo has some angular momentum, then a disc in centrifugal equilibrium forms at the centre of the halo. In this section we describe the methods used to calculate the formation and evolution of discs. The main structural properties of the disc will depend on the formation history of the halo, its structure, and on the amount of infalling gas and its angular momentum.
Analytical models of discs in centrifugal equilibrium surrounded by DM haloes have been used to study several galaxy and galaxy population features (e.g. Fall & Efstathiou 1980; van der Kruit 1987; Dalcanton et al. 1997; MMW98; van den Bosch 1988). The results obtained with these models encourage us to study in more detail the extended collapse scenario. Our contributions are: First, we were able to build up the disc sequentially within an evolving DM halo. Second, we calculated the disc thickness and the multiple galaxy components in a 3-D gravitational potential. Third, we calculated the SF, disc hydrodynamics and ensuing galaxy evolution.
The outline of our evolution models is:
(1) We consider that baryon matter has the same distribution of mass and angular momentum as DM till the accreted spherical (baryon+DM) mass shell virializes. We assume that each mass shell has a solid body rotation, in agreement with the Zel’dovich approximation, and that the rotation axis of the shells are aligned. We did not assume that the whole halo is a solid rotator (e.g. Dalcanton et al. 1997).
(2) Once a given mass shell virializes, a fraction of its mass is transferred to a disc in centrifugal equilibrium. Since for galaxy haloes the time-scale of gas cooling is generally smaller than the dynamical time-scale (c.f., Silk 1977; Rees & Ostriker 1977; White & Rees 1978; Ryden & Gunn 1987) we assume the gas falls from the maximum expansion radius of the current shell to the halo centre in a time equal to the shell virialization time. The radial distribution of the infalling gas is calculated by equating its specific angular momentum (the same of the DM component) to that of its final circular orbit in centrifugal equilibrium. The specific angular momentum acquired by each collapsing mass shell during the linear regime is estimated under the assumption of a constant spin parameter ():
| (1) |
where , , and are the current total angular momentum, mass, and energy of the halo at time .
(3) The gravitational drag on the dark halo produced by the collapse of each baryon mass shell is calculated through the adiabatic invariant formalism (e.g. Flores et al. 1993).
(4) We consider that the local SF and internal hydrodynamics of the disc are regulated by a balance between the kinetic energy injected by SNe and gas accretion, and the energy dissipated by the turbulent interstellar medium (Firmani et al. 1996, 1997). The star formation is turned on at radius when the local Toomre gravitational instability parameter for the gas disc, , falls below a given threshold; , , and are the epicyclic frequency, the gas velocity dispersion, and the gas surface density at radius , respectively. Thus, the SF is controlled by a feedback mechanism such that, when a gas disc column is overheated by the SF activity, SF is inhibited and the disc column dissipates the excess energy to lower back to the value determined from the Toomre criterion threshold. Numerical simulations (Sellwood & Carlberg 1984; Carlberg 1985; Gunn 1987) and observational estimates (e.g. Skillman 1987; Kennicutt 1989) suggest thresholds of the order of 2 instead of 1, as was analytically obtained for a thin disc (Toomre 1964). This difference is attributed to collective phenomena which are difficult to account for in the analytical studies. In our models, the value of this threshold controls the thicknesses of the gas and stellar discs; the SF rate actually is rather insensitive to the value of . When a value of 2 is used, for a model of the Galaxy, we obtain gas and stellar disc thicknesses compatible with those of the solar neighborhood. Thus, we fix . The gas loss from stars is also included. The gravitational dynamics of the evolving star and gas discs, and the DM halo are treated in detail. A Salpeter initial mass function is assumed. Analytical fits to simple stellar population models are used in order to calculate the luminosity in the band (see for more details Firmani & Tutukov 1994; Firmani et al. 1996).
Note that in our self-regulating SF mechanism the feedback happens only within the disc and not at the level of the whole halo. This is justifiable since the turbulent interstellar medium is a very dissipative system (e.g., Avila-Reese & Vázquez-Semadeni 2000). Gas and energy outflows are confined within a region close to the disc. The thick gaseous disc and the global magnetic field are efficient shields that prevent any outflow toward the halo on large scales (e.g. Mac Low, McCray & Norman 1989; Slavin & Cox 1992; Franco et al. 1995). The lack of observational evidence for significant amounts of hot gas in the haloes of disc galaxies confirms these studies and suggests that the halo-disc connection is not enough to self-regulate and drive the disc SF. Some observational evidence shows that extragalactic gas clouds reach the disc in free fall (see Blitz et al. 1998).
According to the scheme described above, time by time and at each radius, the growing disc is characterized by the infall rate of fresh gas by unit of area, , the gas and stellar disk surface density profiles, and , the total rotation curve (including the growing DM halo component), , and the SF rate determined by the energy balance in the vertical gaseous disk and by a Toomre criterion. It is interesting to point out that a consequence of our physical model of SF is that exhibits a Schmidt law with index at all radii and during almost all the evolution (Firmani et al. 1996; Avila-Reese & Firmani 2000). It should be mentioned that the global SF rate efficiency in our models does not depend on the mass or of the galaxy (see Avila-Reese & Firmani 2000). The global SF rate efficiency is mainly a function of (determined by ) and (determined by the MAH).
Our goal is to generate a catalog of models for each given present-day nominal mass, (see §2). The key initial factors for a model of a given mass are (i) the MAH (it determines the structure of the halo and the rate at which the gas is accreted onto the disc), (ii) the spin parameter (strongly influences the size and surface density of the disc), and (iii) the effective baryon fraction that is incorporated into the disc. The MAHs (see Fig. 1) and the halo evolution are calculated as was described in . The spin parameter is taken to be constant in time and is chosen from a log-normal distribution through Monte Carlo simulations. The median and the dispersion of the log-normal distribution we use are 0.05 and 0.5, respectively, in agreement with results of several theoretical and numerical studies (see MMW98 and the references therein). Regarding item (iii), in a first approximation one might take the baryon-to-dark matter ratio of the protogalaxies equal to that of the universe, . According to the current primordial abundance determinations of the baryon density, (e.g. Fukugita, Hogan & Peebles 1998), the baryon-to-dark matter fraction of the universe is for the cosmological model used in this paper (, , ). However, it is probable that not all the halo baryon fraction ends up in the galaxy central disc; some gas fraction may remain in the form of hot halo gas or may also be transformed into stars within some small halo substructures. Here we shall assume that the disc contains 5 per cent () of the total halo mass (see also Dalcanton et al. 1997; MMW98). We are aware that this is a free parameter in our models and when necessary, we shall explore here models for other values.
4 Local properties of disc galaxies
In this section we present the stellar surface density and rotation velocity profiles, and the rotation curve decompositions for our model galaxies. Most of the results in this section refer to models with the H, average, and L MAHs (see ), and with and 0.08.
4.1 Stellar surface density
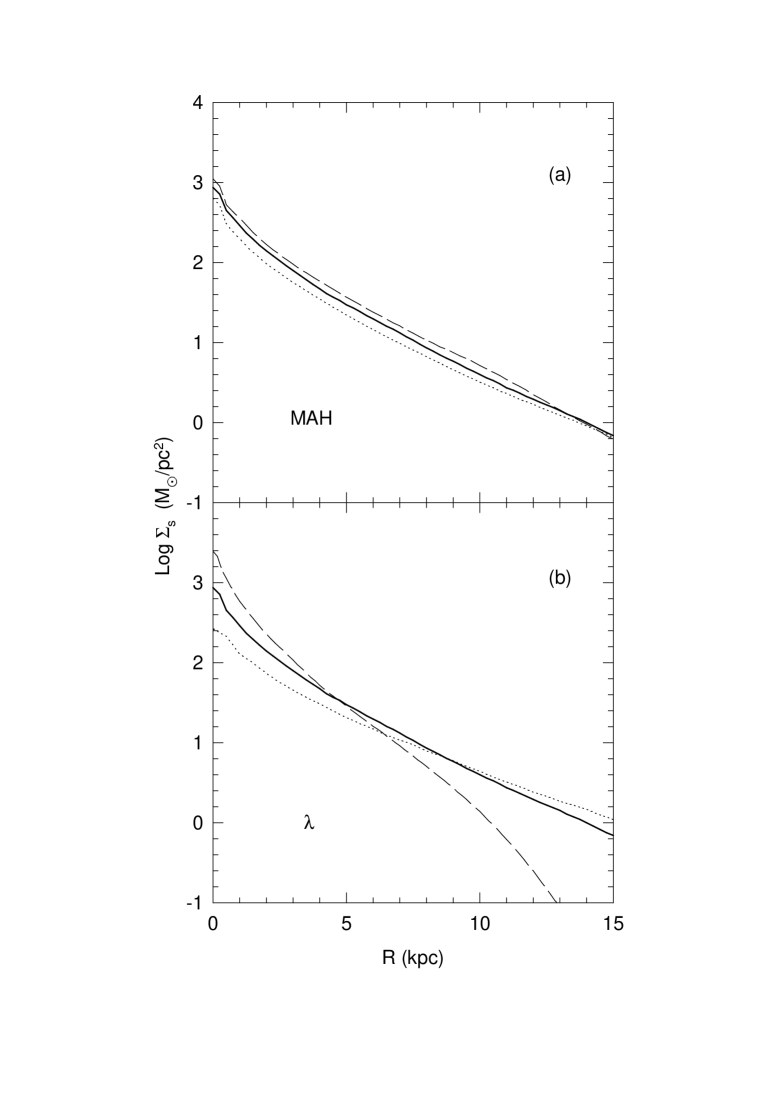
The stellar surface density (SSD) profiles of the rotationally supported discs, sequentially formed within the evolving CDM haloes, are nearly exponential over several scale lengths. Fig. 3 shows the SSD profiles for models of with several representative values of the MAH (panel a) and the spin parameter (panel b). It is worth remarking that, in contrast to the models of Dalcanton et al. (1997; see also Fall & Efstathiou 1980), we have not assumed the whole protogalaxy as a solid body rotator (see ). Therefore, the exponentiality of the stellar disc profile is a prediction of our model where the crucial assumption made regarding disc formation is the time constancy of . Analysis of results of N-body simulations regarding the evolution of the spin parameter of the haloes seem to confirm this assumption (Gottlober, private communication). We find the same general trends as in Dalcanton et al. (1997) and Jimenez at al. (1998): the central SSD depends strongly upon , and less upon the mass. We also find that the SSD has some dependence upon the MAH (Fig. 3a). We conclude that the low SB galaxies may be mainly galaxies with high angular momenta and/or low masses. The value probably introduces a natural separation between high and low SB galaxies.
The characteristic radii and SB of our disk galaxy models are realistic (see also Avila-Reese & Firmani 2000). The assumptions of detailed angular momentum conservation and rotation axis aligment of the shells were crucial for these predictions. According to numerical simulations of galaxy formation, the former assumption seems to fail (e.g., Navarro& Steinmetz 1997), posing a difficulty for the hierarchical formation scenario. Possible intermediate astrophysical processes might solve this difficulty (e.g., Weyl, Eke & Efstathiou 1998). Regarding the latter assumption, according to preliminar results of analysis of CDM cosmological N-body simulations, it seems to be reasonable, at least for the present-day isolated haloes (Avila-Reese, Klypin, Firmani, & Kravtsov, in preparation), although deeper studies are necessary, in particular for the inner regions of the halos whose collapse occured at early epochs.
4.2 Rotation curves
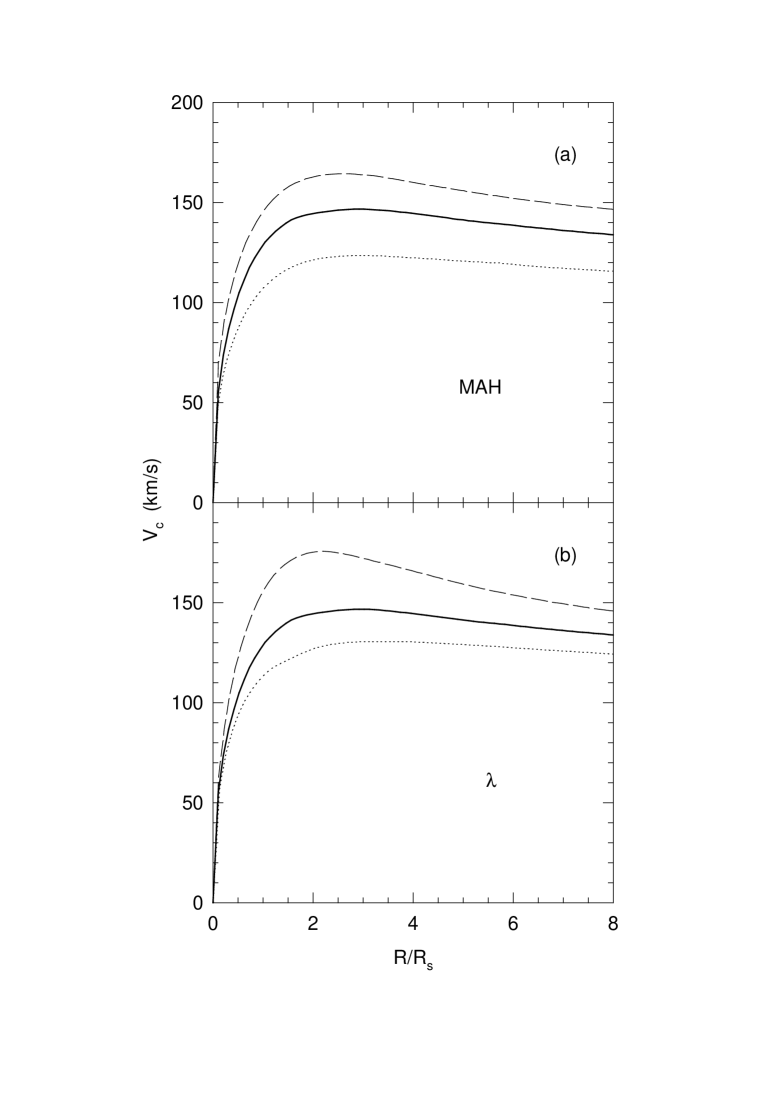
The shapes of the rotation curves depend on , on the MAH that determines the DM halo structure, and on . In Fig. 4, we plot rotation curves corresponding to models of for a variety of MAHs and spin parameters. From Fig. 4, the main tendencies appear clearly: the rotation curve shapes are more peaked as is smaller or the MAH is more active at early epochs (the DM halo is more concentrated). Due to the correlation between SSD and , a correlation between the SSD (SB) and the rotation curve shape is natural in our models: high SSD galaxies typically present more peaked rotation curves than low SSD galaxies. Observational studies seem to find a similar trend with SB (e.g. Casertano & van Gorkom 1991; Verheijen 1997). Although less significant, observations also show a dependence of the rotation curve shape on luminosity (Persic & Salucci 1988; Casertano & van Gorkom 1991; Persic, Salucci, & Stel 1996). Our models tend to confirm this dependence (see Avila-Reese & Firmani 2000). Finally, for high values of , the shapes of our rotation curves are more peaked (Fig. 5).
As it was previously pointed out by MMW98, we find that the minimum spin parameter, , for which the rotation curves are still realistic (nearly flat), should be increased as increases. For instance, an eye inspection of panels (a) and (d) of Fig. 5 suggests that when the can be as low as 0.03, while probably should be increased (to ) when . Dalcanton et al. (1997) and MMW98 proposed that models with are gravitationally unstable. For example, according to the predicted distribution of , this means that if , then roughly one third of the galaxies have unstable discs (S0’s, ellipticals?), a fact that disagrees with the observations in the local universe. This problem is enhanced if some angular momentum is transfered during the gas collapse, as is seen in the N-body+hydrodynamics simulations. This difficulty could be attenuated if the DM haloes would have inner density profiles shallower than (see ).
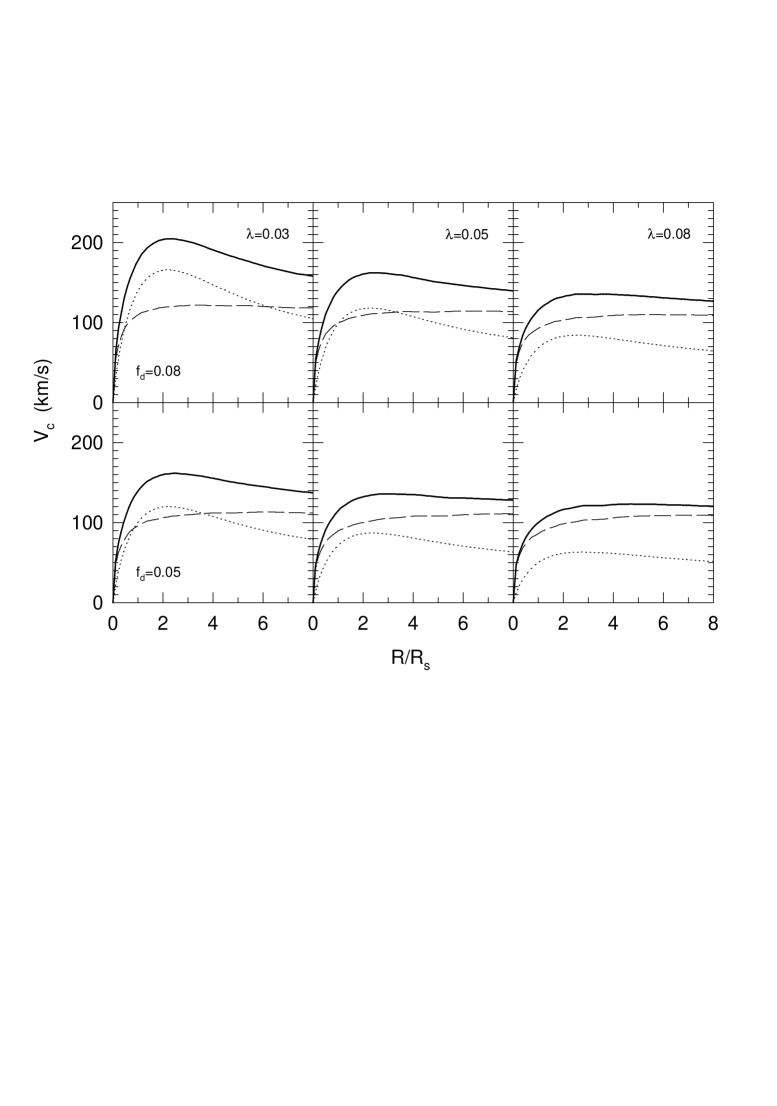
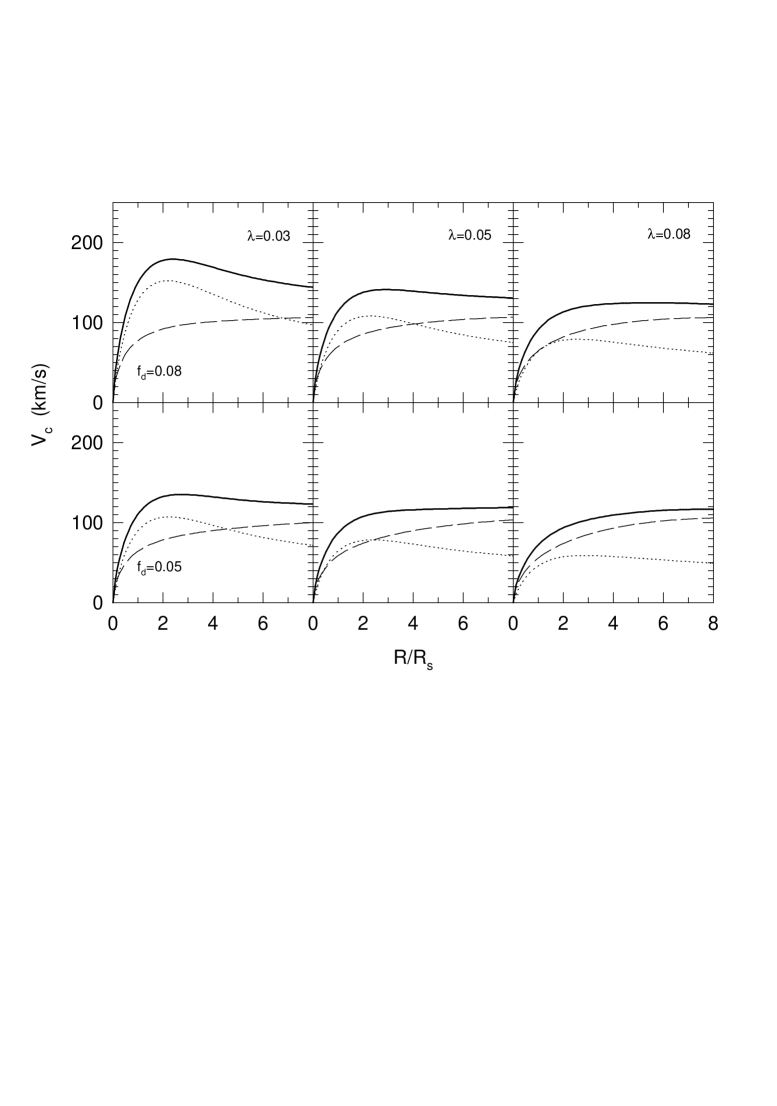
4.3 Rotation curve decompositions
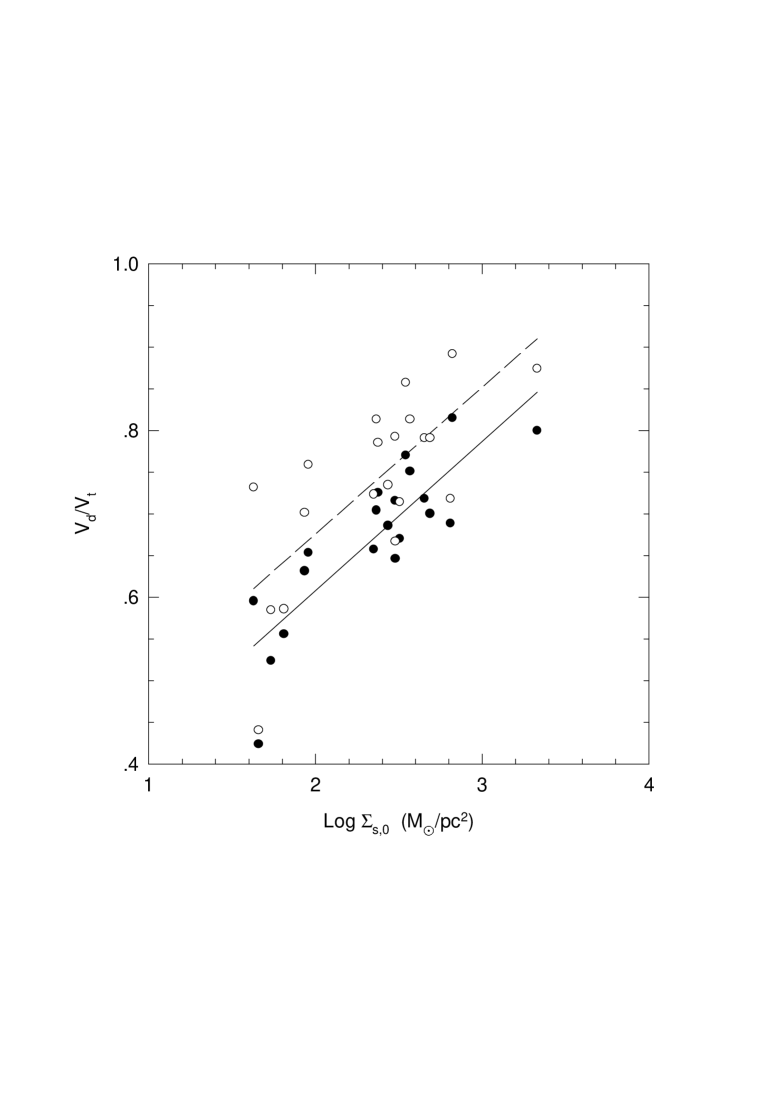
In Fig. 5 we show the decompositions of the rotation curves into disc (stars+gas) and halo (contracted by the baryon collapse) components for models of and different values of and . As is seen in Fig. 5, the maximum of the disc rotation velocity is attained at . The disc/halo decompositions of the observed rotation curves do not have a single solution, and an additional constraint is required in order to reproduce them. The “minimum halo” (or “maximum disc”) solution (c.f., Carignan & Freeman 1985; Sancisi & van Albada 1987) has been the commonly adopted restriction. In this case, the ratio between the disc and total maximum rotation velocities, , is about (e.g. Sackett 1997). Nevertheless, as some observational works have pointed out, this solution seems to present some shortcomings or at least is not applicable to all galaxies (Persic & Salucci 1988; see Navarro 1998 for more references). From an analysis of stellar velocity dispersions Bottema (1993, 1997), concluded that is about 0.63 for high SB galaxies, and even less for low SB galaxies.
In Fig. 6, is plotted as a function of the SSD for 20 models from our catalog corresponding to and (filled circles). The disc contribution increases as the galaxy SSD is greater. The models corresponding to high SSD galaxies (, where is the central SSD) have on average . This is the approximate value of the average galaxy model with for which the DM dominates at essentially any radius (Fig. 5). Some theoretical arguments (e.g. Athanassoula et al. 1987; Debattista & Sellwood 1998) and observational studies (Verheijen 1997; Corsini et al. 1998) suggest that in high SB galaxies the disc component should dominate to some extent at the most inner radii.
In our models, the dominance of the halo component over the disc component is mainly due to the steep inner density profile ( of the original DM halo. Therefore, the inferred rotation curve decompositions of observed galaxies seem to point out that the halo core should be shallower than . More direct evidence for shallow halo cores comes from the rotation curves of dwarf and low SB galaxies (Moore 1994; Flores & Primack 1994; Burkert 1995). In we shall explore models where shallow cores are artificially introduced to our DM haloes.
5 Structural and dynamical correlations of disc galaxies
In this section we present the (TF) and relations calculated from our catalogs of galaxy models. The scatter of the relation is studied in detail. We analise the correlation among the residuals of the above relations and we explain why low and high SB galaxies have the same TFR.
5.1 Infrared Tully-Fisher relations
Disc galaxies present a strong correlation between their luminosities ( is the spectral band) and their maximum rotation velocities , commonly known as the TFR (Tully & Fisher 1977). In the infrared bands (, this relation is given by:
| (2) |
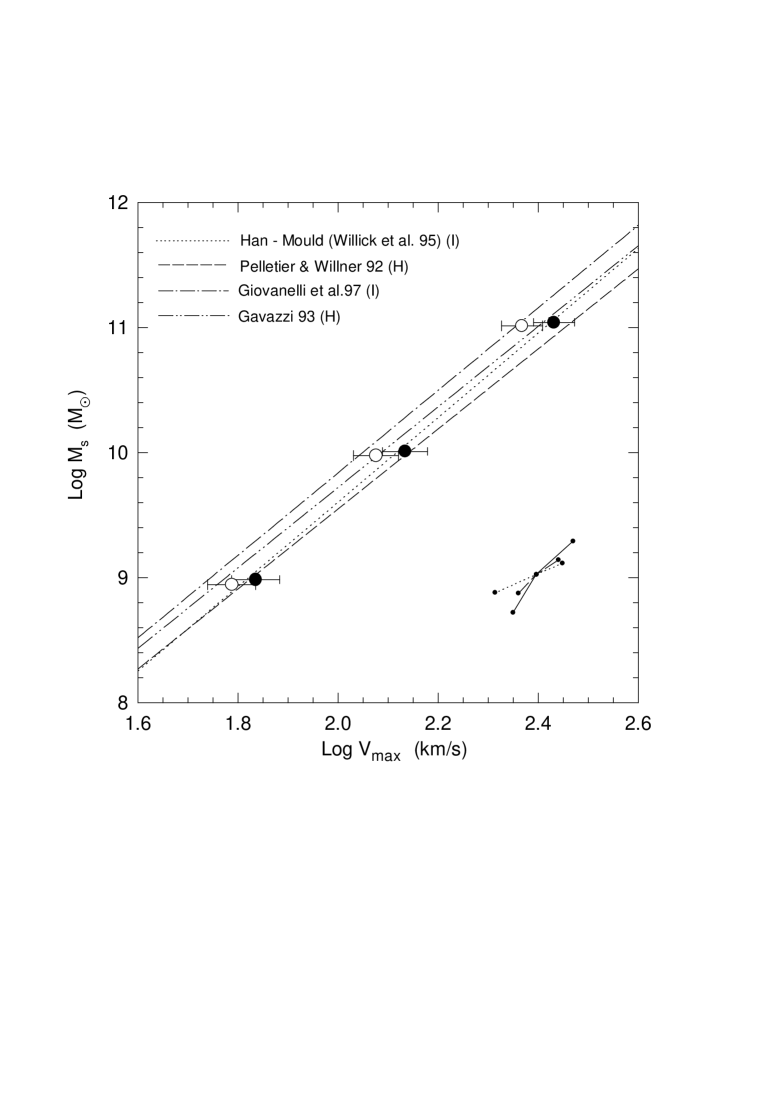
where is related to the so called zero-point, and according to several observational studies. Since where is the disc stellar mass, eq. (2) may be interpreted as a relation between and . In Fig. 7, where is plotted as a function of , we present our results from the catalog constructed by Monte Carlo simulations with (see §2 and §3). The error bars represent the standard deviation calculated by adopting a normal distribution for the deviations of the velocity for a given mass; see also Table 1. In the range of masses considered here ( the slope of the relation is approximately 3.4; this slope is slightly larger than the slope of the mass-velocity relation of the cosmological DM haloes ().
In Fig. 7 we have also included observational data. In the band we used the TFRs given by Giovanelli et al. (1997) and by Willick et al. (1995; they used the data published by Han, Mould and collaborators, see the references therein). In these studies the line widths were corrected for non-circular motions. In the band we used the TFRs given by Gavazzi (1993) and by Pelletier & Willner (1993). Although the magnitudes of most of the galaxies reported in Gavazzi (1993) were obtained through aperture photometry, he used the total magnitudes estimated with an extrapolation technique. We corrected the TFR given by Gavazzi for non-circular motions (see AFH98 for details). In the case of Pelletier & Willner, we used their TFR calculated with the total magnitudes obtained with an infrared array and the line widths corrected for non-circular motions. Regarding the determination of in the observational studies we plot in Fig. 7, most of the data were obtained from HI line-width measures. As Verheijen (1997) have shown, the differences in the slope of the TFR calculated with single dish and detailed synthesis data are small; if any, the slope is slightly shallower when using the detailed synthesis data.
In earlier works about the near infrared (particularly band) TFR with aperture photometry, the slope obtained was ; however, as pointed out by Pierce & Tully (1988) and Bernstein et al. (1994), the use of aperture magnitudes results in an artificially large slope to the TFR. This is why in studies where photometry is used the slope of the TFR in infrared bands resulted shallower than 4111After the complexion of this paper a study by Tully & Pierce (1999) appeared where the authors carrefully re-evaluate observational data in order to accurately determine template TFRs in different bands. They conclude that there appears to be convergence in the infrared towards a TFR’s slope of (see also Rohtberg et al. 1999) (e.g., Pierce & Tully 1988; Pelletier & Willner 1993; Bernstein et al. 1994; Verheijen 1997). The last author, for a sample of galaxies in the Ursa Major cluster obtained a band TFR with slope when he used the complete sample of 41 galaxies and with slope when he used only 15 galaxies out from the sample, selected to be unperturbed galaxies of late type Sb-Sd and without prominent bars.
In order to transform luminosities into stellar masses, a mass-to-luminosity ratio, , should be adopted. For the band observations, we assumed (see AFH98). This ratio is close to the one suggested by MMW98 ( ) on the basis of the that Bottema (1997) inferred from disc dynamics. For the band observations was used and was assumed. This mass-to-luminosity ratio is obtained from direct observational estimates in the solar neighborhood (Thronson & Greenhouse 1988; see details in AFH98).
In Fig. 7, the model results are slightly shifted to the high velocities with respect to the Giovanelli et al. (1997) and Gavazzi (1993) data, while they agree rather well with the Han-Mould (quoted by Willick et al. 1995) and Pelletier & Willner (1993) data. The assumed does not significantly change these results because our models typically shift along the main relation for different values of (see below). In order to reduce the uncertainties due to we have used measured TFRs in two bands ( and ) with independently estimated. The tendency of the models to have a larger for a given may again be showing that the CDM haloes are too cuspy. When a shallow core is introduced in the haloes (see §6), the resulting of the galaxies are slightly smaller (empty circles in Fig. 7). Despite the uncertainties, we conclude that the agreement of the slope and the zero-point of the TFR between observations and our theoretical results is reasonable well. Note that in the theoretical calculations, both the cosmological framework and the SF process were taken into account.
Our results show that the TFR is mainly a product of the mass-velocity relation of the DM haloes and, as stated in , this is determined by the cosmological initial conditions (e.g. Frenk et al. 1988, Cole et al. 1994, MMW98, AFH98, Steinmetz & Navarro 1998). The slope of the TFR is linked to the shape of the power spectrum at galaxy scales and the MAH of the halo. For most of the CDM models, the power spectrum shape at galaxy scales and the MAHs are almost the same, so the slope of the TFR is expected to be a generic feature of the CDM cosmogony (Firmani & Avila-Reese 1999). Concerning the zero-point, from the point of view of the cosmological model it depends on the amplitude of the power spectrum at galaxy scales. Models with low amplitudes at galaxy scales —like the CDM or open CDM models— predict the zero-point of the TFR better than those with high amplitudes (for example, the standard CDM model; see also Firmani & Avila-Reese 1999; Jimenez & Heavens 1999).
The results presented in Fig. 7 were obtained assuming . We find that the relation is rather insensitive to changes in the disc mass fraction, particularly when this fraction is such that the disc contribution to the rotation curve is relevant. In the right lower corner of Fig. 7 the solid line represents the shifts that a typical galaxy model (average MAH, ) suffers when varying . From right to left the dots correspond to models with , 0.05 and 0.08, respectively. For the typical galaxy models, an increment in the parameter basically produces a shift along the relation. This is due to the “compensating” action of the gravitational pull exerted by the disc on the DM halo. This result also suggests that, if fluctuates or has a dependence upon mass, by effects of gas cooling or feedback, then the TFR is almost unaffected, at least in the range mentioned above. When is very small, the disc contribution to the rotation velocity is negligible, and is determined by the DM halo alone. In this case, the relation becomes sensitive to because the stellar mass (luminosity) and the galaxy dynamics are de-coupled.
Based on the results presented above and as was pointed out in Firmani, Hernández, & Avila-Reese (1997), we find that the infrared TF relations offer a robust way to normalize the power spectrum of fluctuations at galaxy scales independently of uncertainties due to the disc mass fraction assumed. This normalization favours power spectra corresponding to -normalized low density CDM models (CDM or open CDM models).
5.2 Scatter of the Tully-Fisher relations
The observational rms scatter of the TFR is small. In the -band Giovanelli et al. (1997) reported a total scatter of mag for rotators of km/s; they found that the scatter increases from fast to slow rotators. Willick et al. (1995, 1996) and Mathewson and Ford (1994) estimated a total scatter of 0.38-0.43 mag and 0.44 mag, respectively. Bernstein et al. (1994) found a scatter of 0.23 mag. In the -band Willick et al. (1996) found a scatter of 0.47 mag. These last authors concluded that the estimated intrinsic scatter of the infrared TFRs is not smaller than 0.3 mag. Are the theoretical models able to predict the intrinsic rms scatter inferred from the observations? In our models, there are at least two sources of the scatter in the infrared TFR. One is related to the statistical nature of the MAHs. The dispersion in the MAHs determines a dispersion in the maximum circular velocities of the virialized structures (Eisenstein & Loeb 1996; AFH98; see ). The second source is associated with the dispersion of the spin parameter (e.g. MMW98). As decreases, the disc becomes more concentrated, and therefore increases.
A first qualitative estimate of the scatter produced by the MAH and distributions may be appreciated by the shifts from the relation shown in the right lower corner of Fig. 7. The dotted and dashed lines correspond to different MAHs and . Dispersions in both the MAH and tend to shift the models along the relation, in a similar way as . In columns (3) and (4) of Table 2, we present the total scatters in velocity and mass of the relation obtained from our catalogs for three stellar disc masses. The scatter in mass is expressed in magnitudes (see ). There is a marginal agreement with the observations. Observational and theoretical uncertainties are large, so it is still premature to draw any conclusions relating the scatter of the TFR and the cosmological initial conditions (but see Eiseinstein & Loeb 1996). It should be noted that we have maximized the scatter in our models by including both low and high SB galaxies, and taking into account major mergers in the calculation of the MAHs. The observational estimates refer mostly to high SB late-type galaxies. On the other hand, we have not included any source of scatter related to non-stationary SF or possible variations in . Observational scatter due to non-stationary SF and would imply a larger scatter in our models, although Elizondo et al. (1998) have shown that, in this case, compensating effects may play an important role in keeping, or even decreasing, the scatter of the TFR.
We calculated a set of models with a constant , in order to estimate the scatter of the relation, due to variations in the MAHs. In order to estimate the contribution to the scatter of the relation due to , we calculated a set of models using the average MAH and taking the different values from its log-normal distribution. We find that the influence of on the scatter of the relation is smaller than that due to the MAHs; the quadratic contributions of the scatter in and in MAH to the total scatter, are roughly 25 and 75 per cent, respectively.
5.3 Residuals of the and relations and the TFR of low SB galaxies
In our models strongly influences the SSD. Consequently, the small contribution of to the scatter of the relation, implies that galaxies of different SB should have almost the same TFR. This agrees with the observations that show that the TFRs of low and high SB galaxies are the same (e.g. Zwaan et al. 1995; Tully & Verheijen 1997; Verheijen 1997).
Recently, Courteau & Rix (1998), using large catalogs of late-type, high SB galaxies, have studied the correlations among the residuals of the TF and the luminosity-radius relations. They find that the slope of the correlation among the residuals, , has a mean value of ( is the value of the rotation velocity at ). According to Courteau & Rix (1998), this means that the TFR scatter correlates only slightly with disc size or SB. They interpret this as a evidence for large amounts of DM in the inner parts of late-type galaxies (). If the DM is dominant, the disc component plays almost not role in setting . This conclusion, however, might not be consistent with observations that hint that shape of the rotation curve correlates with SB for a given luminosity (Casertano & van Gorkom 1991; Verheijen 1997).
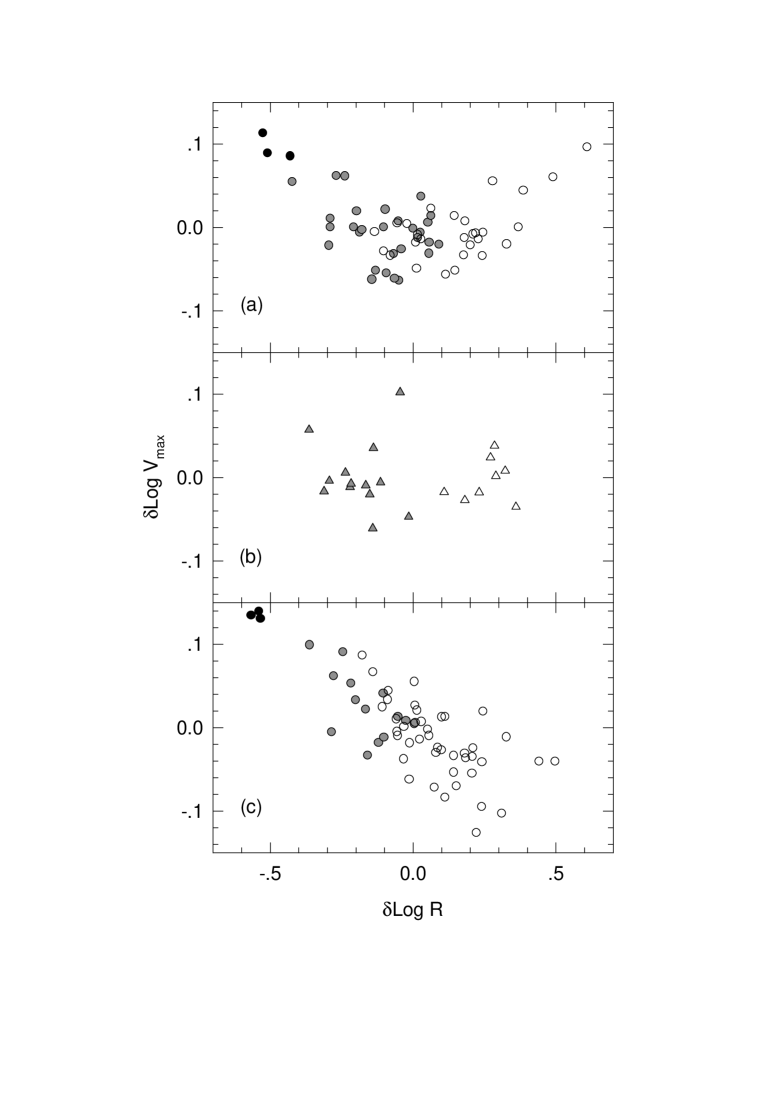
Using our models we can explain this apparent observational inconsistency. In order to interpret the observational results of Courteau & Rix (1998) one must take into account the difference in the SF histories among galaxies of different SB. From our models, in Fig. 8 we plot the deviations from the relation, log, vs. the deviations from the relation, log. The model galaxies were divided into three groups depending on their central SSD: very high SSD (), high SSD (), and low SSD (); we used black, gray, and empty circles to represent them. The slope of the correlation among the residuals changes with the SSD of the galaxy. The very high SSD models probably do not represent realistic disc galaxies because their rotation curves are too peaked. These models could be subject to instabilities that destroy the disc (see ). For the high SSD models the slope is approximately in agreement with the results of Courteau & Rix (1998). In order to compare the models with observations that include a wide range of SB’s, we estimated the residuals log and log using the data given in Verheijen (1997) and Tully et al. (1996) for galaxies of the Ursa Major cluster. Fig. 8b shows these residuals where filled and empty circles represent high and low SB galaxies, respectively. In spite of the small number of objects, the tendencies in this plot are similar to those of our models. The low SB galaxies specifically demonstrate that there is no extrapolation of the trend found by Courteau & Rix (1998) to large radii (low SBs).
From Fig. 8a, it is seen that for galaxies with high SSD (small log) the deviates from the relation decrease toward the low velocity side as the SSD decreases. However, for low SSD galaxies (large log), this behavior is reversed. This result is due to the fact that not only decreases as the SSD decreases, but so does the stellar disc mass, . For this reason, for a fixed increasing the scale length (decreasing the SSD), two regimes are present in Fig. 8a. When the SSD is large (), the disc contribution to the circular velocity becomes important and the residuals of the relation decrease with the residuals of the relation ( decreases with ). But, when the SSD is small () the fraction of gas converted into stars is smaller than in discs with larger SSDs. Thus, in the last case should correspond to a galaxy with a more massive halo than in the former case. Therefore, the residuals of the relation increase with the residuals of the relation ( increases with ). At the same time, when the SSD is large the rotation curve is dominated by the disc and it results peaked, while when the SSD is small, the rotation curve is dominated by the halo contribution, it slowly increases, and presents a broad maximum.
We conclude that the dependence of upon the SSD is responsible for the almost flat and non-monotonic slope of the correlation among the residuals of the and relations (Fig. 8a,b). One expects that this slope becomes steeper and monotonic if the total (stars+gas) disc mass is used instead of . Since does not depend upon the disc surface density, then as the disc surface density increases (i.e. the disc scale length decreases), increases for all the SB’s. The residuals from the and relations, for the same models from Fig. 8a are plotted in Fig. 8c. As can be seen from Fig. 8c, if we assume that the disc stellar mass (luminosity) is exclusively proportional to the total disc mass (e.g. Dalcanton et al. 1998; MMW98; AFH98; van den Bosch 1998), then we arrive to an incorrect result: the slope of the correlation among the residuals of the TF and luminosity-radius relations is steep and monotonic, or in other words, the deviations from the TFR is highly correlated with the SB. This contradicts the observational inferences of Courteau & Rix (1998), and that based upon the data from Verheijen (1997) and plotted in Fig. 8b.
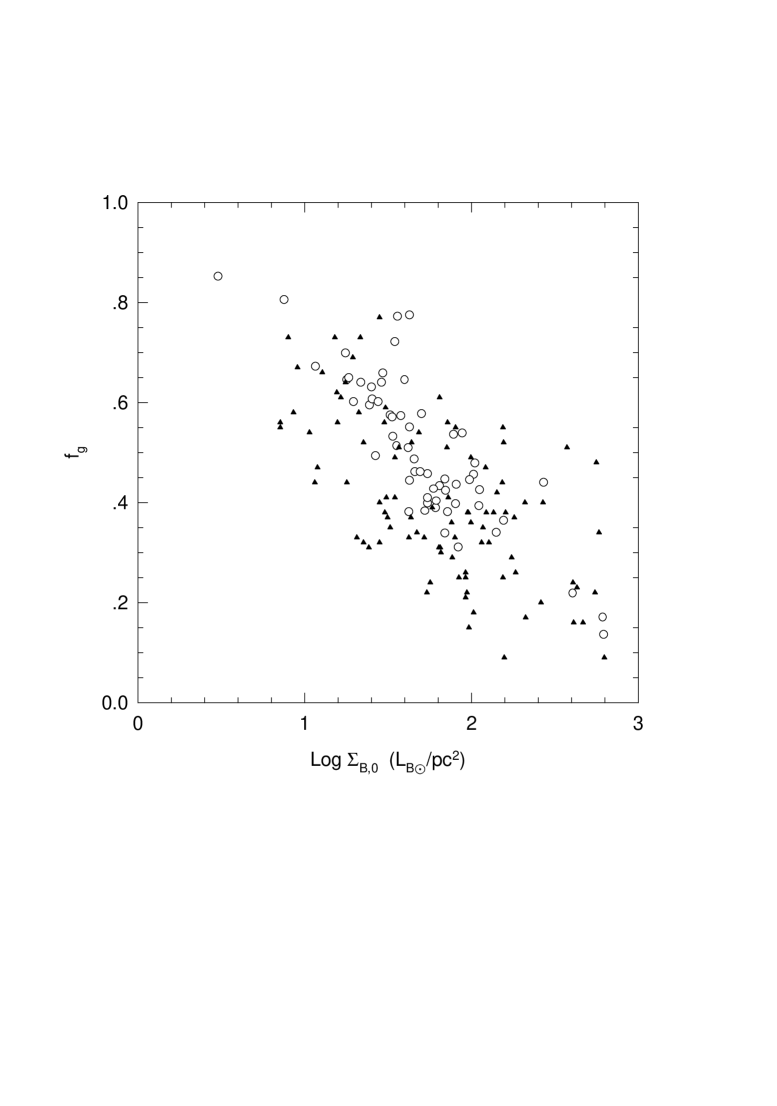
In our model galaxies, the stellar mass depends upon the disc surface density, because the SF efficiency depends upon the disc surface density. The stellar mass in our models, also depends upon the gas accretion rate given by the MAH. In Fig. 9 we have plotted the fraction of gas ( as a function of the central SB in the band, for our models and for the data compiled by de Blok & McGaugh (1997). The agreement between models and observations is rather good, suggesting that our SF histories are realistic. We conclude that the disc surface density plays an important role in determining the gas fraction, , of disc galaxies.
The analysis presented in this subsection allows one to understand why high and low SB galaxies have the same TFR, even though the shapes of their rotation curves depend upon the SB. In the vs. plot (Fig. 7), as the SB decreases, the galaxies not only shift towards lower velocities, but also shift towards a smaller stellar mass (luminosity). Thus, the deviations from the relation (TFR) are almost independent of the disc size or SB. This effect also explains why the scatter about the relation due to the dispersion of the parameter becomes so small (see ).
5.4 Disc sizes vs. maximum rotation velocities
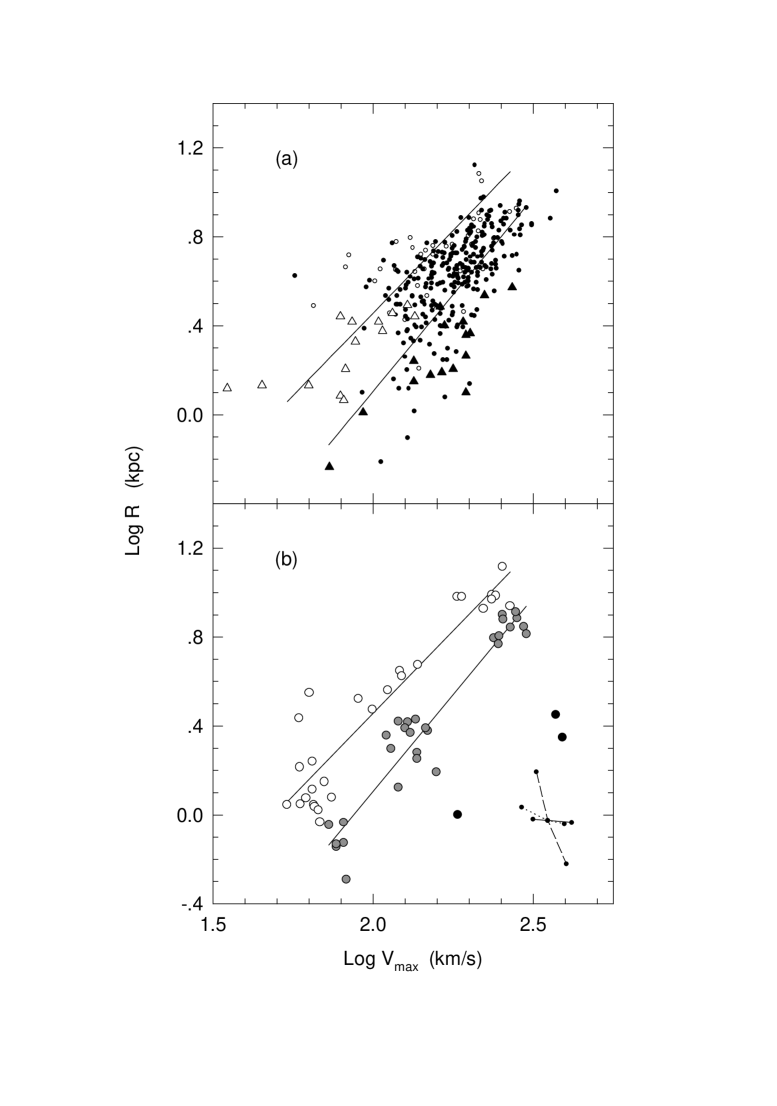
The distribution of disc galaxies in the diagram is shown in Fig. 10a. The data were taken from a catalog of late-type galaxies in the band elaborated by Courteau (1996,1997) (circles), and from a sample of galaxies of the Ursa Major cluster in the band elaborated by Verheijen (1997) (triangles). We transformed the surface brightness in the and bands to surface densities using and . We have tentatively divided the samples into two groups: high SB (, filled symbols) and low SB (, empty symbols). The threshold we used for the division in Courteau’s (1996,1997) sample was R-mag/arcsec2 (low SB galaxies are under-represented in this sample). For the Verheijen (1997) sample the threshold we used was 18.5 mag/arcsec2. Despite the incompleteness of the samples and the differences between them, Fig. 10a indicates that the disc size correlates with the maximum rotation velocity, particularly for families of similar SB. In Fig. 10b we plot the results from our model catalogs corresponding to three masses (, , and ). As was noted in the previous subsection, the very high SB discs with ( K’-mag/arcsec2; black filled circles) probably are not realistic; they might be subject to gravitational instabilities (these models have ). The solid lines are the linear regressions for the normal and low SSD models (gray and empty circles, respectively). These lines are reproduced in panel (a) for comparison with the observations. The agreement is reasonably good.
In the lower right corner of Fig. 10b, we show how galaxy models () shift in the plane when the MAH, , and are varied. The largest shift is due to , which is why the relation is well defined only for discs of similar SSD (SB).
6 Effects of a shallow core
From the observed rotation curves of some dwarf and low SB galaxies, Kravtsov et al. (1998, hereafter KKBP98) empirically inferred an approximate self-similar density profile for the haloes of these galaxies assuming that they are completely dominated by DM:
| (3) |
with , where the particular value of is weakly motivated; it should be considered just as the evidence of a shallow core (, see also Burkert 1995). Kravtsov et al. concluded that these density profiles are in reasonable agreement with those obtained in their high-resolution cosmological N-body simulations. Other high-resolution simulations, however, did not confirm the numerical results of KKBP98 (Fukushige & Makino 1997; Moore et al. 1998, 1999; Jing 1999), posing a potential difficulty for the CDM models with respect to the observations. The numerical, physical or observational analysis of the inner structure of galactic DM halos is beyond the scope of the present paper. Nevertheless, through our models, we shall explore the effects of a possible shallow core on the properties of the disc galaxies.
We shall introduce artificial shallow cores to our haloes. We look for that the scaling parameters of the cores to be introduced are in rough agreement with the rotation curves of low SB galaxies, taking into account the contraction of their haloes after disc formation. Since the density profile given by eq. (3) is in rough agreement with that observed low SB rotation curves suggest, it is reasonable to use this profile for the galaxy halos. As a matter of fact, the shape of this profile is similar to the typical density profile of our models (and to the NFW profile) except for the inner regions where . Therefore, we deform ad hoc the inner profile of our DM haloes by smoothly imposing the behavior from a given radius down to the center, where is the radius at and . Because our approach is evolutionary, we need to introduce the mentioned deformation at all the times. Unfortunately, we only have information at , therefore, for all the other epochs we use with the same defined at . The fittings applied by KKBP98 to low SB galaxies and to the haloes obtained in their simulations show that the two scaling parameters of the profile (3), and , are linked. This allows us to roughly fix given other parameter as or (see also Burkert 1995). With the formation of a disc —even if this is of low surface density— the original mass distribution of the dark halo changes. For instance, a model with the average MAH and (low SB model) where the shallow core given by ec. (3) whith normalized to observations is introduced, after disc formation presents a too small for its . Now, if we increase for the initial halo, then at some value the parameters and of the system after disc formation will agree with the parameters estimated for the observed low SB galaxies. The agreement occurs when increases roughly by a factor 1.4 with respect to the the KKBP98 estimates.
The main influence of the introduction of a shallow core in the DM haloes appears on the dynamics of the galaxy system. The same models presented in Figure 5 were again calculated but with the inclusion of a shallow core in the DM haloes. This core was introduced as described above: we deformed our DM haloes in order their density profiles fitted eq.(3) with the scaling parameters inferred by KKPB98 from rotation curves of low SB galaxies but making the core size () 1.4 times larger in order to “return back” the halo to its initial structure before disc formation. The obtained model rotation curve decompositions are plotted in Figure 11. The disc component contribution to the total rotation curve is now more significant than in the models plotted in Fig. 5, and is in better agreement with several observational and theoretical studies (see ). The ratios for the catalog models of calculated with the modified DM haloes are plotted in Fig. 6 (empty circles). It is also important to note that the inclusion of a shallow core helps to obtain nearly flat rotation curves for models with small values of and/or high values of that, otherwise, would have too steep rotation curves (see the end of ).
The inclusion of a shallow core in the DM haloes does not produce considerable changes in the SSD, scale lengths, and gas fractions of the models. Some influence appears on . The relation slightly shifts to the low velocity side (see Figure 7, empty circles), being even in better agreement with the estimates from the observations than in the case of the models without core. On average, the amplitude of this relation increases log . The shallow core refers only to the most inner regions of the halo-galaxy system. Therefore, its influence on the is small because the of the original halo (without gravitational contraction due to disk formation) is typically attained at radii larger than the disc size, i.e. far from the shallow core region.
Our models, which include the adiabatic contraction of the DM due to disc formation, suggest that (i) the original haloes of the present-day low SB galaxies had to have a shallow core larger by roughly a factor 1.4 than that their rotation curves suggest according to KKBP98, and (ii) the dynamics of normal (high SB) disc galaxies could be better explained if the original DM haloes had such a core. The inner structure of the galaxy dark haloes offers an important test for structure formation theories (Moore 1994; Flores & Primack 1994; Burkert 1995; Moore et al. 1999). More observational efforts are necessary in this direction.
7 Summary and conclusions
We have studied the formation and evolution of disc galaxies in a CDM0.35 cosmology. We constructed a self-consistent model trying to avoid free parameters. Our main assumptions were (i) spherical symmetry and adiabatic invariance during the gravitational collapse of the DM, (ii) aggregation of the baryon matter to the disc in form of gas (no merger) with a rate given by the cosmological aggregation rate, (iii) detailed angular momentum conservation and adiabatic invariance during the gas collapse, and (iv) stationarity and self-regulation of SF in the disc. The obtained different density profiles of DM haloes and the dispersion agree with the results of cosmological N-body simulations (Avila-Reese et al. 1999). The most typical profiles are well described by the NFW profile. The properties of the model galaxies depend upon three initial factors: mass, MAH, and spin parameter, . The results allow us to predict and to understand several observational features of disc galaxies:
(1) Within the observational and theoretical uncertainties, we find that the slope and zero-point of the TFR in the and bands may be directly determined by the cosmological initial conditions, principally the power spectrum of fluctuations of the CDM models. The relation (TFR) remains the same for different disc mass fractions , in the cases where the disc makes a non-negligible gravitational contribution to the total rotation curve (when for the cosmological parameters used here). The TFR can be used to normalize the power spectrum at galaxy scales independently of uncertainties due to the assumed . -normalized low density CDM models are favoured by this normalization.
(2) The rms scatter in the TFR, according to our models, is produced by the scatter in the halo formation histories (MAHs) and by the dispersion of . As a result of compensating effects, the quadratic contribution of the latter is only a 25 per cent in the total rms scatter. Thus, a major contribution to the TFR scatter comes from the stochastic nature of the protogalaxy MAHs. The total scatter we obtain does not disagree with the observational data, but, owing to the observational and theoretical uncertainties, it is still premature to claim definitive conclusions.
(3) We explain why high and low SB galaxies show approximately the same TFR, and why the slope of the correlation among the residuals of the TF and luminosity-radius relations reported by Courteau & Rix (1998) is so small. We obtain similar results to those of Courteau & Rix although the shape of the rotation curves of our models correlates with the SSD and the rotation curves are not strongly dominated by the DM component. For models with a given total (star+gas) disc mass, as the SSD decreases, decreases, but, owing to the dependence of the SF rate on the disc surface density, the stellar mass also decreases. Thus, models of different surface density lie on the same relation in the plane. Indeed, as our models and the observational data show, the disc gas fraction () strongly correlates with the SSD (SB).
(4) For a given , the shapes of the rotation curves are steeper as decreases or as the MAH is more active at early epochs (the DM halo is more concentrated). The SSD depends upon and the MAH, which explains why the shape of the rotation curves depends upon the SSD, as the observations indicate. If is too high (), the rotation curves of discs with small ( decrease too fast, and these discs are probably unstable. If is too small (), then low and high SSD galaxies will have very different TFRs, contrary to observations.
(5) The rotation curve decompositions show a dominance of the DM component down to the very central regions for most of the models with . This occurs because the inner density profile of the DM haloes are steep (). The ratio increases with the SSD. On average, for the high SSD models.
(6) The discs in centrifugal equilibrium that form in the centre of evolving CDM haloes with constant in time, and with an accretion rate dictated by the hierarchical MAH, have a nearly exponential SSD distribution. The central SSD strongly depends on , and less on the mass and the MAH.
(7) We have studied the effects a shallow core in the DM haloes would produce on the galaxy properties. We found that the rotation curve decompositions of high SB galaxies agree better with the decompositions inferred from observations when the haloes have a shallow core. Because the rotation curve with a shallow core tends to be flatter, the minimum possible value of and the fraction of unstable discs decrease. On average, for the high SSD models. The introduction of shallow cores slightly shifts the models in the plane towards lower velocities, improving the agreement with the estimates inferred from the and band TFRs.
The disc galaxy evolution models presented here make use of several ingredients of the CDM-based hierarchical formation scenario. We assumed that the hierarchical aggregation of mass takes place as a gentle accretion process, discarding major mergers. Although a realistic galaxy formation model should take into account both accretion and merging, in the case of disc galaxies, the former could not have played an important role. One expects that the aggregation of baryon matter was more uniform and gentle than that of the DM due to its hydrodynamical properties and due to the re-heating at high redshifts (e.g. Blanchard, Valls-Gabaud, & Mamon 1992). Thus, even if the DM haloes suffered an active merging process, luminous galaxies could have formed within large haloes in the way envisaged in the extended collapse picture. Our results showed that several structural and dynamical properties of disc galaxies and their correlations are closely related to the cosmological background, whereas other are consequence of evolutionary processes. Among the former, the disc density and velocity profiles, and the TFR are remarkable and they agree with the observations for the CDM0.35 universe used here. However, we should also emphasize that the inner structure of the CDM haloes and probably the scatter of the TFR, are in conflict with observations. Both are probably associated with the statistical nature of the primordial fluctuation field (Gaussian?) and/or to the nature of the DM particles.
Acknowledgments
We thank Julieta Fierro, Michael Richer, and Xavier Hernández for helpful comments and for critically reading the original manuscript. We also thank S. Courteau for providing the data shown in Fig. 10a in electronic form and F. Angeles for computing assistance. We are grateful to the announymous referee for comments which were very helpful to improve the quality of the paper.
References
- [] Athanassoula E., Bosma A., Papaioannou S., 1987, A&A, 179, 23
- [] Avila-Reese V., 1998, PhD. Thesis, U.N.A.M.
- [] Avila-Reese V., Firmani C., 2000, RevMexAA, in press
- [] Avila-Reese V., & Vázquez-Semadeni, E. 1999, preprint
- [] Avila-Reese V., Firmani C., Hernández X., 1998, ApJ, 505, 37 (AFH98)
- [] Avila-Reese V, Firmani C. Klypin A., Kravtsov A., 1999, MNRAS, 309, 507
- [] Baugh C.M., Cole S., Frenk C.S., 1996, MNRAS, 283, 136
- [] Bernstein G.M., Guhathakurta P., Raychaudhury S., Giovanelli R., Haynes M.P., Herter T., Vogt N.P., 1994, AJ, 107, 1962
- [] Blanchard A., Valls-Gabaud D., Mamon G., 1992, A&A, 264, 365
- [] Blitz L., Spergel D.N., Teuben P.J., Hartmann D., Burton W.B., 1998, ApJ, 514, 818
- [] Bond J.R., Cole S., Efstathiou G., Kaiser N., 1991, ApJ, 379, 440
- [] Bottema R., 1993, A&A, 275, 16
- [] _____., 1997, A&A, 328, 517
- [] Bower R., 1991, MNRAS, 248, 332
- [] Bryan G.L., Norman M.L., 1998, ApJ, 495, 80
- [] Burkert A., 1995, ApJ, 447, L25
- [] Carignan C., Freeman K.C., 1985, ApJ, 292, 494
- [] Carlberg R., 1985 in “The Milky Way Galaxy”, Proc. of the 106th Symposium (Dordrecht, D. Reidel Publishing Co.), 615
- [] Casertano S., van Gorkom J.H., 1991, AJ, 101, 1231
- [] Cole S., Lacey C., 1996, MNRAS, 281, 716
- [] Cole S., Aragon-Salamanca A., Frenk C.S., Navarro J., Zepf S. 1994, MNRAS, 271, 781
- [] Corsini E.M. et al., 1998, A&A, 342, 671
- [] Courteau S., 1996, ApJS, 103, 363
- [] _____., 1997, AJ, 114, 2402
- [] Courteau S., Rix H.-W., 1998, ApJ, 513, 561
- [] Crone M., Evrard A.E., Richstone D.O., 1994, ApJ, 434, 402
- [] Dalcanton J.J., Spergel D.N., Summers F.J., 1997, ApJ, 482, 659
- [] Debattista V.P., Sellwood J.A., 1998, ApJ, 493, L5
- [] Dubinski J., Carlberg R., 1991, ApJ, 378, 496
- [] Eisenstein D.J., Loeb A.1996, ApJ, 459, 432
- [] Eke V., Navarro J.F., Frenk C.S., 1998, ApJ, 503, 569
- [] Elizondo D., Yepes G., Kates R., Muller V., Klypin A., 1998, ApJ, 515, 525
- [] de Blok W.J.G., McGaugh S.S., 1997, MNRAS, 290, 533
- [] Faber S., 1981, in “Astrophysical Cosmology”, eds.M.S. Longair, Coyne G.V., H.A. Brück (Pontificia Academia Scientarium:Citta del Vaticano), p.191
- [] Fall S.M., Efstathiou G., 1980, MNRAS, 193, 189
- [] Fillmore J.A., Goldreich P., 1984, ApJ, 281, 1
- [] Firmani C., Avila-Reese V., 1999, in “Observational Cosmology: The Development of Galaxy Systems”, eds. G.Giuricin, M.Mezzetti & P.Salucci, ASP Conf. Series vol. 174, 406
- [] Firmani C., Tutukov A.V., 1994, A&A, 288, 713
- [] Firmani C., Avila-Reese V., Hernández X., 1997, in “Dark and visible matter in galaxies”, eds. M.Persic & P.Salucci, ASP Conf. Series, v. 117, 424
- [] Firmani C., Hernández X., Gallagher, 1996, A&A, 308, 403
- [] Flores R.A., Primack J.R., 1994, ApJ, 427, L1
- [] Flores R.A., Primack J.R., Blumenthal G.R., Faber S.M., 1993, ApJ, 412, 443
- [] Franco J., Santillán A., Martos M., 1995, in “The formation of the Milky Way”, G.Tenorio-Tagle, M.Prieto, & Sánchez, F. eds. (Cambridge Univ. Press), p. 515
- [] Frenk C.S., White S.D.M., Davis M., Efstathiou G.P., 1988, ApJ, 327, 507
- [] Fukugita M., Hogan C.J., Peebles P.J.E., 1998, ApJ, 503, 518
- [] Gavazzi G., 1993, ApJ, 419, 469
- [] Giovanelli R., Haynes M.P., Herter T.H., Vogt N.P., da Costa L.N., Freudling W., Salzer J.J., Wegner G., 1997, AJ, 113, 53
- [] Gottlober S., Klypin A., Kravtsov A., 1999, in “Observational Cosmology: The Development of Galaxy Systems”, eds. G.Giuricin, M.Mezzetti & P.Salucci, ASP Conf. Series vol. 174, 418
- [] Gunn J.E., 1977, ApJ, 218, 592
- [] _____., 1982, in “Astrophysical Cosmology”, eds.M.S. Longair, Coyne G.V., & H.A. Brück (Pontificia Academia Scientarium: Citta del Vaticano), p.191
- [] _____., 1987, in “The Galaxy”, G. Gilmore & B. Carswell, eds. (Reidel Publishing Company), p.413
- [] Hoffman Y., 1988, ApJ, 328, 489
- [] Hoffman Y., Shaham J., 1985, ApJ, 297, 16
- [] Jimenez R., Heavens A.F., 1999, MNRAS, in press
- [] Jimenez R., Padoan P., Matteucci F., Heavens A.F., 1998, MNRAS, 299, 123
- [] Kauffmann G., White S.D.M., Guiderdoni B., 1993, MNRAS, 264, 201
- [] Kennicutt R.C., 1989, ApJ, 344, 685
- [] Kravtsov A., Klypin A., Bullock J. Primack J., 1998, ApJ, 502, 48 (KKBP98
- [] Kull A., 1999, ApJ, 516, L5
- [] Lacey C.G., Cole S., 1993, MNRAS, 262, 627
- [] Lacey C.G., Silk J., 1993, ApJ, 402, 15
- [] López-Corredoira, M., Beckman, J.E., & Casuso, E. 1999, A&A, accepted
- [] Lokas E.L., 1999, MNRAS, submited (astro-ph/9901185)
- [] Mac Low M.-M., McCray R., Norman M.L., 1989, ApJ, 337, 141
- [] Mathewson D.S., Ford V.L., 1994, ApJ, 434, L39
- [] McGaugh S.S., de Blok W.J.G., 1997, ApJ, 481, 689
- [] Mo H.J., Mao S., White S.D.M., 1998, MNRAS, 295, 319 (MMW98)
- [] Moore B., 1994, Nature, 370, 629
- [] Navarro J.F., 1998, preprint (astro-ph/9807084)
- [] Navarro J.F., Steinmtetz M., 1997, ApJ, 478, 13
- [] Navarro J.F., Frenk C.S. White S.D.M., 1996, ApJ, 462, 563
- [] _____., 1997, ApJ, 490, 493
- [] Nusser A., Sheth R., 1998, MNRAS, 303, 685
- [] Padmanabhan T., 1993, “Structure formation in the universe” (Cambridge Univ. Press, New York)
- [] Peletier R.F., Willner S.P., 1993, ApJ, 418, 626
- [] Persic M., Salucci P., 1988, MNRAS, 234, 131
- [1] Persic M., Salucci P., Stel F., 1996, MNRAS, 281, 27
- [] Pierce, M.J., Tully, R.B., 1988, ApJ, 330, 579
- [] Quinn P.J., Salmon J.K., Zurek W.H., 1986, Nature, 322, 329
- [] Rees M.J., Ostriker J.P., 1977, MNRAS, 179, 541
- [] Rothberg B., Saunders W., Tully R.B., P.L. Witchalls 1999, ApJ, accepted (astro-ph/9911053)
- [] Ryden B.S., Gunn J.E., 1987, ApJ, 318, 15
- [] Sackett P.D., 1997, ApJ, 483, 103
- [] Sancisi R., van Albada, T.S., 1987, in “Dark matter in the universe”, IAU Symposium 117, eds. J.Kormendy, & G.R.Knapp, (Reidel:Dordrecht), p.67
- [] Sellwood J.A., Carlberg R.G., 1984, ApJ, 282, 61
- [] Silk J., 1977, ApJ, 211, 638
- [] _____., 1997, ApJ, 481, 703
- [] Skillman E.D., 1987, in “Star Formation in Galaxies”, ed. C.J. Lonsdale (NASA Conf. Publ. N0. 2466, Washington), 263
- [] Slavin J.D., Cox D.P., 1992, ApJ, 392, 131
- [] Somerville R.S., Primack J.R., 1998, MNRAS, accepted (astro-ph/9802268v2)
- [] Steinmetz M., Navarro J.F., 1998, preprint (astro-ph/9808076)
- [] Syer D., White S.D.M., 1998, MNRAS, 293, 337
- [] Thronson H.A., Greenhouse M.A., 1988, ApJ, 327, 671
- [] Toomre A., 1964, ApJ, 139, 1217
- [] Tóth G., Ostriker J.P., 1992, ApJ, 389, 5
- [] Tully R.B., Fisher J.R., 1977, A&A, 54, 661
- [] Tully R.B., & Pierce J.P. 1999, ApJ, accepted ( astro-ph/9911052)
- [] Tully R.B., Verheijen M.A.W., 1997, ApJ, 484, 145
- [] Tully R.B., Verheijen M.A.W., Pierce M.J., Huang J.-S., Wainscoat R.J., 1996, AJ, 112, 2471
- [] van den Bosch F.C., 1998, ApJ, 507, 601
- [] van der Kruit P.C., 1987, A&A, 173, 59
- [] Verheijen M.A.W., 1997, PhD. Thesis, Groningen University
- [] Warren M.S., Quinn P.J., Salmon S.K., Zurek W.H., 1992, ApJ, 399, 405
- [] Weil M.L., Eke V.R., Efstathiou G., 1998, MNRAS, 300, 773
- [] White S.D.M, Frenk C.S., 1991, ApJ, 379, 52
- [] White S.D.M., Rees M., 1978, MNRAS, 183, 341
- [] Willick J.A., Courteau S., Faber S., Burstein D., Dekel A., 1995, ApJ, 446, 12
- [] Willick J.A., Courteau S., Faber S., Burstein D., Dekel A. Kolatt T., 1996, ApJ, 457, 460
- [] Wolfe A., Turnshek D.A., Smith H.E., Cohen R.D., 1986, ApJS, 61, 249
- [] Zaroubi S., Hoffman Y., 1993, ApJ, 416, 410
- [] Zaroubi S., Naim A., Hoffman Y., 1996, ApJ, 457, 50
- [] Zurek W.H., Quinn P.J., Salmon J.K., 1988, ApJ, 330, 519
- [] Zwaan M.A., van der Hulst J.M., de Blok W.J.G., McGaugh S.S., 1996, MNRAS, 273, 35
| 55.3 | 0.101 | 0.33 | |
| 112.0 | 0.093 | 0.31 | |
| 221.0 | 0.075 | 0.25 |
| 68.4 | 0.110 | 0.38 | |
| 136.0 | 0.104 | 0.36 | |
| 270.0 | 0.095 | 0.33 |