Comparison of Star Formation Rate estimations
from , FIR and radio data
Abstract
We used three indicators of massive star formation: , FIR and non-thermal radio luminosities, to compare estimations of Star Formation Rate (SFR) for the sample of 34 spiral galaxies. To adjust SFR values, obtained from different indicators, we considered the slope and/or upper mass limit of Initial Mass Function (IMF) as free parameters. The best agreement between these indicators reaches for and in the high mass end of IMF (). Parallel with SFR we also estimated FIR excess defined as a fraction of the observed FIR which is not related to young massive stars directly. is found to be well correlated with types of spiral galaxies and their colors (B-V): the redder a galaxy the higher is its FIR excess. We conclude that for any parameters of IMF the observed FIR flux of early type spiral galaxies needs the additional source of energy but the massive star radiation.
keywords:
galaxies, star formation rate, spiral galaxiesOne of the most important quantitative of ongoing star formation is star formation rate (SFR) defined as a total mass of stars in a time unit. Young stars reveal themselves in different spectral bands which allows us to determine SFR using luminosity of a galaxy in selected spectral bands or lines. One can evaluate SFR using luminosity of galaxies in emission line, far infrared continuum (FIR) and in radiocontinuum based on the model results (see review by Condon, 1992). These indicators are sensitive to the presence of massive stars and hence they bear information about current SFR on scales less than yrs.
Comparison of SFR values obtained from different indicators enables to constrain some model parameters, such as present day initial stellar mass function (IMF) and to make some conclusions about the applicability of the SFR indicators in galaxies of different types.
Ultraviolet radiation from O and B stars is the source of luminosity of galaxies in emission line . Following Kennicutt (1983), and Dopita, Ryder (1994), we use the equation
| (1) |
Here is IMF, and are luminosity and lifetime of stars of mass . To estimate these values the analytical approximation from Dopita, Ryder (1994) is used:
This approach is sensitive to the extinction of inside of galaxies. According to Israel, Kennicutt (1980), Kennucutt (1983), Devereux, Scowen (1994), Devereux et al. (1997), we assume extinction .
Significant fraction of stellar bolometric luminosity is re-emitted by the dust in FIR continuum at 10 – 1000 . FIR flux is the most sensitive to the presence of stars with mass of order of several . According to Thronson, Telesco (1986)
| (2) |
where - is a fraction of ionizing radiation absorbed by the dust, is a time which a star spends in a dusty star forming region. We assume it to be yrs or if the lifetime is shorter. l(m) is bolometric luminosity for stars of main sequence taken from Mas-Hesse, Kunth (1991).
Synchrotron radio flux may be considered as a third indicator of star formation in galaxies. One can separate non-thermal and thermal components due to different slopes of their spectra. A thermal component at the frequency contributes a fraction of total luminosity , where is the slope of synchrotron spectra (Condon, 1992).
Following Condon (1992) we use following equation which connects non-thermal luminosity of galaxy at frequency range 0.408 – 5 GHz with SFR based on calibration from SN Ib, II rate for our Galaxy (Condon, Yin, 1990, Xu et al., 1994).
| (3) |
Hereafter we assume .
1 Comparison of and ratios
Coefficients in formulae (1 - 3) depend on upper mass limit and on the slope of IMF in the region of high masses.
Variation of allows to explain a wide range of observational relations in spiral galaxies of different types (Zasov, 1995). The slopes of IMF differ from Salpiter’s value -2.35 also have been discussed widely (see reviews in Kennicutt, 1998, Elmegreen, 1999).
We can estimate three independent parameters from equations (1 – 3) by comparing the fluxes taken from observations in FIR, radio continuum and . The first parameter is SFR which depends also on distances of galaxies.
Another two parameters we evaluate are , the fraction of cirrus component in general FIR luminosity which is not connected with current star formation, and one of parameters describing IMF (either the slope of IMF in the region of high mass or upper mass limit). The equations for the observed ratios and may be written as:
| (4) |
| (5) |
Here is the extinction in range, - coefficient which enables to extract non-thermal component of radioflux.
We assume a power law for IMF, following Miller and Scalo, and Kroupa et al.: , where , and .
Here is taken to be -2.5 if we vary the value of , or is variable parameter if is taken as a constant. In the last case we adopt . The cases and for variable and for variable were also considered. They give qualitatively similar results.
2 The sample of galaxies.
Our sample is based on the list of galaxies observed at 4.85 and 1.49 GHz and by IRAS (Condon et al., 1995). We excluded the galaxies which are suspected to have an active nuclear source (”monsters”).
The observed FIR luminosity in the waverange 1 – 1000 was found as , where and are fluxes at 60 and 100 in Jy. is in . is a coefficient which depends on color temperature . In the observed range of C(T) doesn’t change strongly from one galaxy to another (Lonsdale et al. 1995).
The observed luminosities were taken from the data presented by Kennicutt (1983), Kennicutt et al. (1987), Young et al. (1989), Romanishin (1990). They were corrected for the presence of [NII] lines, using relation (Kennicutt, Kent, 1983).
To minimize selection effects we excluded galaxies with optical RC3 diameters from our sample. Also we omitted galaxies which have galactic latitudes less than to exclude effects of absorption in the Galaxy and galaxies with the absolute magnitude exceeding ).
Finally we have excluded two pairs of galaxies which have separation between the components more than aperture for observations. The final sample contains 34 galaxies.
3 Discussion
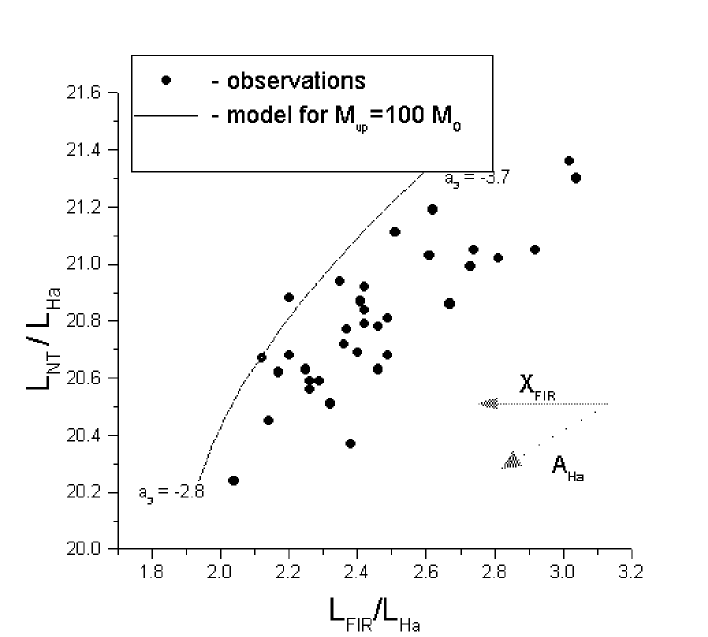
Fig.1 shows the dependence between the observational values of and (points). The solid line shows the model relationship between and . Parameter varies along the line. Arrows show how the corrections for the extinction of and for the presence of cirrus component of FIR shift the observational points in the diagram.

Fig.2 is drawn for the case of variable . The calculated values of and are plotted against morphological types of galaxies of our sample. appears to be strongly dependent on the type and varies from about 0.2 to 0.9. Values of lie between 17 and 78 (except of NGC 3351 where exceeds ) with the average and a high dispersion. Assuming instead of we obtain the average . In general, is dispersed and is systematically lower than usually accepted values 60 – 120 .
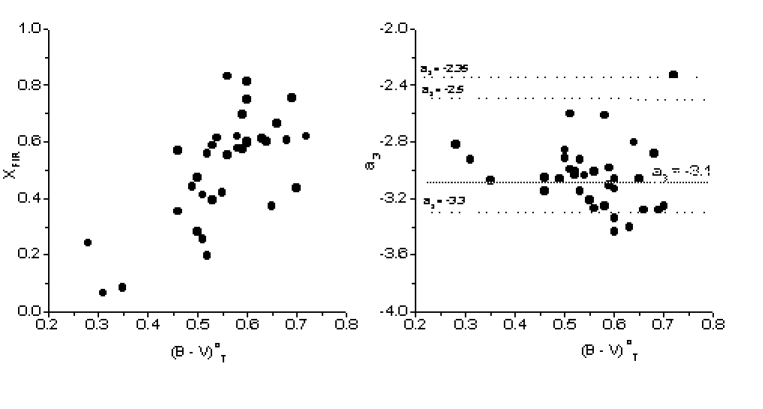
A more definite results were found for variable high-mass slope of IMF . From Fig.3 one can see the dependence of (unlike ) on color indexes of galaxies (from RC3 catalog). For the average value , with dispersion 0.20. For its value is lower ().
The diagram shows that for ”blue” galaxies of our sample between and of FIR radiation traces current star formation. For the galaxies with higher values of we found that a substantial part of FIR radiation does not related to star formation.
Hence for ”red” early type galaxies with lower SFR we have to take into account the part of non-SF cirrus component in FIR luminosity. Only for ”blue” galaxies with with active star formation is a good indicator of the presence of massive stars.
We didn’t find a systematical dependencies of and on luminosities and distances of galaxies, measured from velocity (from RC3). It demonstrates the absence of strong selection effects in the comparison of the observed parameters. Also there is no correlation between , values and abundance of heavy elements which is available for some galaxies of our sample.
Acknowledgements.
I would like to thank professor Anotoliy Zasov for initiation of this work and fruitful discussions and Alexey Moiseev for discussions and help with the sample. This work was partically supported by russian grant RFBR-98-02-17102 and by grant of Federal program ”Astronomy”.References
- [\cuteauthoryearCondon, Yin1990] Condon J., Yin Q., 1990, Ap.J. 357., 97.
- [\cuteauthoryearCondon1992] Condon J., 1992, Ann.Rev.A.Ap. 30, 575.
- [\cuteauthoryearCondon et al.1995] Condon J., Anderson E., Broderick J., 1995, A.J. 109, 2318.
- [\cuteauthoryearDevereux et al.1997] Devereux N., Duric N., Scowen P., 1997, A.J. 113, 236.
- [\cuteauthoryearDevereux, Scowen1994] Devereux N., Scowen P., 1994, A.J. 108, 1244.
- [\cuteauthoryearDopita, Ryder1994] Dopita M., Ryder S., 1994, Ap.J. 430, 163.
- [\cuteauthoryearElmegreen1999] Elmegreen B., 1999, astro-ph/9811289
- [\cuteauthoryearIsrael, Kennicutt1980] Israel G., Kennicutt R., 1980, Ap.J.(Letters) 21, 1.
- [\cuteauthoryearKennicutt1983] Kennicutt R., 1983, Ap.J. 272, 54.
- [\cuteauthoryearKennicutt, Kent1983] Kennicutt R., Kent S., 1983, A.J. 88, 1094.
- [\cuteauthoryearKennicutt et al.1987] Kennicutt R., Keel W., van der Hulst J., 1987, A.J. 93, 1011.
- [\cuteauthoryearKennicutt1998] Kennicutt R., 1998, in ”Starbursts: triggers, nature and evolution”, Springer-Verlag.
- [\cuteauthoryearLonsdale-Persson, Helou1987] Lonsdale-Persson C., Helou G., 1987, Ap.J. 314, 513.
- [\cuteauthoryearMas-Hesse, Kunth1991] Mas-Hesse J., Kunth D., 1991, A.Ap.Suppl. 88, 399.
- [\cuteauthoryearRomanishin1990] Romanishin W., 1990, A.J. 100, 373.
- [\cuteauthoryearThronson, Telesco1986] Thronson H., Telesco C., 1986, Ap.J. 311, 98.
- [\cuteauthoryearYoung et al.1989] Young J., Kenney J., Rice W., 1989, Ap.J.Suppl. 70, 699.
- [\cuteauthoryearXu et al.1994] Xu C., Lisenfeld U. et al., 1994, A.Ap. 282, 19.
- [\cuteauthoryearZasov1995] Zasov A., 1995, Astronomy Letters 21, 652.