ISO Spectroscopy of Young Intermediate-Mass Stars in the BD+40∘4124 Group ††thanks: Based on observations with ISO, an ESA project with instruments funded by ESA Member States (especially the PI countries: France, Germany, the Netherlands and the United Kingdom) and with the participation of ISAS and NASA.
Abstract
We present the results of ISO SWS and LWS grating scans towards the three brightest members of the BD+40∘4124 group in the infrared: BD+40∘4124 (B2Ve), LkH 224 (A7e) and the embedded source LkH 225. Emission from the pure rotational lines of H2, from ro-vibrational transitions of CO, from PAHs, from H i recombination lines and from the infrared fine structure lines of [Fe ii], [Si ii], [S i], [O i], [O iii] and [C ii] was detected. These emission lines arise in the combination of a low-density ( 102 cm-3) H ii region with a clumpy PDR in the case of BD+40∘4124. The lower transitions of the infrared H i lines observed in BD+40∘4124 are optically thick; most likely they arise in either a dense wind or a circumstellar disk. This same region is also responsible for the optical H i lines and the radio continuum emission. In the lines of sight towards LkH 224 and LkH 225, the observed emission lines arise in a non-dissociative shock produced by a slow ( 20 km s-1) outflow arising from LkH 225. Toward LkH 225 we also observe a dissociative shock, presumably located closer to the outflow source than the non-dissociative shock. In the line of sight towards LkH 225 we observed absorption features due to solid water ice and amorphous silicates, and due to gas-phase H2O, CO and CO2. No solid CO2 was detected towards LkH 225, making this the first line of sight where the bulk of the CO2 is in the gas-phase.
Key Words.:
Shock waves – Circumstellar matter – Stars: Formation – H ii regions – ISM: Jets and outflows– Infrared: Stars1 Introduction
The BD+40∘4124 region consists of a few tens of very young stars associated with the probable Herbig Ae/Be stars BD+40∘4124 (= V1685 Cyg), LkH 224 (= V1686 Cyg) and the young multiple system LkH 225 (= V1318 Cyg), all of which have infrared excesses (Strom et al. 1972a; Hillenbrand et al. 1995). Together with NGC 6910, NGC 6914, the BD+41∘3731 region and IC 1318, it is part of the giant star forming region 2 Cyg, at a distance of about 1 kpc (Shevchenko et al. 1991). The stars in the BD+40∘4124 region are significantly younger (ages less than 1 million years) than those in the surrounding OB associations, with the low- and the high-mass stars having formed nearly simultaneously, leading some authors to suggest that star formation in this association might have been induced by the propagation of an external shock wave into the cloud core (Shevchenko et al. 1991; Hillenbrand et al. 1995). The IRAS and AFGL surveys showed a powerful infrared source within the BD+40∘4124 group, but the positional uncertainty did not allow to assign the flux to one of the individual objects in the region. More recent submm continuum maps of the region (Aspin et al. 1994; Di Francesco et al. 1997; Henning et al. 1998) clearly peak on LkH 225, suggesting that it is also dominant in the far-infrared and may be identified with IRAS 20187+4111 (AFGL 2557).
Aspin et al. (1994) have shown LkH 225 to be a triple system oriented north-south. The most northern and southern components, separated by 5″, appear stellar and are photometrically variable at optical and near-infrared wavelengths. The middle component exhibits strong [S ii] emission, suggesting it is a nebulous knot of shock-excited material, not unlike many Herbig-Haro objects (Magakyan & Movseyan 1997). Whereas BD+40∘4124 dominates the association in the optical, the southern component of LkH 225 is brightest in the mid-infrared (Aspin et al. 1994). A K-band spectrum of LkH 225-South by the same authors shows strong ro-vibrational emission lines of molecular hydrogen. Aspin et al. (1994) estimate the total luminosity of this object to be 1600 L⊙, which places it in the luminosity range of the Herbig Ae/Be stars.
Palla et al. (1994) obtained near infrared, CO, C18O, CS, and H2O maser observations of the group. Their high resolution VLA data show that a H2O maser source is clearly associated with LkH 225-South. Moreover, a density concentration in the molecular cloud (as evidenced by CS J=5–4 emission) and a CO outflow are both associated with LkH 225. In their model, LkH 225 is at the center of a dense molecular core of mass 280 M⊙, while BD+40∘4124 lies near the periphery. Continuum radio emission has been detected from BD+40∘4124 and a source 42″ to the east of BD+40∘4124 (Skinner et al. 1993).
The infrared emission-line spectrum of young stellar objects (YSOs) such as those in the BD+40∘4124 group is dominated by the interaction of the central object with the remnants of the cloud from which it formed. If a young stellar object produces intense UV radiation, either due to accretion or because of a high temperature of the central star, an H ii region will develop, producing a rich ionic emission line spectrum. At the edge of the H ii region, a so-called photodissociation or photon-dominated region (PDR) will be created, in which neutral gas is heated by photoelectrically ejected electrons from grain surfaces. Cooling of this neutral gas occurs mainly through emission in atomic fine-structure and molecular lines, allowing us to probe the physical conditions in the PDR through the study of its infrared emission-line spectrum. If the YSO has a strong, often collimated, outflow, it will cause a shock wave as the outflow penetrates in the surrounding molecular cloud, heating the gas. In case the shock has a velocity smaller than 40 km s-1, it will not dissociate the molecular material and mainly cool through infrared molecular transitions. Because the physical conditions from the pre-shock gas to the post-shock gas change gradually within such a non-dissociative shock, they are often called C(ontinuous)-shocks. For higher shock velocities, the molecules will be dissociated and cooling in the shock occurs mainly through atomic and ionic emission lines. In such a shock, the physical conditions from the pre- to the post-shock gas will change within one mean free path and therefore they are usually termed J(ump)-shocks. In the post-shock gas of a J-shock, molecules will re-form and cool down the gas further. Therefore a dissociative shock will produce an infrared spectrum consisting of a combination of ionic and molecular emission lines.
In this paper we present Infrared Space Observatory (ISO; Kessler et al. 1996) spectroscopic data obtained at the positions of BD+40∘4124, LkH 224 and LkH 225. Some of the H2 lines included in this data-set were already analyzed in a previous letter (Wesselius et al. 1996). Here we will re-analyze an extended set of H2 data using the latest ISO calibrations, in combination with new data on infrared fine-structure lines, gas-phase molecular absorption bands and solid-state emission features in the BD+40∘4124 group. We will show that the infrared emission lines arise from the combination of a H ii region and a PDR at the position of BD+40∘4124, from a non-dissociative shock at the position of LkH 224, and from the combination of a non-dissociative and a dissociative shock at the position of LkH 225. We will also discuss the unusual absorption-line spectrum seen in the line of sight towards LkH 225 and briefly discuss its implications for the physical and chemical evolution of hot cores.
2 Observations
We obtained ISO Short Wavelength (2.4–45 m) Spectrometer (SWS; de Graauw et al. 1996a) and Long Wavelength (43–197 m) Spectrometer (LWS; Clegg et al. 1996) grating scans at the positions of BD+40∘4124, LkH 224 and LkH 225. For all three positions, both SWS scans covering the entire SWS wavelength range (“AOT 01”) and much deeper scans covering small wavelength regions around particularly useful diagnostic lines (“AOT 02”) were obtained. For LWS only scans covering the entire wavelength region were obtained. A full log of the observations is given in Table 1.
| Object | AOT | Rev. | Date | JD2450000 |
|---|---|---|---|---|
| BD+40∘4124 | SWS 02 | 142 | 07/04/1996 | 181.037 |
| SWS 02 | 159 | 24/04/1996 | 197.635 | |
| SWS 01 | 355 | 05/11/1996 | 393.283 | |
| LWS 01 | 768 | 23/12/1997 | 805.525 | |
| LkH 224 | SWS 02 | 142 | 07/04/1996 | 180.960 |
| SWS 01 | 858 | 22/03/1998 | 894.920 | |
| LkH 225 | SWS 02 | 142 | 07/04/1996 | 180.996 |
| SWS 02 | 355 | 05/11/1996 | 393.306 | |
| SWS 01 | 858 | 22/03/1998 | 894.889 | |
| LWS 01 | 142 | 07/04/1996 | 181.017 |
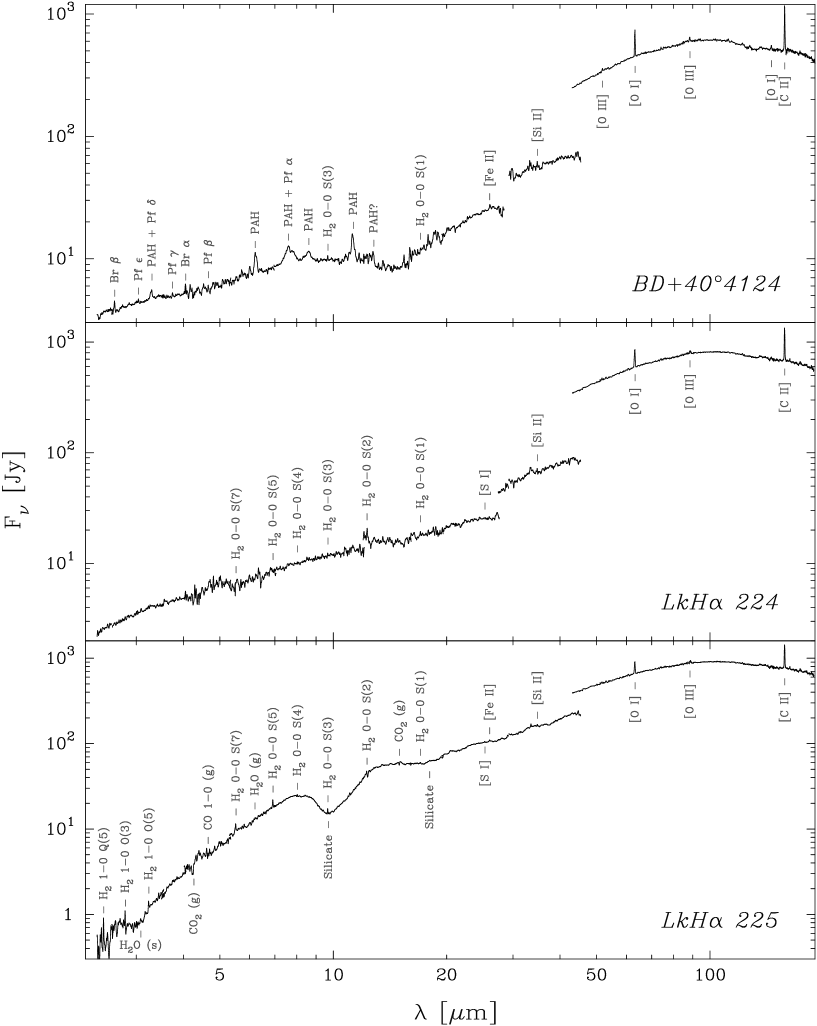
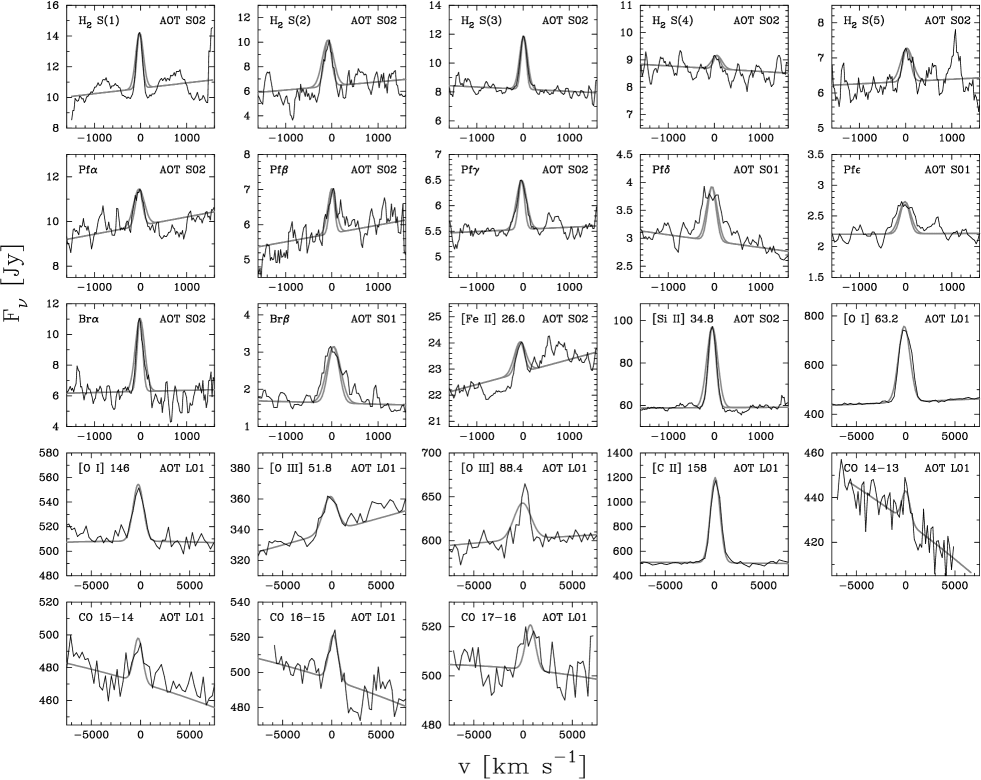
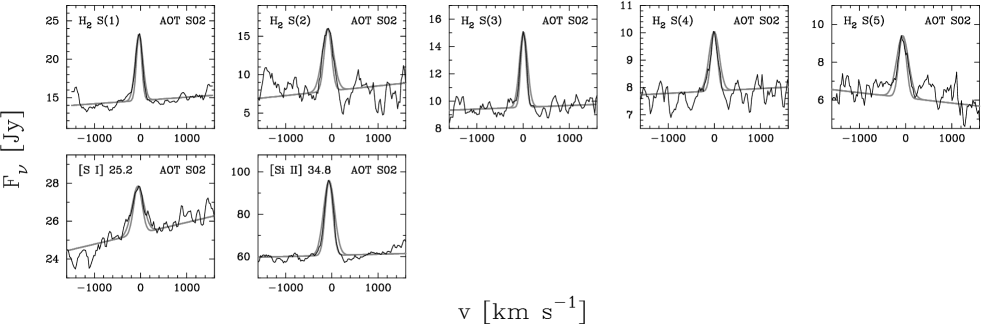
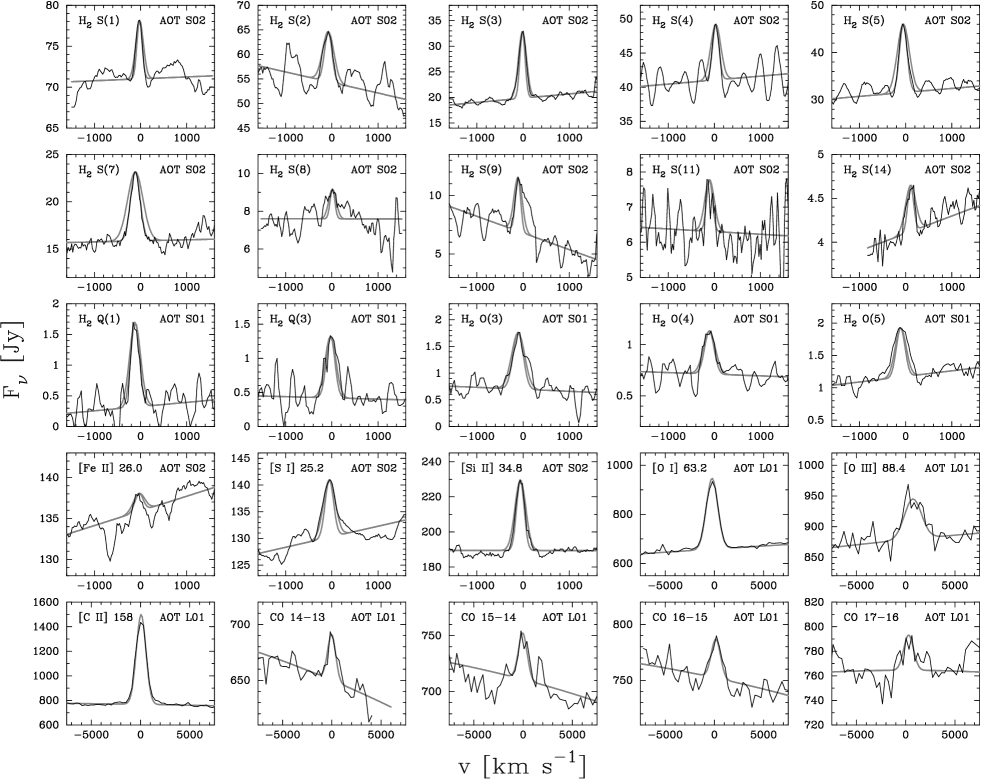
Data were reduced in a standard fashion using calibration files corresponding to ISO off-line processing software (OLP) version 7.0, after which they were corrected for remaining fringing and glitches. To increase the S/N in the final spectra, the detectors were aligned and statistical outliers were removed, after which the spectra were rebinned to a lower spectral resolution. Figure 1 shows the resulting ISO spectra. Plots of all detected lines, rebinned to a resolution of 2000 with an oversampling factor of four (SWS), or averaged across scans (LWS), are presented in Figs. 2–4. Line fluxes for detected lines and upper limits (total flux for line with peak flux 3) for the most significant undetected lines are listed in Table 2.
For BD+40∘4124 and LkH 224, all detected lines appear at their rest wavelength within the accuracy of the ISO spectrometers. For LkH 225, all lines in the SWS spectra are systematically shifted by 100 km s-1. This could either be a reflection of the real spatial velocity of LkH 225 or be caused by a slight offset between our pointing, based on the optical position of the source, and the position of the infrared source. For all three sources, the lines are unresolved, indicating that the velocity dispersion is smaller than a few hundred km s-1.
For each complete spectral scan, the SWS actually makes twelve different grating scans, each covering a small wavelength region (“SWS band”), and with its own optical path. They are joined to form one single spectrum (Fig. 1). Because of the variation of the diffraction limit of the telescope with wavelength, different SWS bands use apertures of different sizes. For a source that is not point-like, one may therefore see a discontinuity in flux at the wavelengths where such a change in aperture occurs. This effect can indeed be seen in some of our spectra, indicating the presence of extended far-infrared emission throughout the region.
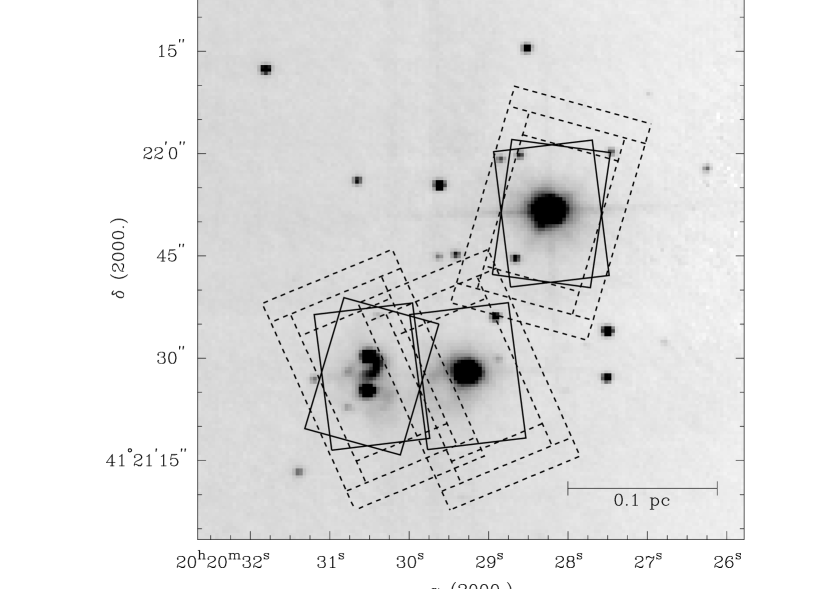
Since both grating spectrometers on board ISO use apertures that are fairly large compared to the separation of sources in most star forming regions, some caution is appropriate in interpreting such measurements. We created a plot with the positions of the SWS apertures, overlaid on a K′-band image of the region (Hillenbrand et al. 1995), shown in Fig. 5. As can be seen from this figure, only one strong near-infrared source is included in the BD+40∘4124 and LkH 224 measurements, whereas the LkH 225 measurement only includes the question-mark shaped infrared nebula formed by the point-like objects LkH 225-North and LkH 225-South and the bridging nebula LkH 225-Middle. ISO-LWS has a beam that is larger (61–83″ FWHM) than the separation of the objects studied here. Therefore the LWS measurements of BD+40∘4124 and LkH 225 partly cover the same region. The LWS spectrum of LkH 224 shown in Fig. 1 is a weighted average of these spectra.
Accuracies of the absolute flux calibration in the SWS spectra range from 7% in the short-wavelength ( 4.10 m) part to 30% in the long wavelength ( 29 m) part (Leech et al. 1997). The LWS absolute flux calibration is expected to be accurate at the 7% level (Trams et al. 1997). Note that the applied flux calibration is based on the assumption that we are looking at a point source. For an extended source, the diffraction losses will be underestimated and in particular at the long-wavelength part of the LWS, these corrections will exceed the quoted uncertainty.
![[Uncaptioned image]](/html/astro-ph/0001214/assets/x5.png)
3 Spectral energy distributions
A Spectral Energy Distribution (SED) for BD+40∘4124 was constructed by combining UV, optical, infrared, submm and radio data of BD+40∘4124 from literature (Wesselius et al. 1982; Strom et al. 1972a; Terranegra et al. 1994; Hillenbrand et al. 1992, 1995; Cohen 1972; Lorenzetti et al. 1983; Di Francesco et al. 1997; Corcoran & Ray 1998; Skinner et al. 1993; Bertout & Thum 1982) with our new ISO spectra (Fig. 6a). As can be seen from this plot, the optical to submm photometry forms a smooth curve. At radio wavelengths the slope of the energy distribution appears significantly flatter. We interpret this SED as the sum of three components: continuum emission from the central star in the UV and optical, thermal emission from dust heated by the central star in the infrared to submm and free-free emission from the stellar wind or an H ii region at cm wavelengths. The SWS spectrum of BD+40∘4124 shows a rising continuum component starting around 13 m. This component is not present in the infrared photometry by Cohen (1972). This could be due to the smaller aperture size or the chopping throw used for background subtraction by Cohen. We interpret this second dust component, only visible in the ISO data, as diffuse emission throughout the star forming region.
There is general consensus in the literature that the spectral type of BD+40∘4124 is about B2 Ve+sh (Merrill et al. 1932; Herbig 1960; Strom et al. 1972b; Swings 1981; Finkenzeller 1985; Hillenbrand et al. 1995), corresponding to an effective temperature = 22,000 K and surface gravity = 4.0 (Schmidt-Kaler 1982). With this spectral type and the optical photometry by Strom et al. (1972a) we arrive at a value of towards the optical star. This value agrees well with the derived from the diffuse interstellar band at 5849Å (Oudmaijer et al. 1997). With this value and assuming a normal interstellar extinction law (i.e. = = 3.1), we corrected the data for extinction.
A Kurucz (1991) stellar atmosphere model with and corresponding to the star’s spectral type (assuming solar abundance) was fitted to the extinction-corrected UV to optical SED. The fit is also shown in Fig. 6a. As can be seen from this figure, the SED fit is not perfect in the UV. Possibly a UV excess due to a strong stellar wind is present in BD+40∘4124. The fitted Kurucz model was used to compute an apparent stellar luminosity for BD+40∘4124, which was converted to an absolute stellar luminosity using the BD+40∘4124 distance estimate of 1 kpc by Shevchenko et al. (1991). Infrared luminosities were computed by fitting a spline to the infrared to mm data and subtracting the Kurucz model from this fit. The derived values for the optical and infrared luminosity of BD+40∘4124 are and L⊙, respectively. These luminosities place the star close to the zero-age main sequence position of a 10 M⊙ star in the Hertzsprung-Russell diagram (HRD).
We followed the same procedure to construct a SED for LkH 224, combining optical, infrared and submm photometry from literature (Strom et al. 1972a; Shevchenko, personal communication; Hillenbrand et al. 1995; Cohen 1972; Di Francesco et al. 1997) with our new ISO spectra. It is shown in Fig. 6b. Since LkH 224 is strongly variable in the optical, the data used in the SED were selected to be obtained near maximum system brightness, when available. The optical to infrared photometry of LkH 224 forms a smooth curve in the SED, which we interpret as due to continuum emission from the star in the optical, and thermal emission from dust heated by the central star in the infrared.
There is no agreement in the literature on the spectral type of LkH 224. Wenzel (1980) classified the star spectroscopically as B8e, whereas Hillenbrand et al. (1995) obtained a spectral type of B5 Ve. Corcoran & Ray (1997) derived a spectral type of A0 for LkH 224, based upon the relative strength of the He i 4471 and Mg ii 4481 lines. In the optical, LkH 224 shows large-amplitude photometric variations ( 3m) due to variable amounts of circumstellar extinction (Wenzel 1980; Shevchenko et al. 1991, 1993). In the group of Herbig Ae/Be stars, these large-amplitude variations are only observed when the spectral type is A0 or later (van den Ancker et al. 1998a). Therefore we favour a later spectral type than B for LkH 224. The detection of the Ca ii H and K lines in absorption (Magakyan & Movseyan 1997) also seems to favour a later spectral type than mid-B. Recent optical spectroscopy of LkH 224 by de Winter (personal communication) shows strong, variable, P-Cygni type emission in H. The higher members of the Balmer series (up to H15) are present and in absorption, together with the Ca ii H and K lines. Numerous shell lines are present in the spectrum as well, which could hinder spectral classification solely based upon red spectra. From the available optical spectroscopy, we classify LkH 224 as A7e+sh, corresponding to = 7850 K. We estimate the uncertainty in this classification to be around 2 subclasses, or 400 K.

With the new spectral type of A7e+sh and the optical photometry by Strom et al. (1972a), we derive an at maximum system brightness for LkH 224 of 096. Again fitting a Kurucz model to the extinction-corrected photometry, we derive values for the optical and infrared luminosity of LkH 224 of and L⊙, respectively. The good fit of the SED to the Kurucz model with = 7850 K shows that the photometry is consistent with our adopted spectral type of A7e for LkH 224. Comparing the derived parameters of LkH 224 with the pre-main sequence evolutionary tracks by Palla & Stahler (1993), we see that it is located in the HRD at the location of a yr old 3.5 M⊙ star. This brings the age of the star in good agreement with those of the low-mass members of the BD+40∘4124 group (Hillenbrand et al. 1995).
Again the same procedure as above was followed to construct a SED for LkH 225 (Fig. 6c), combining optical to radio measurements from literature (Shevchenko, personal communication; Hillenbrand et al. 1995; Cohen 1972; Weaver & Jones 1992; Di Francesco et al. 1998; Henning et al. 1998; Cohen et al. 1982) with our ISO data. These data refer to the sum of all components in this object. Since LkH 225 shows strong variability in the optical and infrared, only data obtained near maximum brightness was used in the SED. Like in BD+40∘4124, the SED of LkH 225 consists of a smooth continuum ranging from the optical to the submm. In view of the knowledge of the nature of LkH 225 from literature, this SED must be interpreted as the sum of the three components of LkH 225 in the optical to submm, each consisting of a hot component with circumstellar dust emission. The plotted IRAS fluxes of IRAS 20187+4111 (Weaver & Jones 1992) are smaller than those in the LkH 225 LWS spectrum. Most likely, this is due to the background subtraction applied on the IRAS data. This means that a cool component is present as well throughout the region, covering an area that is larger than the size of the IRAS detectors. In view of submm maps of the region (Aspin et al. 1994; Henning et al. 1998), this seems plausible.
As can be seen in Fig. 6c, below 8 m the flux levels in the SWS spectrum are considerably smaller than those from ground-based photometry at maximum brightness. At longer wavelengths they agree. By extrapolating our ISO SWS spectrum, we deduce that the total band magnitude of LkH 225 was about 83 at the time of our observation. This is within the range of values present in the literature. Above 10 m, the SWS flux levels are in agreement with ground-based measurements, suggesting that the large-amplitude variability of LkH 225 is limited to the optical to near-infrared spectral range.
The spectral type of LkH 225 is very uncertain. Hillenbrand et al. (1995) give a spectroscopic classification of mid A–Fe for both LkH 225-North and LkH 225-South, whereas Wenzel (1980) derives a spectral type of G–Ke for the sum of both components. Aspin et al. (1994) suggested the southern component to be of intermediate-mass, based on its high bolometric luminosity. Unlike for BD+40∘4124 and LkH 224, this makes the direct derivation of very uncertain. Adopting = 497, corresponding to derived from the silicate feature in the next section, results in an optical slope in the energy distribution that is steeper than the Rayleigh-Jeans tail of a black body. This could be because the extinction at the time of the optical observations was smaller than during the ISO observations. Therefore we used a rather uncertain value of = 236, based on the observed colour of LkH 225 and the intrinsic colours of a F0 star, to correct the photometry of LkH 225 for extinction.
To obtain a rough measure for the total luminosity of LkH 225, we fitted a Kurucz model with = 7200 K, corresponding to a spectral type of F0, to the extinction-corrected optical photometry. This results in values of and L⊙ for the total optical and infrared luminosities of LkH 225. We conclude that at least one of the stars in the LkH 225 system must be a massive (5–7 M⊙) pre-main sequence object in order to explain these luminosities.
4 Solid-state features
The ISO full grating scans of BD+40∘4124 consist of a relatively smooth continuum, with a number of strong emission lines superimposed. The familiar unidentified infrared (UIR) emission features at 3.3, 6.2, 7.6, 7.8, 8.6 and 11.3 m, often attributed to polycyclic aromatic hydrocarbons (PAHs), are prominently present. Possibly the 12.7 m feature also observed in other sources showing strong PAH emission (Beintema et al. 1996) is present as well. No 9.7 m amorphous silicate feature, either in emission or in absorption, is visible in the BD+40∘4124 SWS spectrum. The slight curvature in the ground-based 8–13 m BD+40∘4124 spectrum obtained by Rodgers & Wooden (1997), which they interpreted as a silicate feature in emission, is absent in our SWS data.
The continuum in BD+40∘4124 seems to consist of two distinct components, one from 2.4–13 m and the other from 13–200 m. In the SWS range, it is well fit by the superposition of two blackbodies of 320 and 100 K. For the LWS spectrum a significant excess at the long-wavelength part remains after the black-body fit. Probably a range in temperatures is present starting from 100 K down to much lower temperatures. The jumps in the spectrum at the positions corresponding to a change in aperture suggest that this component is caused by diffuse emission in the star forming region.
Remarkably, the line flux measured in the 3.3 m PAH feature of BD+40∘4124 ( W m-2) is much larger than the W m-2 upper limit obtained by Brooke et al. (1993). PAH features also appear absent in the 8–13 m hifogs spectrum shown by Rodgers & Wooden (1997). This could either be an effect of the different aperture size used ( for SWS versus a 14 circular aperture by Brooke et al.) in case the PAH emission is spatially extended, or be due to time-variability of the PAH emission. If the first explanation is correct, the PAH emission should come from a region with a diameter larger than 32 and hence be easily resolvable with ground-based imaging.
The ISO spectrum of LkH 224 consists of one single smooth continuum, with a few emission lines superimposed. No solid-state emission or absorption is apparent in the SWS spectrum. Again the slight curvature seen in the hifogs 8–13 m spectrum of LkH 224 (Rodgers & Wooden 1997) is absent in our SWS data. In view of the fact that most Herbig Ae stars show strong silicate emission in the 10 m range (e.g. van den Ancker 1999), the absence of the silicate feature is quite remarkable. It means that the dust emission must come from a region which is completely optically thick up to infrared wavelengths and yet only produce 3 magnitudes of extinction towards the central star in the optical. It is obvious that such a region cannot be spherically symmetric, but must be highly flattened or have a hole through which we can seen the central star relatively unobscured. A dusty circumstellar disk might be the prime candidate for such a region. The absence of silicate emission in LkH 224 might then be explained by either an intrinsically higher optical depth in its circumstellar disk than those surrounding other Herbig Ae stars, a view supported by its relative youth, or be caused by a nearly edge-on orientation of the circumstellar disk.
The infrared continuum of LkH 224 cannot be fit by a single blackbody. Rather a sum of blackbodies with a range of temperatures starting at several hundreds Kelvins and continuing to temperatures of a few tens of K are required to fit the spectrum adequately. Again the jumps in the spectrum at the positions corresponding to a change in aperture are present, suggesting that at the longer wavelengths we are looking at diffuse emission in the star forming region. However, the slope of the continuum in LkH 224 is significantly different from that of the cool component in BD+40∘4124. This could either be due to a difference in the maximum temperature or to a difference in temperature gradient of the diffuse component between the two positions.
The SWS spectrum of LkH 225 looks very different. Again we have a strong, smooth continuum with many emission lines, but now also absorption lines due to gaseous molecular material as well as strong absorption features due to solid-state material are present. The familiar 9.7 m absorption feature due to the Si–O stretching mode in amorphous silicates is strong. Apart from a 20% difference in the absolute flux levels, the silicate feature looks very similar to what was found by IRAS LRS (Olnon et al. 1986), suggesting that it is constant in time. The integrated optical depth () of the 9.7 m feature in the ISO SWS spectrum is 196 cm-1. The 18 m feature due to the bending mode of Si–O is also present in absorption with an integrated optical depth of 11 cm-1. The O–H bending mode of water ice at 3.0 is present in absorption as well (156 cm-1).
Using intrinsic band strengths from literature (Tielens & Allamandola 1987; Gerakines et al. 1995), we have converted the integrated optical depths of the 9.7 m silicate and 3.0 m H2O features to column densities. The results are a column of molecules for the silicates and molecules for H2O ice. The 2:1 ratio of these two species is within the range of what is found in other lines of sight (Whittet et al. 1996 and references therein). Curiously, CO2 ice, which invariably accompanies H2O ice in all other lines of sight studied by ISO (Whittet et al. 1996; Boogert et al. 1999; Gerakines et al. 1999) is absent in LkH 225. The derived upper limit on the solid CO2/H2O ratio is 0.04, much less than the canonical value of 0.15.
No aperture jumps are visible in the SWS spectrum of LkH 225. The bulk of the continuum flux must therefore come from an area that is small compared to the smallest SWS aperture (). The discontinuity between the SWS and LWS spectra shows that although LkH 225 itself is probably the strongest far-infrared source in the region, the total far-infrared flux of the group is dominated by the diffuse component. Like in LkH 224, the SWS spectrum of LkH 225 cannot be fit well with a single blackbody. Again a sum of blackbodies with a range of temperatures starting at several hundreds and continuing to temperatures of a few tens of K are required to fit the spectrum adequately.
PAHs appear absent in our LkH 225 SWS spectrum. In view of the claim by Deutsch et al. (1994) that the southern component of LkH 225 is the strongest UIR emitter in the region, this is remarkable. One possible explanation for this apparent discrepancy could be the large degree of variability ( 3m in ; Allen 1973) of LkH 225. In this case the component responsible for the PAH emission should have been much fainter than the other component at the time of observation. However, Aspin et al. (1994) showed the southern component to be dominant longward of 3 m. Comparison of our LkH 225 spectrum with infrared photometry by previous authors shows that the source was not near minimum brightness at the time of the SWS observation, making the explanation that the southern component of LkH 225 was faint improbable. The most likely explanation for the apparent discrepancy between our non-detection and the reported UIR emission (Deutsch et al. 1994) might therefore be that the UIR emission within the southern component of LkH 225 is variable in time. Note that because the gas cooling timescale is much longer than the PAH cooling timescale, if PAH emission has been present within recent years, gas emission from a remnant PDR might be expected in the vicinity of LkH 225.
Since extinction in the continuum surrounding the 9.7 m feature is small compared to the extinction within this feature, the extinction at wavelength across a non-saturated 9.7 m feature can simply be obtained from the relation . Using an average interstellar extinction law which includes the silicate feature (Fluks et al. 1994), we can then convert these values of to a visual extinction, resulting in a value of toward LkH 225. This value is significantly smaller than the obtained from the C18O column density towards LkH 225 (Palla et al. 1995). Although smaller, our estimate of is still compatible with the value of derived from the ratio of the 1–0 S(1) and Q(3) lines of H2 (Aspin et al. 1994).
5 Gas-phase molecular absorption lines
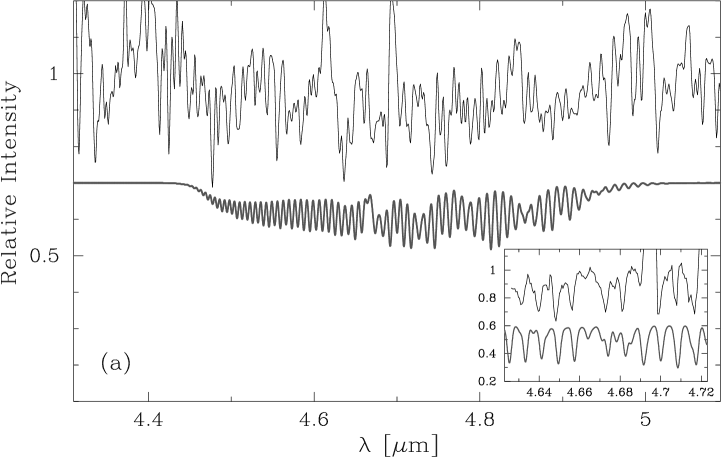
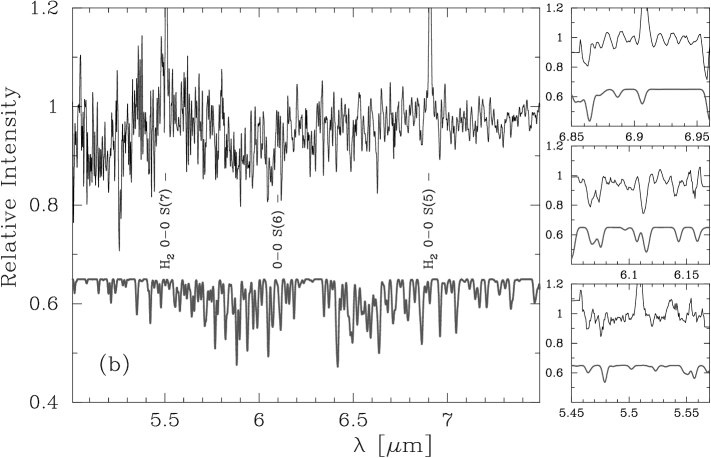
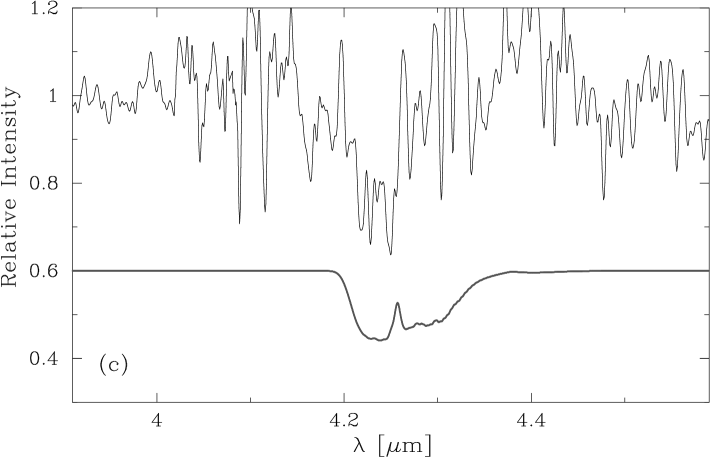
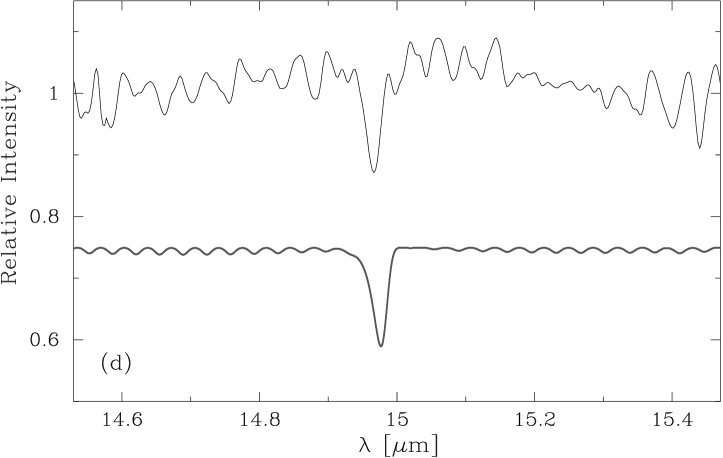
In the SWS spectrum of LkH 225 several absorption bands are present due to a large column of gas-phase CO, CO2 and H2O in the line of sight. They are shown in Fig. 7. Molecular absorption bands are absent in the BD+40∘4124 and LkH 224 spectra. We compared the observed gas-phase absorption lines to synthetic gas-phase absorption bands computed using molecular constants from the HITRAN 96 database (Rothmann et al. 1996). First the relative population of the different levels within one molecule were computed for an excitation temperature . For the relative abundances of the isotopes, values from the HITRAN database were adopted. A Voigt profile was taken for the lines, with a Doppler parameter = for the Gaussian component of the Voigt profile and the lifetime of the considered level times for the Lorentz component. The optical depth as a function of wavelength was then computed by evaluating the sum of all integrated absorption coefficients, distributed on the Voigt profile. Synthetic absorption spectra were obtained by computing . This procedure for computing absorption spectra is nearly identical to that followed by Helmich et al. (1996) and Dartois et al. (1998). For comparison with the observations, the spectra were convolved with the ISO SWS instrumental profile. For the AOT 02 observations, the instrumental profile is nearly Gaussian with a wavelength-dependent resolving power ranging between 1400 and 3000 (Leech et al. 1997). For our AOT 01 observations, the resolution is a factor four lower.
Best fits of the synthetic absorption spectra to the observed CO, CO2 and H2O bands are also shown in Fig. 7. Because of the relatively low signal to noise in the spectra, the fits for the different absorption bands were not done independently, but and were required to be the same for all species. This procedure is only valid if the different molecular species are co-spatial. The results of similar fitting procedures in other lines of sight (e.g. van Dishoeck et al. 1996; Dartois et al. 1998; Boogert 1999) suggest that this is the case. Satisfactory fits to the data could be obtained for excitation temperatures of a few 100 K and a Doppler parameter between 3 and 10 km s-1. The derived column of warm CO2 is several times 1017 cm-2. For H2O it is about 1019 cm-2, whereas the column of gas-phase CO is in the range 1019–1021 cm-2.
The derived values of are much higher than those expected from purely thermal broadening ( km s-1, with the molecular weight in amu; Spitzer 1978). This must be caused by macroscopic motion within the column of warm gas in our line of sight toward LkH 225. The fact that our deduced values of are within the range of those found toward hot cloud cores (Helmich et al. 1996; van Dishoeck & Helmich 1996; Dartois et al. 1998) suggests that it is due to turbulence within the cloud rather than a dispersion in large-scale motion such as infall or rotation.
6 Hydrogen recombination lines
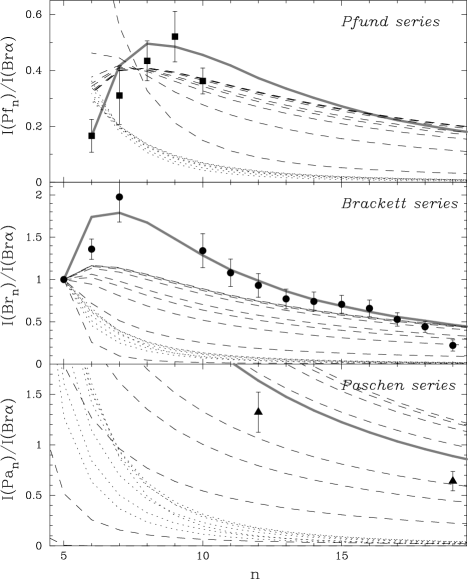
The ISO SWS spectrum of BD+40∘4124 contains several emission lines of the Pfund and Brackett series of H i. No H i lines were detected in LkH 224 and LkH 225. The lines fluxes for BD+40∘4124 were corrected for extinction using the value of = 30 derived in section 3. We combined these data with ground-based measurements of emission lines in the Brackett and Paschen series (Harvey 1984; Hamann & Persson 1992; Rodgers & Wooden 1992) for BD+40∘4124 to create plots of the H i line flux ratio as a function of upper level quantum number (Fig. 8). The fact that the values for the Brackett series lie on a continuous curve shows that they are not influenced much by the different beam sizes used, indicating that they must originate in a compact region.
In Fig. 8 we also show predicted values for Menzel & Baker (1938) Case B recombination for a range of temperatures from 1000 to 30,000 K and densities from 103 to 109 cm-3, taken from Storey & Hummer (1995). The fit of the Case B values to the data is poor, indicating that at least the lower lines in the Pfund and Brackett series are not optically thin, as assumed in Case B recombination theory, but have 1. An error in our estimate of the extinction towards the line emitting region cannot reconcile our observations with the Case B values. The poor fit of the Case B model predictions to the observed H i line fluxes means that the lines do not originate in the low-density H ii region responsible for the [O iii] emission (section 8).
In the limit that all lines are optically thick, the line flux ratios of a static slab of gas in local thermodynamic equilibrium (LTE) will be dominated by the wings of the line profile. Such a slab of gas will produce line fluxes , with the Planck function for an electron temperature , and the oscillator strength for the transition (Drake & Ulrich 1980). In Fig. 8 we also show these values for a range of electron temperatures between 1000 and 100,000 K. Again this simple model cannot reproduce the observed line flux ratios in BD+40∘4124, especially for Pf/Br and Br/Br. The most likely explanation for the poor fit is that the lines are more broadened than due to the Stark wings of the line profile, probably due to macroscopic motion of the gas.
The poor fit of both the Case B values and the optically thick static slab model shows that we are not looking at an optically thick static slab of gas, but at an optically thick ionized gas with a significant velocity dispersion. Most likely it originates either in an ionized wind, or in an ionized gaseous disk surrounding BD+40∘4124. Without information on the kinematics of the gas, the distinction between these two cases is hard to make. To qualitatively show that such a model can indeed reproduce the observations, we also show in Fig. 8 the best fit of a simple LTE model for a totally ionized wind following the treatment of Nisini et al. (1995). This best fit model has a rather high mass loss rate ( 10-6 M⊙ yr-1), arising from a compact region ( 12 R⋆) in radius. However, the assumption of LTE will cause this simple model to significantly overestimate the mass loss rate (Bouret & Catala 1998), whereas the assumption that the wind is completely ionized will cause an underestimate of the size of the line emitting region. Therefore the values given here should be approached as lower, respectively upper limits. Also, a model for an ionized gaseous disk surrounding BD+40∘4124 may give equally good fits to the data.
If the lower lines in the Pfund and Brackett series are optically thick, the region in which these lines originate should also produce optically thick free-free emission at radio wavelengths. In the simple wind model employed above, the Br line flux is related to the 6 cm continuum flux by the relation (mJy) = (W m-2) , with the wind velocity in units of 100 km s-1 (Simon et al. 1983). Assuming , this relation yields 0.39 mJy for BD+40∘4124, in excellent agreement with the observed 6 cm flux of 0.38 mJy (Skinner et al. 1993). Although highly simplified, this analysis does show that the region responsible for the H i line emission can also produce sufficient amounts of radio continuum emission to account for the observed fluxes and that our interpretation of the radio component in the SED as free-free emission (section 3) is correct.
7 Molecular hydrogen emission
At all three observed positions in the BD+40∘4124 region we detected emission from pure rotational lines of molecular hydrogen. They are listed in Table 1 and are shown in Figs. 2–4. For BD+40∘4124 and LkH 224, 0–0 S(0) to S(5) were detected. For LkH 225 pure rotational lines up to S(10) as well as several ro-vibrational lines were detected. It is clear that in LkH 225 the 0–0 S(6) line escaped detection because of its unfortunate location in the H2O gas phase absorption band (Fig. 7b). The line flux of the 0–0 S(5) line may also be slightly ( 10%) underestimated because of this. We have detected significantly more lines than the preliminary results reported in the A&A ISO First Results issue (Wesselius et al. 1996), both because of improvements in the SWS data reduction since 1996 and because additional data were obtained. Therefore a new analysis of these H2 lines is in place.
From the H2 line fluxes it is possible to calculate the apparent column densities of molecular hydrogen in the upper levels, averaged over the SWS beam, , using , with the wavelength, Planck’s constant and the speed of light. The transition probabilities were taken from Turner et al. (1977). Line fluxes were corrected for extinction using using the average interstellar extinction law by Fluks et al. (1994). For both BD+40∘4124 and LkH 224 we used = 30, valid for the optical stars. For LkH 225 we used the = 154 derived in section 4.

A useful representation of the H2 data is to plot the log of , the apparent column density in a given energy level divided by its statistical weight, versus the energy of the upper level. The statistical weight is the combination of the rotational and nuclear spin components. It is for para-H2 (odd ) and times the Ortho/Para ratio for ortho-H2 (even ). We have assumed the high temperature equilibrium relative abundances of 3:1 for the ortho and para forms of H2 (Burton et al. 1992). The resulting excitation diagrams are shown in Fig. 9. For LkH 225 we also included the measurements of the H2 ro-vibrational lines by Aspin et al. (1994). For the lines in common, their values differ somewhat with ours, although the line ratios agree. This is probably an effect of their smaller beam size and indicates that in our measurements the beam filling factor is smaller than one. In Fig. 9 the values of Aspin et al. were scaled to our measurements.
In case the population of the energy levels is thermal, all apparent column densities should lie on a nearly straight line in the excitation diagram. The slope of this line is inversely proportional to the excitation temperature, while the intercept is a measure of the total column density of warm gas. As can be seen from Fig. 9, this is indeed the case in all three stars for the pure rotational lines with an upper level energy up to 5000 K. The fact that the points for ortho and para H2 lie on the same line proves that our assumption on their relative abundances is correct. We have used the formula for the H2 column density for a Boltzmann distribution given by Parmar et al. (1991) to fit our data points in the low-lying pure rotational levels, using the rotational constants given by Dabrowski (1984), varying the excitation temperature and column density. The results are shown as the dashed lines in Fig. 9.
Van den Ancker et al. (1998b and in preparation) have employed predictions of H2 emission from PDR, J-shock and C-shock models (Burton et al. 1992; Hollenbach & McKee 1989; Kaufman & Neufeld 1996), to determine the excitation temperature from the low-lying pure rotational levels as a function of density and either incident FUV flux (in units of the average interstellar FUV field G0 = erg cm-2 s-1 sr-1; Habing 1968) or shock velocity in an identical way as was done for the observations presented here. They arrived at the conclusion that the PDR and J-shock models allow a fairly small (200–540 K) range of excitation temperatures, whereas for C-shocks this range is much larger (100–1500 K). In the model predictions for shocks, does not depend much on density, whereas for PDRs it does not depend much on . Once the mechanism of the H2 emission is established, it can therefore be used to constrain or in a straightforward way.
The values for measured for LkH 224 and LkH 225 fall outside the range of values predicted by either PDR or J-shock models. They are similar to the values found in other regions containing shocks (van den Ancker et al. 1998b). If the observed pure rotational H2 emission is indeed due to a planar C-shock, its shock velocity should be around 20 km s-1. In section 4 we saw that our BD+40∘4124 SWS full grating scan contains strong emission in the PAH bands. This indicates that a PDR is present at that location. If we assume that the observed H2 emission is entirely due to this PDR, the observed of 470 K points to a rather high () density within the PDR.
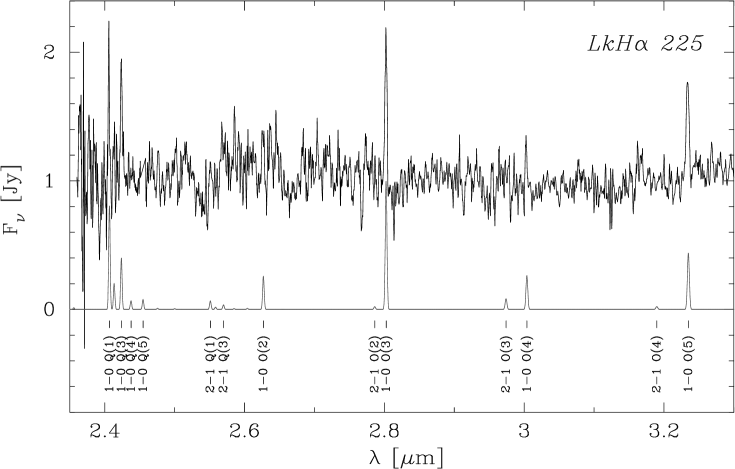
For LkH 225, ro-vibrational as well as pure rotational emission from H2 was detected (Fig. 10). Both the higher pure rotational lines and the ro-vibrational lines significantly deviate from the straight line defined by the lower pure rotational lines in the excitation diagram and do not form a smooth line by themselves, as expected in the case of multiple thermal components. Such a situation can either occur because of fluorescence of H2 in a strong UV field (Black & van Dishoeck 1987; Draine & Bertoldi 1996), be due to X-ray or EUV heating (Wolfire & Königl 1991; Tiné et al. 1997), or be due to the formation energy of re-formed H2 in post-shock gas (Shull & Hollenbach 1978). Although the H2 spectra resulting from the possible formation mechanisms do differ in the relative prominence of transitions with (Black & van Dishoeck 1987), the distinction between these situations is rather difficult to make with the detected lines in LkH 225.
By summing all the apparent column densities for the ro-vibrational and higher pure rotational lines we obtain an estimate for the observed total column of non-thermal H2 in LkH 225 of cm-2, corresponding to M⊙ or 0.3 earth masses within the SWS beam. This value of (H) is within the range predicted by UV fluorescence models. However, the absence of PAH emission in LkH 225 at the time of the ISO observations suggests that there was no strong UV radiation field at that time. Therefore we consider the possibility that the ro-vibrational H2 emission originates in a shock more likely.
Interestingly, in LkH 225 we have detected two pairs of lines arising from the same energy level: the 1–0 Q(1) & 1–0 O(3) and the 1–0 Q(3) & 1–0 O(5) lines. For these pairs of lines must be identical. Therefore they can be used to derive a differential extinction between the two wavelengths of the lines using . Using the interstellar extinction curve by Fluks et al. (1994), we can then convert the differential extinction to a value of . The results of this procedure are values for of and for the 1–0 Q(1) & 1–0 O(3) and 1–0 Q(3) & 1–0 O(5) line pairs, respectively. These extinction values are somewhat larger than the derived from the silicate feature in section 4. But they agree well with obtained from the C18O column density towards LkH 225 (Palla et al. 1995). If the slope of the infrared extinction law is approximately interstellar, the extinction towards the region producing the low-lying pure rotational H2 lines in LkH 225 must be smaller than this value though; such a large extinction would cause the extinction-corrected 0–0 S(3) line to deviate significantly from the thermal distribution line in the excitation diagram, since it is located within the 9.7 m silicate feature in the extinction curve. We conclude that in LkH 225 either there must be two distinct sources of H2 emission, a 710 K thermal component suffering little extinction – presumably a C-shock – and a heavily extincted, deeply embedded component – possibly a J-shock, or the slope of the infrared extinction law towards this region must be much steeper than interstellar.
8 Carbon-monoxide emission lines

At both the positions of BD+40∘4124 and LkH 225, several emission lines due to the = 0–0 transitions of gas-phase CO were detected in the long-wavelength part of the LWS spectra (Table 2). Similar to what was done for the H2 emission in the previous section, we constructed CO excitation diagrams, using molecular data from Kirby-Docken & Liu (1978). They are shown in Fig. 11. The temperature and column of CO resulting from the Boltzmann fit to these excitation diagrams are 500 K and cm-2 and 300 K and cm-2 for BD+40∘4124 and LkH 225, respectively. We estimate the errors in these fit parameters to be around 50 K in temperature and 50% in CO column.
The observed CO lines have critical densities of around 106 cm-3. Therefore the observation of these lines also implies densities of at least this order of magnitude in the originating region. The CO excitation temperature of 500 K found at the position of BD+40∘4124 is comparable to that found from the H2 lines. The CO/H2 mass fraction of 0.01 is compatible for what one would expect for the warm gas in a PDR. However, assuming that densities of around 106 cm-3 would exist in the entire BD+40∘4124 PDR would be implausible. We therefore conclude that if these CO lines and the H2 both originate in the large-scale environment of BD+40∘4124, the PDR must have a clumpy structure (e.g. Burton et al. 1990).
The CO emission arising from the neighbourhood of LkH 225 is remarkably different from that seen in H2: here the excitation temperature of the CO is much lower than that found in H2. The CO/H2 mass fraction of 0.03 is also much higher than that found at the position of BD+40∘4124. It seems likely that another component than the C-shock responsible for the H2 emission needs to be invoked to explain the low CO excitation temperature. Again this region must have densities of around 106 cm-3. A possible disk or extended envelope around LkH 225 could have both the temperature and densities required to explain the observed CO spectrum.
9 Atomic fine structure lines
In order to interpret our observations as arising in either a PDR, C-Shock or J-shock, we compare our results with theoretical models of such regions (Tielens & Hollenbach 1985; Hollenbach & McKee 1989; Kaufman & Neufeld 1996). Important constraints come from the observed fine structure lines. The mere presence of certain lines helps us to identify the mechanism responsible for the observed emission. In contrast to both C- and J-shocks, PDRs do not produce significant quantities of [S i] emission (Tielens & Hollenbach 1985). C-shocks only contain trace fractions of ions and hence cannot explain the [Fe ii], [Si ii] or [C ii] emission.
| Object | PDR | C-shock | J-shock | ||||||||
|---|---|---|---|---|---|---|---|---|---|---|---|
| [cm-3] | [G0] | [10-8 sr] | [cm-3] | [km s-1] | [10-8 sr] | [cm-3] | [km s-1] | [10-8 sr] | |||
| BD+40∘4124 | 104/106 | 104/105 | 0.55/0.05 | – | – | – | – | – | – | ||
| LkH 224 | – | – | – | 105 | 20 | 0.10 | – | – | – | ||
| LkH 225 | – | – | – | 105 | 20 | 0.20 | 104–105 | 60 | 0.12 | ||
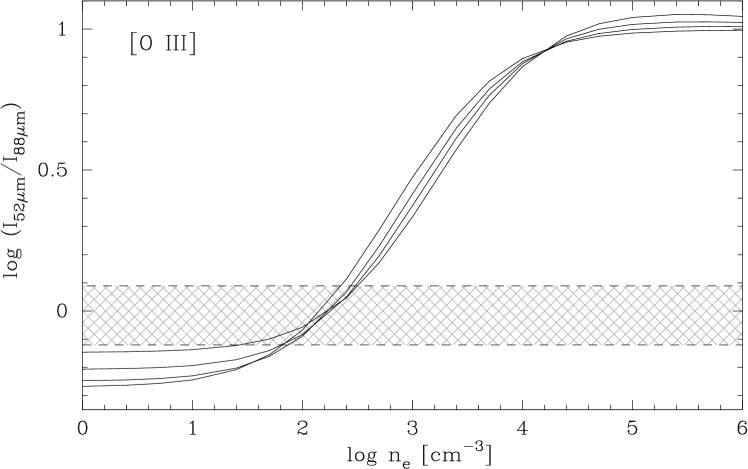
In BD+40∘4124 the H2 lines and the presence of PAH emission strongly suggest the presence of a PDR. No [S i] was detected, so no shock is required to explain the emission from this region. The [Fe ii] and [Si ii] emission observed at the position of BD+40∘4124 may also originate in a PDR. The [O iii] emission lines detected by SWS cannot be produced in a PDR. The ratio of the [O iii] 52 and 88 m lines is sensitive to the electron density in the line forming region. It hardly depends on the temperature. We computed the expected ratio for a range of temperatures and densities, in the approximation that we can treat [O iii] as a five level ion following the treatment by Aller (1984), using collisional strengths from Aggarwal et al. (1982). The results are shown in Fig. 12. We conclude that the [O iii] lines observed by LWS are formed in a H ii region with = 0.6–2.2 cm-3. In view of the 22,000 K effective temperature of BD+40∘4124, it is surprising that [O iii] emission is detected, since simple photo-ionization models predict that for stars with 32,000 K most oxygen should remain neutral. Clearly another ionization model must be present here. Possibly the region also responsible for the H i lines could collisionally ionize the oxygen and we are observing the outer, low-density part of an ionized wind.
Apart from the PDR, a H ii region surrounding BD+40∘4124 may also contribute significantly to the observed [Fe ii] and [Si ii] emission. Therefore we have used the photo-ionization code cloudy (version 90.04; Ferland 1996) to generate model predictions for line strengths for an H ii region surrounding BD+40∘4124. A Kurucz (1991) model with parameters appropriate for BD+40∘4124 was taken as the input spectrum, and a spherical geometry and a constant electron density of 2 cm-3 throughout the H ii region were assumed. According to this model, 30% of the observed [Si ii] 34.82 m flux and 40% of the 25.99 m [Fe ii] flux will originate in the H ii region. From comparing the remainder of the fluxes of the atomic fine structure lines to the PDR models of Tielens & Hollenbach (1985), we derive that the PDR should be fairly dense ( 104 cm-3) and have an incident far-UV field of about 104 G0. The extent of this PDR should be around 180 square arcseconds, or about half of the SWS beam.
In view of the observed H2 spectrum (section 7), a C-shock appears the most likely candidate for explaining the observed [S i] emission in LkH 224. A C-shock with a shock velocity of around 20 km s-1 can explain both the H2 and [S i] emission. However, the density and extent of the region are poorly constrained: the emission may either arise in a dense ( 106 cm-3) region of only a few square arcseconds, or arise in a region of about 103–104 cm-3 with a high beam filling factor. Since it is observed in the largest SWS aperture, the observed [Si ii] emission could be due to contamination from LkH 225 (see Fig. 5).
For LkH 225 the situation appears more complicated. The detection of [S i] clearly shows that a shock must be present in the region. A C-shock can explain the observed thermal H2 component, with similar parameters as for LkH 224, but can only explain part of the [S i] emission. The [Fe ii] and [Si ii] emission could either come from a deeply embedded H ii region, a deeply embedded PDR, or a J-shock. In view of the necessity to have an additional source of [S i] emission, the most likely candidate might be a J-shock. A J-shock model with 60 km s-1 and 104–105 cm-3 can indeed reproduce the observed [S i] and [Si ii] intensities. However, to reproduce the observed [Fe ii] 26.0 m strength, iron would have to be about eight times more depleted than assumed in the Tielens & Hollenbach PDR models. The observed [C ii] 157.7 m emission at the position of LkH 225 cannot be explained by shocks. This could very well be due to contamination by the BD+40∘4124 PDR or the galactic [C ii] background, however.
Fit parameters for the PDR, J-shock and C-shock models used to explain the H2, CO and fine structure emission lines are listed in Table 3. The summed model predictions for the line fluxes are listed in Table 2.
10 Discussion and conclusions
In the previous sections we have seen that in a small OB association like the BD+40∘4124 group, different phenomena contribute to at first glance similar line spectra. The emission at the position of BD+40∘4124 is well reproduced by the combination of a H ii region around BD+40∘4124 with a PDR. In Section 7 we derived values of the far-UV radiation field for its PDR from the observed emission lines. It is useful to compare those values to those expected from the central star to see whether that is a sufficient source of radiation, or another exciting source needs to be invoked. From the Kurucz (1991) model with = 22,000 K and , fitted to the extinction-corrected UV to optical SED of BD+40∘4124 (section 3), we compute that BD+40∘4124 has a total far-UV (6–13.6 eV) luminosity of L⊙. At a location AU from the central star, this field will have diluted to the value of G0 obtained from the infrared lines. At the BD+40∘4124 distance of 1 kpc, this corresponds to an angular separation of 5″, consistent with the constraints imposed by the SWS aperture. We conclude that BD+40∘4124 can indeed be responsible for the incident UV flux upon the PDR observed in that vicinity. Compared to the far-UV luminosity of BD+40∘4124, the other two sources only show little UV emission (3 and 6 L⊙ for LkH 224 and 225, respectively), explaining why we don’t observe a PDR at those positions.
| Object | gas-phase column | solid column | gas/solid ratio | Ref. | |||||||||
|---|---|---|---|---|---|---|---|---|---|---|---|---|---|
| CO | CO2 | H2O | CO | CO2 | H2O | CO | CO2 | H2O | |||||
| LkH 225 | 1019–1021 | 1–5 1017 | 0.5–3 1019 | 6 1017 | 3 1016 | 7.8 1017 | 16 | 3 | 13 | (1) | |||
| T Tau | 1018–1019 | 1 1017 | 1 1018 | 5 1017 | 1.4 1017 | 5.4 1017 | 20 | 0.7 | 1.9 | (2) | |||
| AFGL 4176 | 2 1019 | 5 1015 | 2 1018 | 5 1016 | 1.2 1017 | 9 1017 | 400 | 0.04 | 2.2 | (3,4,5,6) | |||
| W33A | – | 40 | – | 0.04 | (3,7,8,9) | ||||||||
| AFGL 2136 | 1.0 1019 | 1 1016 | 2 1018 | 1.8 1017 | 6.1 1017 | 5.0 1018 | 50 | 0.02 | 0.4 | (3,4,5,6) | |||
| RAFGL 7009S | 6.1 1018 | 1.0 1017 | 2 1018 | 1.8 1018 | 2.5 1018 | 1.1 1019 | 3.4 | 0.04 | 0.18 | (10) | |||
| Elias 29 | – | 55 | – | 0.3 | (9) | ||||||||
| AFGL 2591 | 1.1 1019 | 1 1016 | 2 1018 | 4 1016 | 2.7 1017 | 1.7 1018 | 270 | 0.04 | 1.1 | (3,4,5,6) | |||
| NGC 7538 IRS9 | 1.4 1019 | 8.0 1015 | 3 1017 | 1.0 1018 | 1.2 1018 | 8.0 1018 | 14 | 0.01 | 0.04 | (3,4,5,6) | |||
References: (1) This paper; (2) van den Ancker et al. (1999); (2) Mitchell et al. (1990); (3) van Dishoeck et al. (1996); (4) de Graauw et al. (1996b); (5) van Dishoeck & Helmich (1996); (6) Chiar et al. (1998); (7) Gerakines et al. (1999); (8) Boogert (1999); (9) Dartois et al. (1998).
For LkH 224 we showed that the infrared emission-line spectrum could be explained by a single non-dissociative shock. A C-shock with very similar parameters may also be present at the position of LkH 225. Comparing our ISO SWS aperture positions (Fig. 5) with the image of the bipolar outflow centered on LkH 225 (Palla et al. 1995), we note that this outflow covers both LkH 224 and LkH 225. One possible identification for the C-shock in both LkH 224 and LkH 225 might therefore be the shock created as the outflow originating from LkH 225 drives into the surrounding molecular cloud.
Apart from the large-scale C-shock, we have seen that probably a J-shock is present in LkH 225 as well. This can be naturally identified with the Herbig-Haro knot LkH 225-M observed in [S ii] in the optical (Magakyan & Movseyan 1997). It remains unclear whether the ro-vibrational H2 lines observed in this object are due to H2 fluorescence by Ly photons or to H2 re-formation in the post-shock gas. Spectroscopy of lines with higher is required to clarify this.
In the line of sight toward LkH 225, a large column consisting of warm gas-phase CO, CO2 and H2O and solid water ice and silicates was detected. The column of gas-phase water was found to be about 10 times higher that that of water ice. No CO2 ice was detected toward LkH 225, demonstrating that the bulk of the CO2 is in the gas-phase. In Table 4 we compare the derived gas/solid ratio for LkH 225 with those found in the lines of sight towards other young stellar objects. Both the H2O and CO2 gas/solid ratios are much higher than those found in other YSOs. For CO2, the lower limit to the gas/solid is even a factor 100 higher than that found in the source with the previously reported highest ratio! At this point we can only speculate as to why this is the case. One possible explanation could be that the radiation field of BD+40∘4124 is heating the outer layers of the LkH 225 envelope, evaporating the CO2 ice. If this is the case, BD+40∘4124 should be located closer to the observer than LkH 225, suggesting that LkH 225 is located at the far side of the “blister” in which the BD+40∘4124 group is located. Another explanation could be that the LkH 225 core itself is unusually warm. Since the abundance of gas-phase water is sensitive to the temperature (Charnley 1997), this would also explain the high abundance of water vapour in the line of sight toward LkH 225. Because LkH 225 is less massive than the luminous objects in which the previous gas/solid ratios have been determined, this high temperature might reflect a more evolved nature of the LkH 225 core. Future research, such as a temperature determination from gas-phase CO measurements, should be able to distinguish between these possibilities and show whether we have discovered the chemically most evolved hot core known to date, or are looking through a line of sight particularly contaminated by a nearby OB star.
Acknowledgements.
The authors would like to thank Ewine van Dishoeck for her help in obtaining the BD+40∘4124 LWS data and Dolf de Winter for making his optical spectra of LkH 224 available to us. We thank Adwin Boogert and Issei Yamamura for helpful discussions on the molecular absorption spectra. Lynne Hillenbrand kindly provided the K′-band image of the region shown in Fig. 5. An anonymous referee provided useful suggestions for improvements of the paper. MvdA acknowledges financial support from NWO grant 614.41.003 and through a NWO Pionier grant to L.B.F.M. Waters. This research has made use of the Simbad data base, operated at CDS, Strasbourg, France.References
- (1) Aggarwal, K.M., Baluja, K.L., Tully, J.A. 1982, MNRAS 201, 923
- (2) Allen, D.A. 1973, MNRAS 161, 145
- (3) Aller, L.H. 1984, “Physics of Thermal Gaseous Nebulae”, Dordrecht, Reidel
- (4) Aspin, C., Sandell, G., Weintraub, D.A. 1994, A&A 282, L25
- (5) Beintema, D.A., van den Ancker, M.E., Molster, F.J. et al. 1996, A&A 315, L369
- (6) Bertout, C., Thum, C. 1982, A&A 107, 368
- (7) Black, F.H., van Dishoeck. E.F. 1987, ApJ 322, 412
- (8) Boogert, A.C.A. 1999, PhD thesis, Groningen University
- (9) Boogert, A.C.A., Ehrenfreund, P., Gerakines, P. et al. 1999, A&A, in press
- (10) Bouret, J.C., Catala, C. 1998, A&A 340, 163
- (11) Brooke, T.Y., Tokunaga, A.T., Strom, S.E. 1993, AJ 106, 656
- (12) Burton, M.G., Hollenbach, D.J., Tielens, A.G.G.M. 1990, ApJ 365, 620
- (13) Burton, M.G., Hollenbach, D.J., Tielens, A.G.G.M. 1992, ApJ 399, 563
- (14) Charnley, S.B. 1997, ApJ 481, 396
- (15) Chiar, J.E., Gerakines, P.A., Whittet, D.C.B. et al. 1998, ApJ 498, 716
- (16) Cohen, M. 1972, ApJ 173, L61
- (17) Cohen, M., Bieging, J.H., Schwartz, P.R. 1982, ApJ 253, 707
- (18) Corcoran, M., Ray, T.P. 1996, A&A 321, 189
- (19) Corcoran, M., Ray, T.P. 1998, A&A 331, 147
- (20) Dabrowski, I. 1984, Canadian J. Phys. 62, 1639
- (21) Dartois, E., d’Hendecourt, L., Boulanger, F., Jourdain de Muizon, M., Breitfellner, M., Puget, J.L., Habing, H.J. 1998, A&A 331, 651
- (22) de Graauw, Th., Haser, L.N., Beintema, D.A. et al. 1996a, A&A 315, L49
- (23) de Graauw, Th., Whittet, D.C.B., Gerakines, P.A. et al. 1996b, A&A 315, L345
- (24) Deutsch, L.K., Iyengar, M.A., Hora, J.L., Hoffmann, W.F., Dayal, A., Butner, H.M., Fazio, G.G. 1994, AAS 185, 8416
- (25) Di Francesco, J., Evans, N.J., Harvey, P.M., Mundy, L.G., Guilloteau, S., Chandler, C.J. 1997, ApJ 482, 433
- (26) Draine, B.T., Bertoldi, F. 1996, ApJ 468, 269
- (27) Drake, S.A., Ulrich, R.K. 1980, ApJS 42, 351
- (28) Ferland, G.J. 1996, Univ. of Kentucky Physics Department Internal Report
- (29) Finkenzeller, U. 1985, A&A 151, 340
- (30) Fluks, M.A., Plez, B., Thé, P.S., de Winter, D., Westerlund, B.E., Steenman, H.C. 1994, A&AS 105, 311
- (31) Gerakines, P.A., Schutte, W.A., Greenberg, J.M., van Dishoeck, E.F. 1995, A&A 296, 810
- (32) Gerakines, P.A., Whittet, D.C.B., Ehrenfreund, P. et al. 1999, ApJ 522, 357
- (33) Habing, H.J. 1968, Bull. Astron. Inst. Netherlands 19, 421
- (34) Hamann, F., Persson, S.E. 1992, ApJS 82, 285
- (35) Harvey, P.M. 1984, PASP 96, 297
- (36) Helmich, F.P., van Dishoeck, E.F., Black, J.H. et al. 1996, A&A 315, L173
- (37) Henning, T., Burkert, A., Launhardt, R., Leinert, C., Stecklum, B. 1998, A&A 336, 565
- (38) Herbig, G.H. 1960, ApJS 4, 337
- (39) Hillenbrand, L.A., Strom, S.E., Vrba, F.J., Keene, J. 1992, ApJ 397, 613
- (40) Hillenbrand, L.A., Meyer, M.R., Strom, S.E., Skrutskie, M.F. 1995, AJ 109, 280
- (41) Hollenbach, D.J., McKee, C.F. 1989, ApJ 342, 306
- (42) Kaufman, M.J., Neufeld, D.A. 1996, ApJ 456, 611
- (43) Kessler, M.F., Steinz, J.A., Anderegg, M.E. et al. 1996, A&A 315, L27
- (44) Kirby-Docken, K., Liu, B. 1978, ApJS 36, 359
- (45) Kurucz, R.L. 1991, in “Stellar atmospheres–Beyond classical models” (eds. A.G. Davis Philip, A.R. Upgren, K.A. Janes), L. Davis press, Schenectady, New York, p. 441
- (46) Leech, K. et al. 1997, “SWS Instrument Data Users Manual”, Issue 3.1, SAI/95-221/Dc
- (47) Lorenzetti, D., Saraceno, P., Strafella, F. 1983, ApJ 264, 554
- (48) Magakyan, T.Y., Movsesyan, T.A. 1997, Pis’ma Astron. Zh. 23, 764 (Astron. Lett. 23, 666)
- (49) Menzel, D.H., Baker, J.G. 1938, ApJ 88, 52
- (50) Merrill, P.W., Humason, M.L., Burwell, C.G. 1932, ApJ 76, 156
- (51) Mitchell, G.F., Maillard, J.P., Allen, M., Beer, R., Belcourt, K. 1990, ApJ 363, 554
- (52) Nisini, B., Milillo, A., Saraceno, P., Vitali, F. 1997, A&A 302, 169
- (53) Olnon, F.M., Raimond, E. & IRAS Science Team 1986, A&AS 65, 607
- (54) Oudmaijer, R.D., Busfield, G., Drew, J.E. 1997, MNRAS 291, 797
- (55) Palla, F., Stahler, S.W. 1993, ApJ 418, 414
- (56) Palla, F., Testi, L., Hunter, T.R., Taylor, G.B., Prusti, T., Felli, M., Natta, A., Stanga, R.M. 1995, A&A 293, 521
- (57) Parmar, P.S., Lacy, J.H., Achtermann, J.M. 1991, ApJ 372, L25
- (58) Rodgers, B., Wooden, D.H. 1997, AAS 191, 4709
- (59) Rothmann, L.S., Gamache, R.R., Tipping, R.H. et al. 1996, J. Quant. Spectr. Radiat. Transfer 48, 469
- (60) Schmidt-Kaler, Th. 1982, in “Landolt Börnstein Catalogue”, Vol VI/2b
- (61) Shevchenko, V.S., Ibragimov, M.A., Chernysheva, T.L. 1991, Astron. Zh. 68, 466 (SvA 35, 229)
- (62) Shevchenko, V.S., Grankin, K.N., Ibragimov, M.A., Melnikov, S.Y., Yakubov, S.D. 1993, Ap&SS 202, 121
- (63) Shull, J.M., Hollenbach, D.J. 1978, ApJ 220, 525
- (64) Simon, M., Felli, M., Cassar, L., Fischer, J., Massi, M. 1983, ApJ 266, 623
- (65) Skinner, S.L., Brown, A., Stewart, R.T. 1993, ApJS 87, 217
- (66) Spitzer, L. 1978, “Physical Processes in the Interstellar Medium”, Wiley Interscience, New York
- (67) Storey, P.J., Hummer, D.G. 1995, MNRAS 272, 41
- (68) Strom, K.M., Strom, S.E., Breger, M., Brooke, A.L., Yost, J., Grasdalen, G., Carrasco, L. 1972a, ApJ 173, L65
- (69) Strom, S.E., Strom, K.M., Yost, J., Carrasco, L., Grasdalen, G. 1972b, ApJ 173, 353
- (70) Swings, J.P. 1981, A&AS 43, 331
- (71) Terranegra, L., Chavarría, C., Diaz, S., Gonzalez-Patino, D. 1994, A&AS 104, 557
- (72) Tielens, A.G.G.M., Allamandola, L.J. 1987, in “Interstellar Processes”, eds. D.J. Hollenbach & H.A. Thronson Jr. (Dordrecht: Reidel), p. 397
- (73) Tielens, A.G.G.M., Hollenbach, D.J. 1985, ApJ 291, 722
- (74) Tiné, S., Lepp, S., Gredel, R., Dalgarno, A. 1997, ApJ 481, 282
- (75) Trams, N. et al. 1997, “ISO-LWS Instrument Data Users Manual”, Issue 5.0, SAI/95-219/Dc
- (76) Turner, J., Kirby-Docken, K., Dalgarno, A. 1977, ApJS 35, 281
- (77) van den Ancker, M.E., de Winter, D., Tjin A Djie, H.R.E. 1998a, A&A 330, 145
- (78) van den Ancker, M.E., Wesselius, P.R., Tielens, A.G.G.M., Waters, L.B.F.M. 1998b, in “ISO’s View on Stellar Evolution”, eds. L.B.F.M. Waters et al., Ap&SS 255, 69
- (79) van den Ancker, M.E. 1999, PhD thesis, University of Amsterdam
- (80) van den Ancker, M.E., Wesselius, P.R., Tielens, A.G.G.M., van Dishoeck, E.F., Spinoglio, L. 1999, A&A 348, 877
- (81) van Dishoeck, E.F., Helmich, F.P. 1996, A&A 315, L177
- (82) van Dishoeck, E.F., Helmich, F.P., de Graauw, Th. et al. 1996, A&A 315, L349
- (83) Weaver, W.B., Jones, G. 1992, ApJS 78, 239
- (84) Wenzel, W. 1980, Mitt. Ver. Sterne 8, 182
- (85) Wesselius, P.R., van den Ancker, M.E., Young, E.T. et al. 1996, A&A 315, L197
- (86) Wesselius, P.R., van Duinen, R.J., de Jonge, A.R.W., Aalders, J.W.G., Luinge, W., Wildeman, K.J. 1982, A&AS 49, 427
- (87) Whittet, D.C.B., Schutte, W.A., Tielens, A.G.G.M. et al. 1996, A&A 315, L357
- (88) Wolfire, M.G., Königl, A. 1991, ApJ 383, 205