Extended Gas in Seyfert Galaxies: Near-Infrared Observations of 15 Active Nuclei
Abstract
Results from an analysis of low resolution (R250) near-IR long-slit spectra covering simultaneously the I, J, H, and K bands, for a sample of 15 Seyfert galaxies and the NGC 5253 starburst nucleus, are presented. The Seyfert galaxies were selected as presenting ‘linear’ or cone-like high excitation emission line in the optical, most probably due to the collimation of the central source’s radiation by a dusty molecular torus. Our goal was to look for signatures of this torus, and to investigate the gaseous distribution, excitation and reddening. The strongest emission lines detected are usually He i 1.083m and [S iii] 9532, followed by Pa. In some cases, [Fe ii] 1.26m and 1.64m are also seen. [Fe ii] 1.26m and H2 =10 S(1) are detected in some of the higher resolution spectra obtained for five galaxies. The emission lines are spatially extended in most cases, and we have used the [Fe ii]/Pa ratio as a measure of the gaseous excitation in Mrk 573, NGC 1386, and NGC 7582. Values for this ratio between 1.5 and 6 are found, suggesting excitation of [Fe ii] by X-rays or shock waves in some regions. Broad permitted lines are observed in three Seyfert 1 galaxies. Nuclear Pa in NGC 1365, and possibly nuclear Br in Mrk 573, are also broad.
From analysis of the spatial distribution of the continuum and colours derived from our spectra, we find redder colours for the nucleus than the nearby bulge in most of the Seyfert 2s observed. Comparison with models including emission from dust and stars shows that hot (T 1000 K) dust emission dominates the nuclear continuum in NGC 1365, NGC 2110, NGC 3281, NGC 7582, and ESO362-G18. In NGC 1386, NGC 5643, and NGC 5728 the main contributor is the underlying stellar population, combined with some foreground reddening and/or cooler dust emission. In a few cases, the colours on opposite sides of the nucleus differ by 0.3 – 0.8 mag, an effect that we interpret as partly due to differences in the local stellar population, and possibly extinction gradients.
keywords:
1 Introduction
In the unified model for active galactic nuclei (AGN) the nuclear engine is surrounded by an optically thick, dusty toroidal structure, which collimates the escaping photons and, at the same time, hides the true nucleus from our line of sight (Antonucci 1993). Observational evidence for such a model come from optical spectropolarimetry, which reveals that a number of Seyferts 2s show broad emission lines and blue continuum in polarized light (Miller & Goodrich 1990; Tran 1995), and emission-line imaging, which shows elongated morphologies for the extended emission line regions, with striking conical or bi-conical structures that can be traced down to a few tens of parsecs from the nucleus and which are generally aligned with the radio ejecta (Pogge 1989; Storchi-Bergmann & Bonatto 1991; Wilson & Tsvetanov 1994).
There are few observational constraints on the geometry of the torus, although red features and dust lanes (e.g., Wilson et al. 1993; Simpson et al. 1996b) aligned perpendicular to the radio/extended line emission axis are seen in some high resolution images. Hot dust (T 1200 K) has been found to be an important contributor to the near-infrared nuclear continuum of Seyfert galaxies (Glass & Moorwood 1985; Kotilainen et al. 1992; Alonso-Herrero et al. 1998). Theoretical models (Krolik & Begelman 1988) show that for the dust to reach this temperature, the inner edges of the torus must be only a few parsecs from the nuclear source. The total extent of the torus, however, is not well constrained, and may reach several tens or even a hundred parsecs. Warm dust (T 600 – 800 K) is presumably responsible for the observed mid-infrared flux (Pier & Krolik 1993).
Infrared spectroscopy of a number of Seyfert 2 galaxies has revealed broad components in the hydrogen emission-lines (e.g., Veilleux, Goodrich & Hill 1997 and references therein), thus confirming, at least in those particular cases, the presence of an obscured broad-line region. The torus is expected to contain warm molecular hydrogen, whose vibration-rotational transitions, especially H2 =10 S(1), could be used as a tracer of the size and geometry of the toroidal structure (Blietz et al. 1994; Moorwood et al. 1996; Marco, Alloin & Beuzit 1997). On the other hand, while the H2 emission is expected to be extended perpendicular to the collimation/radio emission axis, emission lines from ionized gas (such as [Fe ii] 1.26m) should be emitted preferentially along the collimation axis, either due to photoionization by the hard photons from the central source or by shocks from the interaction of the radio jet with the ambient gas.
To address these issues, we obtained long-slit spectra in the near-infrared I, J, H, and K bands of a sample of Seyfert galaxies with known elongated or bi-conical high-excitation optical emission, which, in the unified model, is a direct result of the presence of the collimating torus. We also observed NGC 5253, a classical H ii galaxy. Our first results, on NGC 2110 and the Circinus galaxy, have already been published (Storchi-Bergmann et al. 1999, hereafter Paper I), and in this paper we present the data for the remaining galaxies observed.
2 Data Reduction
Long-slit spectra of the sample galaxies were obtained using the Infrared Spectrograph (IRS) on the 4m ‘Blanco’ telescope of the Cerro Tololo Interamerican Observatory in October-November, 1995 and February-March, 1996. The detector used was a 256256 InSb device, with a 0363 per pixel scale. The useful slit length was about 15″, and the slit width was either 1″ or 17, depending on the seeing, which was generally between these two values. The majority of the spectra were obtained using a low-resolution (R250), cross-dispersed grating (hereafter, the XD grating), which splits the complete 0.9 – 2.3 m spectra into four or five segments, roughly coincident with the R, I, J, H, and K spectral bands. A few galaxies were also observed using either a 75 lines per mm grating, with resolution R700 (4 pixels), hereafter the LR grating, or a 210 lines per mm grating, R2000, hereafter the HR grating.
The log of observations is listed in Table 1. We observed most of the galaxies with the slit aligned along the position angle (PA) of the major axis of the inner isophotes in narrow-band ([O iii]) images or along the radio axis (identified by an ‘r’ in Column 3). In a few cases, spectra were also obtained along the perpendicular direction (‘p’) or, for the Seyfert 1 objects, along arbitrary PAs. For NGC 5253 the slit was positioned along the major axis of the H emission structure in the inner 25″. Futher details of the individual spectra are given in Section 3. To obtain the linear spatial scales in Table 1, we adopted H∘ = 75 km s-1 Mpc-1.
| Object | Date | P.A. | Grating/Band | Exp. Time | Slit width | Spatial scale |
|---|---|---|---|---|---|---|
| (°) | (sec) | (″) | (pc/″) | |||
| NGC 526A | 1995 Oct 30 | 123 | XD | 1100 | 1.1 | 373 |
| NGC 1097 | 1995 Oct 31 | 77 | LR J | 1200 | 1.1 | 82 |
| NGC 1365 | 1995 Oct 30 | 130 | XD | 600 | 1.1 | 106 |
| 1995 Oct 31 | 145 | LR J | 2400 | 1.1 | ||
| NGC 1386 | 1996 Feb 28 | 0 | XD | 800 | 1.1 | 56 |
| NGC 2110 | 1996 Feb 28 | 350 (r) | XD | 800 | 1.1 | 148 |
| NGC 3281 | 1996 Feb 28 | 45 | XD | 800 | 1.1 | 224 |
| NGC 4388 a | 1996 Feb 27 | 13 | XD | 1200 | 1.1 | 78 |
| 1996 Feb 27 | 90 (p) | XD | 800 | 1.1 | ||
| 1996 Feb 29 | 13 | HR J | 2200 | 1.7 | ||
| 1996 Feb 29 | 90 (p) | HR J | 2200 | 1.7 | ||
| NGC 5253 | 1996 Feb 28 | 43 | XD | 400 | 1.1 | 26 |
| NGC 5643 | 1996 Feb 28 | 90 | XD | 800 | 1.1 | 78 |
| NGC 5728 | 1996 Feb 28 | 20 (p) | XD | 400 | 1.1 | 180 |
| 1996 Feb 28 | 110 | XD | 800 | 1.1 | ||
| NGC 7582 | 1995 Oct 30 | 203 | XD | 900 | 1.1 | 102 |
| IC 5063 b | 1995 Nov 01 | 90 | LR K | 2520 | 1.1 | 220 |
| ESO 362-G18 | 1995 Oct 30 | 68 (p) | XD | 900 | 1.1 | 245 |
| Fairall 9 | 1995 Oct 30 | 123 | XD | 600 | 1.1 | 911 |
| Mrk 509 | 1995 Oct 30 | 0 | XD | 600 | 1.1 | 667 |
| Mrk 573 | 1995 Oct 31 | 125 (r) | LR J | 3000 | 1.1 | 335 |
| 1995 Nov 01 | 35 (p) | LR K | 3240 | 1.1 |
a Bad seeing ( 25) for the HR spectra at PA=13°.
b Clouds.
Both XD and LR/HR data were reduced using IRAF 111IRAF is distributed by the National Optical Astronomy Observatories, which are operated by the Association of Universities for Research in Astronomy, Inc., under cooperative agreement with the National Science Foundation. scripts kindly provided by R. Elston at CTIO (available at the CTIO ftp archive), and followed standard procedures. The reduction of the LR and HR data has already been described in Paper I. The only difference here is that, after bias subtraction, flatfielding, and sky subtraction, removal of the atmospheric absorption features and flux calibration were performed on the full frame, instead of on the extracted spectra.
For the XD data, the fundamental difference from the standard IR data reduction is the tracing of the distortion across the slit (the wavelength direction). This was done using the spectrum of a bright star or pinhole, which was traced in each ‘band’ with a 4th order Legendre polynomial in the aptrace task. Similarly, the flat-fields were created using apnormalize rather than response, and then the individual segments of each image (corresponding approximately to the five colour bands) were flat-fielded, and ‘straightened’ using the solution previously found with the tracing star/pinhole spectrum. Wavelength calibration was performed using an HeAr lamp, with different solutions for each ‘band’. Low (2 – 4) order Legendre polynomials were fitted to a sample of 4 (K) to 12 (R) lines, resulting in the spectral intervals, pixel scales, and rms residuals of the fits listed in Table 2. Atmospheric absorption correction and flux calibration followed the same procedures as for the LR/HR data.
| Run | Band | Range | Pixel | rms |
|---|---|---|---|---|
| (m) | (Å) | (Å) | ||
| 1995 Oct 30 | I | 0.802 – 1.195 | 16 | 2 |
| J | 0.961 – 1.435 | 19 | 7 | |
| H | 1.199 – 1.792 | 23 | 10 | |
| K | 1.601 – 2.364 | 30 | 32 | |
| 1996 Feb 27 | I | 0.865 – 1.260 | 16 | 3 |
| J | 1.038 – 1.513 | 19 | 3 | |
| H | 1.296 – 1.890 | 24 | 7 | |
| K | 1.602 – 2.691 | 43 | 66 | |
| 1996 Feb 28 | R | 0.772 – 0.999 | 13 | 26 |
| I | 0.851 – 1.226 | 16 | 2 | |
| J | 0.972 – 1.447 | 19 | 5 | |
| H | 1.213 – 1.806 | 24 | 4 | |
| K | 1.616 – 2.404 | 31 | 16 |
3 Results
The integrated spectra of the sample galaxies, corresponding to the co-added emission within a 7 – 8″ spatial window are shown in Figures 1a to 1e for the XD data. For the LR/HR data, the extraction windows were as listed on Table 4 and the resulting integrated spectra are shown in Figures 6a and 6b. Inside the atmospheric absorption bands, the XD data was masked out when the signal was below 10 percent of the peak transmission in the uncalibrated frames. The main emission lines are indicated, and total line fluxes are listed in Tables 3 and 4. In the XD sub-sample, the strongest lines are the He iPa blend and [S iii] 9532 emission. The uncertainties in the integrated fluxes are dominated by the continuum placement, and we estimate them to be of the order 20 – 25% for the XD spectra, and 10 – 20% for the LR/HR data.
Table 5 lists the full width at half maximum (FWHM), corrected for instrumental resolution, of the lines observed at different positions for the four objects with HR/LR spectra. The errors are due to the uncertainty in the placement of the continuum and represent maximum values. Due to its higher S/N ratio, the emission lines in a spectrum of the planetary nebula NGC 7009 were used as the reference (instrumental) profile for the LR grating. These values were found to be in very good agreement with the FWHM of the sky lines. For the HR grating the instrumental profile was given by the HeAr calibration lamp lines.


(b) NGC 2110, NGC 1386, and NGC 3281

(c) NGC 4388 (PA=13° and 90°), and NGC 5643
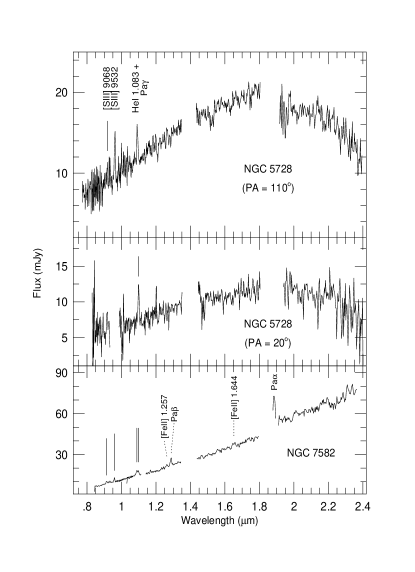
(d) NGC 5728 (PA=110° and 20°), and NGC 7582

(e) ESO 362-G18, Mrk 509, and Fairall 9
| Object | Line ID | Flux |
|---|---|---|
| NGC 526A | [S iii] 9532 | 3.9 |
| He iPa | 11.7 | |
| Pa | 11.5 | |
| NGC 1365 | [S iii] 9532 | 11.5 |
| Pa | 3.1 | |
| He i 1.083 | 26.6 | |
| Pa | 14.7 | |
| Pa | 20.2 | |
| NGC 1386 | [S iii] 9068 | 6.5 |
| [S iii] 9532 | 16.1 | |
| He iPa | 6.6 | |
| [Fe ii] 1.26 | 5.3 | |
| Pa | 3.5 | |
| NGC 2110 | [S iii] 9068 | 4.9 |
| [S iii] 9532 | 11.8 | |
| He iPa | 10.1 | |
| [Fe ii] 1.26 | 7.0 | |
| Pa | 3.4 | |
| [Fe ii] 1.64 | 6.2 | |
| NGC 3281 | [S iii] 9068 | 7.6 |
| [S iii] 9532 | 24.1 | |
| He iPa | 7.9 | |
| NGC 4388 | [S iii] 9532 | 8.4 |
| (PA=13) | He iPa | 5.7 |
| NGC 4388 | [S iii] 9532 | 23.1 |
| (PA=90) | He iPa | 11.8 |
| Pa | 5.6 | |
| NGC 5253 | [S iii] 9068 | 33.6 |
| [S iii] 9532 | 94.3 | |
| Pa | 8.7 | |
| He i 1.083 | 64.8 | |
| Pa | 13.2 | |
| Pa | 31.1 | |
| Pa | 121.7 | |
| Br | 9.1 | |
| NGC 5643 | [S iii] 9068 | 8.7 |
| [S iii] 9532 | 23.3 | |
| He iPa | 17.3 | |
| Pa | 3.5 | |
| NGC 5728 | [S iii] 9532 | 14.4 |
| (PA=110) | He iPa | 9.2 |
| NGC 5728 | [S iii] 9532 | 11.9 |
| (PA=20) | He iPa | 10.2 |
| NGC 7582 | [S iii] 9532 | 5.7 |
| He iPa | 14.7 | |
| [Fe ii] 1.26 | 2.1 | |
| Pa | 7.8 | |
| [Fe ii] 1.64 | 5.0 | |
| ESO 362-G18 | He iPa | 35.0 |
| Pa | 10.1 | |
| Pa | 10.7 | |
| Fairall 9 | [S iii] 9532 | 9.0 |
| He iiPa | 7.7 | |
| He iPa | 51.5 | |
| Pa | 15.3 | |
| Pa | 18.1 | |
| Mrk 509 | [S iii] 9532 | 13.3 |
| He iiPa | 21.9 | |
| He iPa | 108.0 | |
| Pa | 33.0 | |
| Pa | 59.1 |

(b) IC 5063 – LR/K, Mrk 573 – LR/J (PA = 125°), and Mrk 573 – LR/K (PA = 35°)
| Object | Window (″) | Line ID | Flux |
|---|---|---|---|
| NGC 1365 | 10.96 | Pa(broad) | 20.8 |
| Pa(total) | 41.3 | ||
| NGC 4388 | 3.65 | [S ix] | 2.2 |
| (PA=13) | [Fe ii] 1.26 | 6.7 | |
| Pa | 10.0 | ||
| NGC 4388 | 4.38 | [Fe ii] 1.26 | 8.9 |
| (PA=90) | Pa | 12.2 | |
| IC 5063 | 5.12 | H2 S(1) | 0.55 |
| Br | 0.45 | ||
| Mrk 573 | 8.05 | [S ix] | 0.89 |
| (PA=125) | [Fe ii] 1.26 | 1.89 | |
| Pa | 2.03 | ||
| Mrk 573 | 5.12 | H2 S(1) | 0.14 |
| (PA=35) | Br | 0.37 |
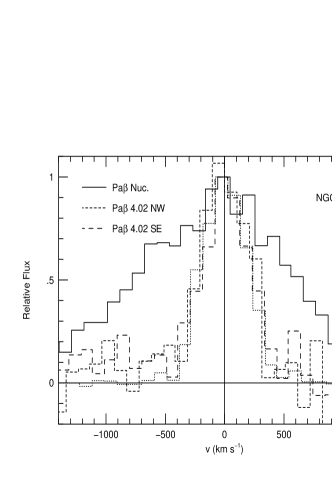
The two entries for Pa in NGC 1365 correspond to the fluxes in the broad component only (FWHM 1500 km s-1; see Table 5) and in all the emission line, respectively.
3.1 Extended Emission and Line ratios
Due to the low spectral resolution of the XD spectra, we opted to extract the emission line spatial distributions directly from the two-dimensional frames, rather than extracting a number of spectra along the slit and measuring the individual line fluxes as done in Paper I. The spatial profiles were obtained by extracting and co-adding all columns inside a spectral window wide enough to contain all the line emission, and the underlying continuum subtracted by linear interpolation between two windows at each side of the emission line. The errors were estimated by creating an image with the same ratio of the rms to the total raw counts () in each pixel on the uncalibrated frames, then processing those images with the same procedure as used for the actual data.
With the exception of NGC 5253, where the geometric centre of the slit was arbitrarily set as the origin of the spatial axis, the centroid of a nearby continuum spatial profile was used as the origin of the emission line spatial distributions. No correction for foreground (Galactic) reddening was applied.
In most XD spectra, the emission lines with enough S/N ratio to allow the construction of meaningful spatial profiles were [S iii] 9532, the He iPa blend and Pa. The available emission lines allowed the determination of the internal reddening only in the H ii galaxy NGC 5253, where we found average reddening corrected values of 3.1 and 4.7 for (He iPa)/Pa, and [S iii] 9532/Pa ratios, respectively. For the other galaxies, a good determination of the narrow emission line reddening could not be obtained, and any comparison among the resulting line ratios should be considered with caution. Some regularity was observed between the Seyfert 1 galaxies, which presented integrated line ratios (He iPa)/Pa 3.4, and [S iii] 9532/Pa 0.4. For the Seyfert 2 nuclei, these same ratios span the ranges 1.0 (He iPa)/Pa 4.9 and 0.6 [S iii] 9532/Pa 6.7.
We now describe the spatial distribution of the emission lines for each galaxy, comparing the light profiles in the emission lines with that of a reference star, and also the spatial variations in the available line ratios. For reasons of clarity in the figures, the emission line spatial profiles shown below have been rebbined to 074 per pixel.
| Object | Position(″) | Line | FWHM |
| NGC 1365 | Nuc | Pa (N) | 450 |
| Pa (B) | 1397 | ||
| Pa (VB) | 2868 | ||
| 4.02 NW | Pa | 159 | |
| 4.02 SE | Pa | 210 | |
| IC 5063 | Nuc | Br | 400 |
| H2 S(1) | 400 | ||
| 1.46 NW | Br | 400 | |
| H2 (S1) | 483 | ||
| Mrk 573 J | Nuc | [S ix] | 450 |
| [Fe ii] 1.26m | 323 | ||
| Pa | 450 | ||
| Mrk 573 J | 1.46 NW | [Fe ii] 1.26m | 450 |
| Pa | 182 | ||
| 1.46 SE | [Fe ii] 1.26m | 450 | |
| Pa | 323 | ||
| 3.29 NW | Pa | 450 | |
| 3.29 SE | Pa | 450 | |
| Mrk 573 K | Nuc | Br | 589 |
| H2 S(1) | 400 | ||
| NGC 7009 | (instrumental, LR) | Pa | 455 |
| Br | 403 | ||
| NGC 4388 | Nuc | [Fe ii] 1.26m | 297 |
| (PA=13) | Pa | 299 | |
| NGC 4388 | Nuc | Pa | 378 |
| (PA=90) | 1.46 W | Pa | 171 |
| HeAr | (instrumental, HR) | 148 1 |
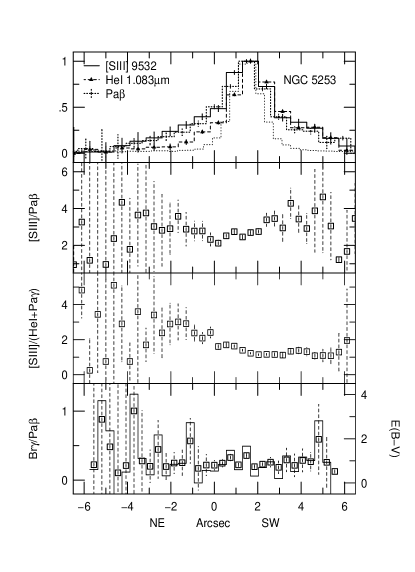
NGC 5253: The spectrum of this H ii galaxy (Figure 1a, top panel) was obtained along the PA of the major axis of the H emission structure seen in Fig. 1a of Calzetti et al. (1997), with essentially no stellar continuum detected. The strong emission lines (Fig. 8) extend over 10″ and peak at the central clump, corresponding to the starburst nucleus. To investigate their variation with distance from the nucleus, we constructed several line ratios. The [S iii] 9532/(He iPa) ratio varies from 1.2 at 3″ SW to 2.8 at 3″ NE, while the [S iii] 9532/Pa is almost flat in the above interval, 2.780.96, rising slightly to the SW. The average reddening in the region 3″ 45, calculated from the Br/Pa ratio, assuming a case B intrinsic value of 0.171 (Osterbrock 1989), is 0.910.15. However, large variations (as much as 3 mag in ) are found within a few pixels, in agreement with the work of Calzetti et al (1997), which detected a much higher reddening inside the emission clumps than indicated by the emission line ratios in the integrated optical spectrum. The (He iPa)/Pa ratio, which can be interpreted as a tracer of the ionization structure, varies from 2 in the extended regions to up to 5.4 in the starburst nucleus. Assuming a case B recombination, and AV = 3 – 6 mag, the contribution of Pa to the blend varies between 0.45 to 0.36 the Pa flux. For the above range of reddening, the observed line ratios translate to 2.6 He i 1.083m/Pa 3.5, 1.9 [S iii] 9532/He i 1.083m 2.2 (both ratios corrected for the Pa contribution), 4.7 [S iii] 9532/Pa 7.8. The upper limits are consistent with H ii regions models (Lumsden & Puxley 1996).
NGC 526A: The XD spectrum (Fig. 1a, middle) was obtained along the PA of the major axis of the [O iii] emission (Mulchaey, Wilson & Tsvetanov 1996), and presents a steep continuum with faint emission lines. We detected the He iPa blend, Pa, and a feature at 1.96m which we tentatively identify as [Si vi] 1.962m. The lines are only barely spatially resolved (Fig. 9), with Pa presenting some low surface brightness emission up to 4″ SE. The (He iPa)/Pa ratio in the inner 4″ ( 2″) is 1.310.13.
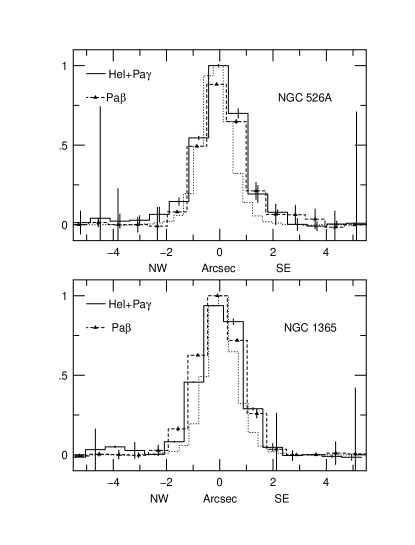
NGC 1365: The XD spectrum (Fig. 1a, bottom), obtained along the axis of the ionization cone at PA = 130°, shows a red continuum, with prominent permitted lines (He iiPa, He iPa, Pa); Pa is detected above the atmospheric absorption. The emission (Fig. 9) is resolved and similarly extended symmetrically from the nucleus in all lines, with the exception of a feature in He iPa at 4″ NW (the ‘anti-cone’ direction) which can be associated with an optical hot-spot in the circumnuclear star-forming ring (Storchi-Bergmann & Bonatto 1991; Kristen et al. 1997).The line ratios (He iPa)/Pa and (He iiPa)/(He iPa) are essentially constant in the inner 4″, with values 2.270.12 and 0.190.02, respectively.
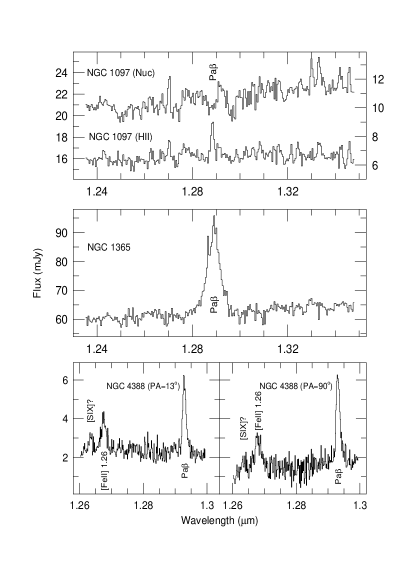
This galaxy was also observed with the LR grating in the J band. The spectrum (Fig. 6a, middle) shows very clearly the presence of a broad component in the nuclear Pa profile (Fig. 10). The FWHM of the nuclear and extranuclear profiles, obtained using multiple Gaussian component decomposition, is listed in Table 5 for this and the other galaxies observed with the LR and HR gratings. At 4″ NW and SE, Pa is barely resolved spectrally (see Table 5).
The nuclear Pa profile can be described as the sum of a narrow (N), broad (B) and very broad (VB) Gaussian components, with FWHM from 400 km s-1 to 2900 km s-1. Véron et al. (1980) measured a flux of 7.7 ergs cm-2 s-1 in their broad (FWHM 1300 km s-1) component of H. Associating this emission system with the FWHM 1500 km s-1 component of Pa observed here, we obtain a broad line region reddening of AV 7.7 mag for an intrinsic Pa/H ratio of 0.053. Since the broad lines of this galaxy are known to be variable (Giannuzzo & Stirpe 1996), not to mention calibration differences, this value is to be regarded as only a first order approximation to the actual broad-line region reddening.
Recently, Stevens, Forbes & Norris (1999) suggested that the optical broad lines in the nucleus of NGC 1365 could originate not at the Seyfert nucleus, but at one of the circumnuclear radio ‘hot spots’ (Morganti et al. 1999), located at 5″ SW of the optical nucleus, as a result of a radio-supernova located there. However, we find this highly unlikely, since our spectrum, which was obtained with a 1″ slit, centred in the optical nucleus, and oriented at almost right angles with the PA of the hot spot in question, would not have included any of its emission.
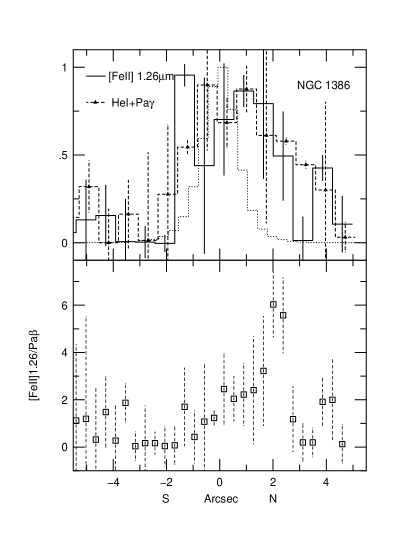
NGC 1386: The XD spectrum (Fig. 1b, middle) was obtained along the direction of the high excitation optical emission line protrusion detected in the images of Storchi-Bergmann et al. (1996). The brightest line is [S iii] 9532, with fainter He iPa, [Fe ii] 1.26m, and Pa. Although noisy, the resulting spatial profiles are definitely extended along the [O iii] emission direction (Fig. 11). The He iPa distribution is the most extended, reaching at least 45 N of the nucleus, the end of the slit. The (He iPa)/Pa ratio is 2.91.0 in the inner 4″. The [S iii] 9532 and [Fe ii] 1.26m spatial profiles are resolved but more concentrated, extending only up to 25. In the inner 4″, the [S iii] 9532/(He iPa) ratio is essentially flat, with a value of 2.210.21 , while [Fe ii] 1.26m/Pa increases from 0.9 at r = 2″ S to 6 at 2″ N, with a value of 2 in the nucleus, indicating a higher excitation of the gas to the N, in agreement with the optical images.
Several mechanisms for the origin of [Fe ii] emission in Seyferts have been extensively discussed in previous works (Forbes & Ward 1993; Simpson et al. 1996a; Alonso-Herrero et al. 1997; Veilleux et al. 1997). In starbursts, if the mechanism generating the [Fe ii] emission is directly related to the one producing the radio emission in (radio) brigth supernova remnants, Colina (1993) calculated that [Fe ii] 1.26/Pa 0.4 is expected. The higher ratios observed in Seyferts would then indicate ionization by X-rays from the active nuclei or by shocks induced by the interaction of an outflow with the surrounding medium. However, if the lifetime of the [Fe ii] emission phase in single or multiple star formation bursts is longer than in Colina’s models, the [Fe ii]/Pa ratio can reach higher values (Vanzi, Alonso-Herrero & Rieke 1998), as the contribution from the remnants becomes dominant over the gas ionization from the aging H ii regions.
Detailed stellar population analysis of NGC 1386 (Schmitt, Storchi-Bergmann & Cid Fernandes 1999) does not indicate the presence of a significant contribution from a young (10 Myr or less) component in the inner 2″ 2″, and therefore the [Fe ii]/Pa values indicate that, as is also found in NGC 2110 (Paper 1), a starburst related component of the [Fe ii] emission is not important in this case. Since this object was not observed with the higher resolution gratings, we do not have any information on the [Fe ii] line profile, but the line broadening in H and [N ii] 6584 within 15 N of the nucleus detected by Weaver, Wilson & Baldwin (1991) raises the possibility of shocks as an ionization source for the infrared [Fe ii] lines. Nagar et al. (1999) find the nuclear radio source to be extended by 04 in PA = 170°, a similar direction to the extension of the optical emission lines.
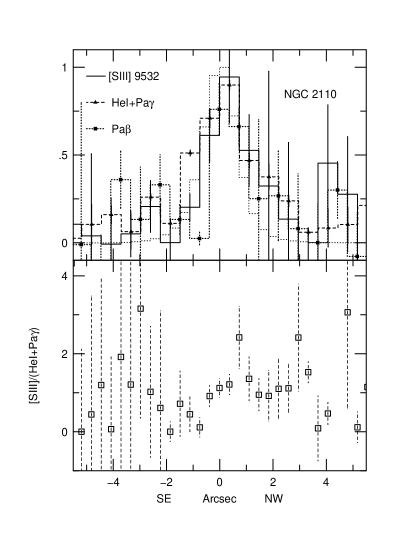
NGC 2110: The HR/LR data for this galaxy were presented and analysed in Paper I, and we found evidence of shocks and X-rays as dominant sources of excitation for the [Fe ii] and H2 emission in the inner few arcsec, respectively. The XD spectrum shown in Figure 1b (top panel) was obtained along the PA of the radio axis, with [S iii] 9068, [S iii] 9532, He iPa, [Fe ii] 1.26m, Pa, and [Fe ii] 1.64m detected. The spatial profiles of [S iii] 9532, He iPa and Pa are clearly asymmetric (Figure 12), being extended up to 3″ towards the NW, the direction of the high excitation optical emission. The [S iii] and Pa spatial profiles decline more quickly to the SE than the He iPa profile, consistent with the isophotes in the H[N ii] image of Mulchaey et al. (1996). The [Fe ii] spatial distribution (already discussed in Paper I) is similar to that of [S iii] 9532. The [S iii] 9532/(He iPa) line ratio rises from 0.44 at 2″ SE to 1.0 at 2″ NW. A similar excitation gradient is seen in the [O iii] 5007/H ratio (Wilson, Baldwin & Ulvestad 1985). The H2 emission, clearly seen in the higher resolution spectra of Paper I, was not detected here because of the low resolution of the XD spectra.
NGC 3281: The XD spectrum is shown in Figure 1b (bottom panel). It shows only faint [S iii], He i, and Pa emission. The resulting spatial profiles were of too low S/N ratio to allow any useful analysis of the extended emission.
NGC 4388: Two sets of data were obtained for this object. The XD spectra (Fig. 1c, top and middle panels) were taken approximately along and perpendicular to the axis of the optical ionization cone, at PA=13° and 90°, respectively. The S/N is low, with only [S iii] 9532 and He iPa detected. The spatial profiles at PA = 13° (Fig. 13) are noisy, but more extended towards the NE, the anti-cone direction. The narrow-band H[N ii] optical images of Veilleux et al. (1999) show an elongated structure in the inner 10″, which also appears to be more extended to the NE direction (while the cone-like, kpc-scale high excitation gas distribution is oriented towards the south). Along PA=90° our emission line distributions are also resolved, but essentially symmetric with respect to the centre. The line ratios are almost constant in the inner 4″, with [S iii] 9532/(He iPa) = 1.580.84 (PA=13°) and 1.230.74 (PA=90°). In this latter spectrum, we also measured [S iii] 9532/Pa 4.300.50 for this same region.
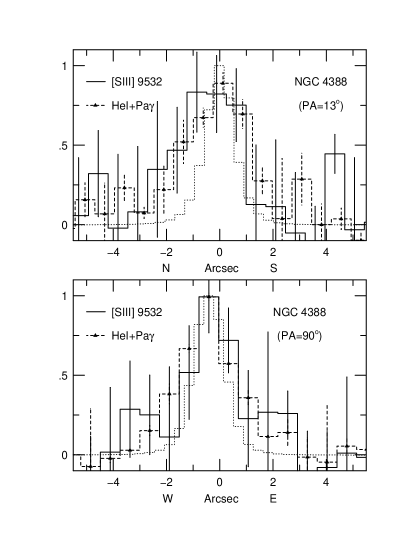
Two HR spectra in the J band were obtained at the same position angles as above (Figure 6a, bottom). The emission-lines spatial profiles are only marginally resolved at both PAs, with [Fe ii] 1.26m/Pa 0.7. Along the cone direction, we clearly detect [S ix] 1.262m.
For the PA = 90° spectrum, the IRS imaging mode was used to find the position of the nucleus in the K band, which was found to be located 1″ N of the optical position. The slit was thus centred offset by this amount from the optical nucleus. However, the continuum is a factor of two lower than that of the PA = 13° spectrum, and the [S ix] line is not as clearly detected, suggesting that the true K-band nucleus was missed. The spatial offset between the optical and infrared nuclei in NGC 4388 has been previously noted by Stone, Wilson & Ward (1988), who found that the 10 m emission peaks ’several arcsec’ north of the optical nucleus, rising the possibility of the mid-infrared source to be associated with the radio ejecta, rather than with the nucleus proper.
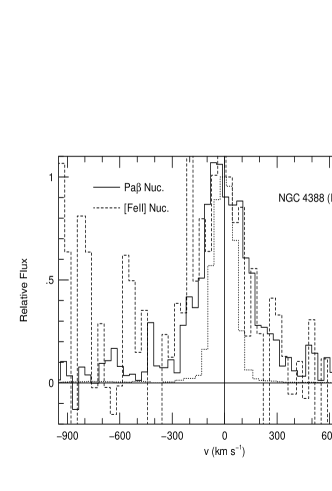
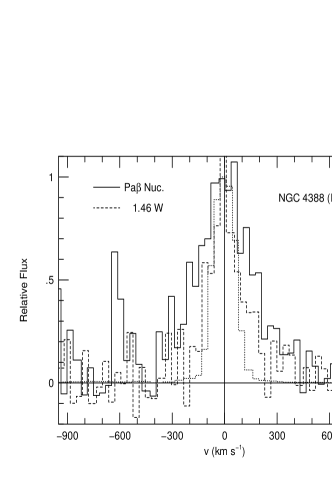
The nuclear line profiles of Pa and [Fe ii] 1.26m from the PA=13° spectrum are spectrally resolved, and very similar to each other (Fig. 14). Correcting the observed widths in Table 5 by the instrumental broadening (adopted as the FWHM of Pa in NGC 7009) gives an intrinsic FWHM of 300 km s-1 for both lines. Along the perpendicular direction (PA = 90°), the nuclear Pa profile is resolved and marginally broader than at PA=13°, with a corrected FWHM of 378 km s-1. At 15 W of the nucleus the line is essentially unresolved (Fig. 15).
NGC 5643: The XD spectrum (Fig. 1c, bottom) was obtained along the axis of the optical ionization cone, and shows [S iii], He i 1.083m, Pa, and the tip of the Pa emission line. Only the Pa profile is marginally resolved spatially in the central regions, but both this line and [S iii] 9532 show a second emission feature 3″ E of the nucleus, which may be associated with the filamentary extended emission seen in optical images (Schmitt, Storchi-Bergmann & Baldwin 1994; Simpson et al. 1997). In the central 2″, we measured [S iii] 9532/(He iPa), [S iii] 9532/Pa, and (He iPa)/Pa ratios of 1.340.62, 6.981.03, and 5.180.71, respectively.
NGC 5728: Two spectra (Fig. 1d) were obtained with the XD grating, at PA = 110°, the optical ionization cone direction, and perpendicular to it (PA = 20°). The S/N ratio is low, and only [S iii] 9532, and He iPa are detected. The spatial profiles, shown in Figure 16, are resolved along both directions, although more extended at PA = 110° as expected from the optical images of Wilson et al. (1993). However, while He iPa is almost symmetric, the [S iii] 9532 emission is stronger to the NW, the opposite direction of the optical cone. The [S iii] 9532/(He iPa) ratio in the inner 4″ is 2.190.85 along the cone, and 1.630.94 perpendicular to it.

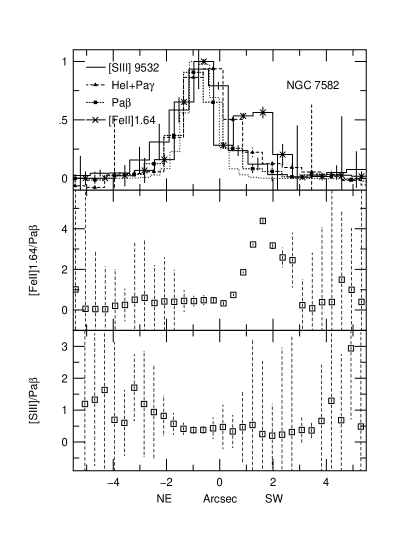
NGC 7582: This galaxy was observed with the slit at PA = 203°, which is within the optical ionization cone which has axis in PA 250°) (Storchi-Bergmann & Bonatto 1991). The peaks of the emission line spatial profiles (Fig. 17, top panel), are offset from the peak of the nearby continua by 07 – 08 to the NE, the opposite direction to the ionization cone. All emission lines, with the possible exception of Pa are extended towards the cone. The [Fe ii] 1.64m emission presents a double peaked structure, with an unresolved core plus a secondary bump reaching 25 SW. The [S iii] 9532 profile is marginally extended to the NE. The double-peaked structure of the [Fe ii] 1.64m emission is evident in the line-ratio distribution: to the NE, the [Fe ii] 1.64m/Pa ratio (Fig. 17, middle) is essentially constant at 0.450.08, reflecting the similar light distribution of the two lines; to the SW, the ratio increases sharply to 4.4 at 16, and then falls back to 0.3 at 25.
In the absence of significant reddening, and taking the intrinsic ratio between the [Fe ii] 1.64m and 1.26m lines as 0.75, these values translate to a [Fe ii] 1.26m/Pa ratio between 0.6 and 6, similar to those found above for NGC 1386 or in Paper I for the extended high excitation gas in NGC 2110. Note that contrary to what was observed for NGC 2110, where the nuclear [Fe ii]/Pa ratio was quite high ( 7), the nucleus of NGC 7582 presents a much lower ratio than the extended emission, with only a small excess over the expected ratio for young starbursts. Towards the cone, however, the tenfold increase in the [Fe ii]/Pa ratio suggests the presence of an additional source of ionization, either excitation by X-ray photons from the active nucleus, escaping preferably towards the cone (due to shadowing by the torus) or the interaction of the radio plasma with the ambient medium. The recent radio maps of Morganti et al. (1999) show that the 3.5 cm emission is indeed extended and spatially coincident with the inner regions of the extended H and [O iii] emission (Storchi-Bergmann & Bonatto 1991).
If there is significant intervening reddening (AV 13 mag from the [Fe ii] 1.64 m/1.26 m integrated line ratio from Table 3; or AV 8 mag from the continuum colours, see Section 3.2), the above observed values would translate to an intrinsic ratio [Fe ii] 1.26m/Pa 1 in the cone region, still requiring an additional source of ionization other than young starbursts. A corresponding increase towards the SW is not observed in the [S iii] 9532/Pa ratio (Fig. 17, bottom), where we measured values of 0.610.29 ( 3″ NE) and 0.340.13 ( 3″ SW).
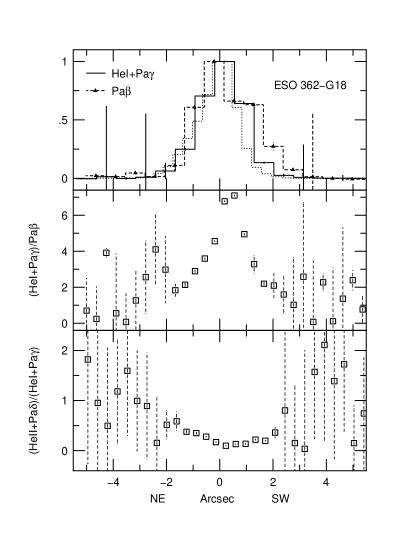
ESO 362-G18: Our XD spectrum of this Seyfert 1 galaxy (Fig. 1e, top) was obtained along PA = 68°, which is perpendicular to the direction of the axis of the approximately cone-shaped high-excitation gas emission region (Mulchaey et al. 1996). The spectrum presents bright broad lines including He iiPa, He iPa, Pa, and Pa, which is located close to the atmospheric absorption between the H and K bands and the flux must be regarded as a lower limit. The permitted lines spatial profiles (Fig. 18) are extended towards the SW, which can be identified with the emission structure seen in the optical H[N ii] images of Mulchaey et al. (1996). The distribution of the (He iPa)/Pa line ratio is approximately symmetric, with a maximum of 7.2 about 05 SW of the continuum peak, and decreasing to 1.5 at 3″ both sides. The behaviour of the (He iiPa)/(He iPa) ratio is quite different, with an essentially constant value of 0.29 0.16 in the 2″ region.
Mrk 509: This is a Sy 1 galaxy suggested by Phillips et al. (1983) as presenting a face-on outflow. The XD spectrum in Figure 1e (middle) was obtained along the N–S direction. The spatial profiles (Fig. 19, top) are slightly resolved, and more extended towards the South, with the exception of the [S iii] 9532 line, which also shows extended emission up to 3″ N of the nucleus. The line ratios in the inner 4 – 5″ are dominated by the nuclear source, with [S iii] 9532/Pa= 0.420.13, [S iii] 9532/(He iPa) = 0.100.03, (He iPa)/Pa = 3.500.52, and (He iiPa)/(He iPa) = 0.190.01.
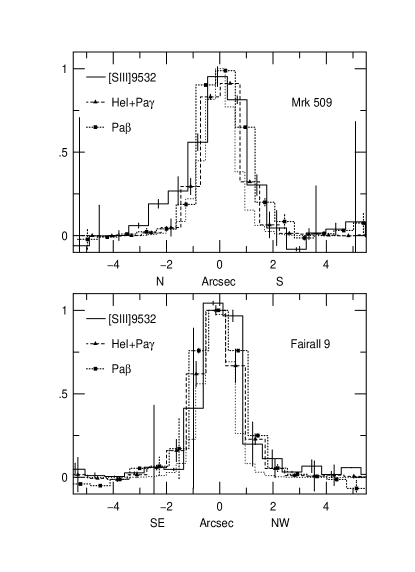
Fairall 9: The XD spectrum of this classical Sy1 nucleus is very similar to that of Mrk 509 (Fig. 1e). The brightest line is also He iPa and the spatial profiles (Fig. 19, bottom) are essentially unresolved, with [S iii] 9532/Pa, [S iii] 9532/(He iPa), (He iPa)/Pa, and (He iiPa)/(He iPa) in the inner 4 – 5″ of 0.500.08, 0.100.03, 3.300.33, and 0.160.01, respectively.
NGC 1097: We obtained a LR spectrum in the J-band of this LINER nucleus in order to determine if the broad double-peaked profile observed in H (Storchi-Bergmann, Baldwin & Wilson 1993) was also present in Pa. The long-slit spectrum, however, shows Pa emission only from an H ii in the circumnuclear star-forming ring, 87 SW of the nucleus (Fig. 6a, top panel). This is a clear case of a very low luminosity, rather than dust obscured active nucleus.
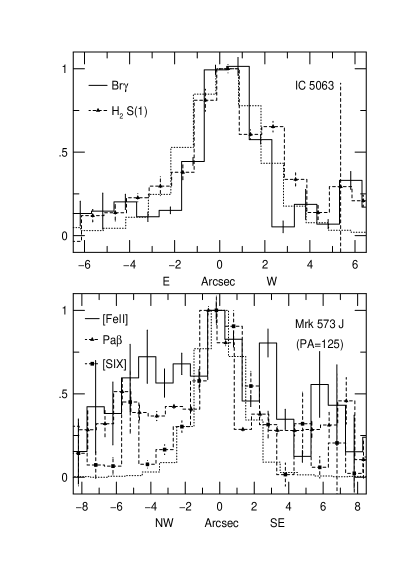
IC 5063: Only a LR K-band spectrum (Fig. 6b, top) was obtained, under non-photometric conditions. The orientation of the slit was PA = 90°, which is close to that of the radio/optical/infrared structures in the inner few arcsec (Simpson, Ward & Kotilainen 1994; Morganti, Oosterloo & Tsvetanov 1998; Kulkarni et al. 1998), and both Br and H2 =10 S(1) lines were detected.
The Br spatial distribution is unresolved, while the H2 line appears to be only slightly resolved (Fig. 20, top). The H2/Br ratio can be used to discriminate between the possible excitation mechanisms for H2 emission: in star-forming regions, where the main heating agent is the UV photons, H2/Br 1.0 is expected, while additional H2 emission excited by shocks or by X-rays from the active nucleus increases the observed values to up to 3 or more in Seyferts (Fischer et al. 1987; Moorwood & Oliva 1990; Kawara, Nishida & Gregory 1990; Veilleux et al. 1997). In our spectrum, we measured H2/Br = 1.220.20 in the inner 5″, which constitutes marginal evidence of a contribution from the active nucleus.The luminosity in the H2 line can be used to estimate the mass of hot molecular hydrogen in the nuclear region. If the hot H2 molecules are thermalized at T=2000 K, and assuming that the emission in all H2 lines is 10 times that in the S(1) line (Scoville et al. 1982, Veilleux et al. 1997), the observed H2 =10 S(1) luminosity of L(H2) = 1.35 ergs s-1 translates into a hot H2 mass of about 450 .
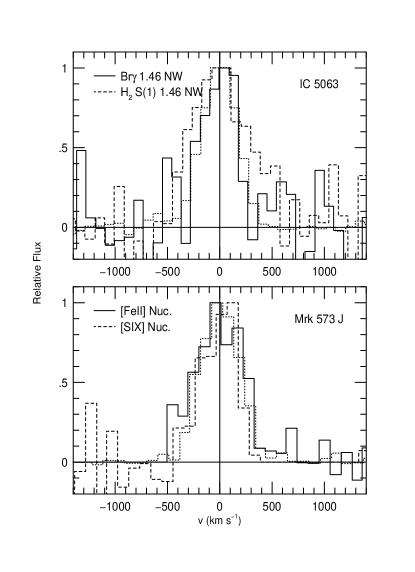
The spectral profiles of the H2 and Br lines are unresolved, except for the H2 emission in the 15 NW spectrum (Fig. 21, top), which has an observed FWHM of 630 km s-1, corresponding to a intrinsic width of 484 100 km s-1.
Mrk 573: Two LR spectra were obtained for this galaxy. The J-band spectrum (Fig. 6b, middle) was taken along the radio continuum and optical emission-line axis at PA = 125°(Pogge & de Robertis 1995; Falcke, Wilson & Simpson 1998), and presents [S ix], [Fe ii] 1.26m, and Pa emission. Individual spectra, extracted in 073 increments (Fig. 22), as well as the spatial profiles (Fig. 20, bottom) clearly show that the [S ix] distribution is unresolved, while Pa and [Fe ii] 1.26m are extended. The [Fe ii] 1.26m spatial profile presents a weak central peak with a flat extension towards the NW, reaching up to 8″, while the SE side is less prominent, but equally extended. On the other hand, the Pa distribution is characterized by a well-defined, spatially unresolved, central core, and extended emission of almost equal intensity on both sides of the nucleus. The [Fe ii] 1.26m/Pa ratio has a mean value of 0.770.14 in the inner 5″.

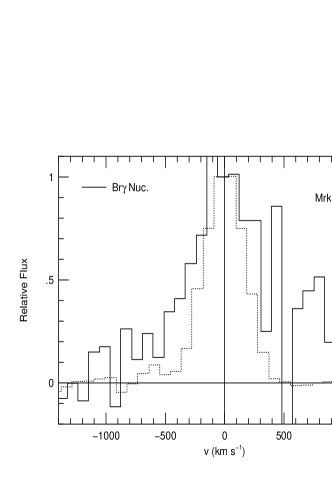
A K band LR spectrum of Mrk 573 (Fig. 6b, bottom) was obtained at PA = 35°, perpendicular to the direction of the radio jet. Br, possibly broad, and narrow H2 =10 S(1) were detected. Extracted spectra, in increments of 073, are shown in Figure 23.
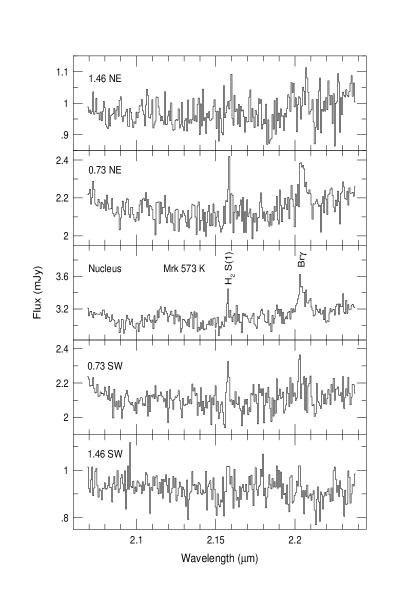
In the J band spectra, along PA = 125°, the spectral profile of Pa is unresolved up to 33 NW and SE. The [S ix] line, detected only in the nuclear spectrum, is also unresolved, while [Fe ii] 1.26m is marginally resolved spectrally in the nucleus but not outside (Fig. 21, bottom panel). In the K band, the H2 nuclear spectral profile is too noisy to yield any information, while Br is clearly resolved (Fig. 24), with an intrinsic width of 590 km s-1, and some suggestion of a broad component (FWZI 1900 km s-1), which contains about 70 percent of the total flux in the line, and is not observed in Pa (FWZI 1100 km s-1). Taking the upper limit for the flux of a similar broad component in Pa as 5 ergs cm-2 s-1 (calculated from the rms of the continuum around Pa, and a FWHM of 1300 km s-1 obtained from Gaussian decomposition of the Br profile), we have Br/Pa 0.6, implying a reddening of AV 9 mag in our line of sight to the broad line region in this galaxy.
Except for the presence of the broad base in Br, our results are in good agreement with those of Veilleux et al. (1997), which also found that Pa and H2 =10 S(1) were narrower than [Fe ii] 1.26m or Br, with this last line presenting an intrinsic width of 550 km s-1. Taking the narrow component of Br as containing about one third of the observed line flux, the H2/Br ratio is 1.2, and would indicate some marginal evidence of H2 excitation by X-rays from the active nucleus. Using the same assumptions as for IC 5063 the observed luminosity of H2 =10 S(1) in the inner 3″ translates into a mass of hot H2 of 300 .
3.2 Continuum
In this section, we present and analyse and colour profiles derived from our XD spectra. Previous studies of the central (less than 1 kpc) region of Seyfert galaxies have shown that their near-IR colours are well explained either by a mixture of an evolved stellar population plus emission from hot (800 – 1200 K) dust, with varying foreground reddening (Alonso-Herrero, Ward & Kotilainen 1996, hereafter AH96), or by a model more closely associated to the dusty torus scenario, in which the starlight is not significantly reddened, while the nuclear continuum source is represented by hot dust (T 1200 K) reddened by AV 5 – 30 mag (Alonso-Herrero et al. 1998, hereafter AH98). The off-nuclear colours show little evidence of hot dust emission, except for a few cases where the effect is attributed to the presence of massive stars acting as heating sources.
To obtain the colour profiles, the calibrated spectra were rebinned to 0.8 arcsec/pixel, then multiplied by the transmission curve of the corresponding filter, obtained from the CTIO web site 222We have used the curves of the filters in use with the CIRIM camera – j40, h44, k50, for J, H, and K, respectively, integrated along the wavelength direction and converted from flux to magnitudes. With an average seeing of 1 – 15, each profile is sampled by 1 – 2 pixels.
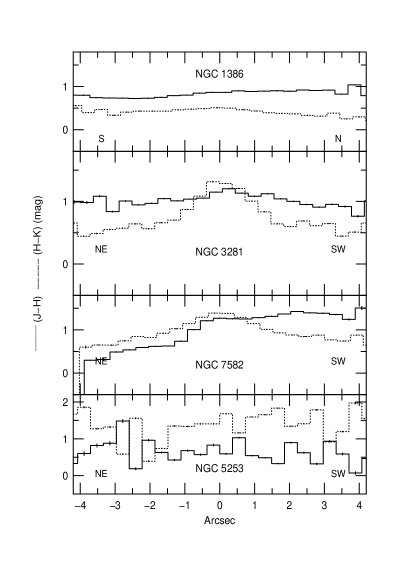
Table 6 lists the nuclear ( 08) and ‘bulge’ (08 2″) colours derived from the above profiles. These intervals correspond to linear scales of 45 to 750 pc for the inner and outer radii in the Seyfert 2 galaxies in the sample. The errors correspond to the rms around the mean of the colour in the aperture, not the observational error. Figure 25 shows four representative colour profiles: some are very flat, as in NGC 1386, while others show redder colour in the nuclear region or asymmetric profiles, as in NGC 3281 and NGC 7582, respectively. The colours in NGC 5253 are highly inhomogeneous, as might be expected from the clumpy nature of the distribution of the gas and presumably the reddening in this galaxy.
The data in Table 6 are in agreement with previous conclusions (AH96, AH98, Kotilainen et al. 1992, hereafter K92) that the nuclei of Seyferts tend to be redder than their bulges in one or both , colours. Using the full profile, our data agrees with the 15 and 3″ aperture photometry colours published in the literature within 0.1 – 0.2 mag for most objects, except NGC 4388, where our colour is 0.5 mag redder than the published values (AH96, AH98). We also find that for a few galaxies there is a 0.3 – 0.4 mag difference in the colours, most remarkably , of the ‘bulge’ regions at opposite sides of the nucleus.
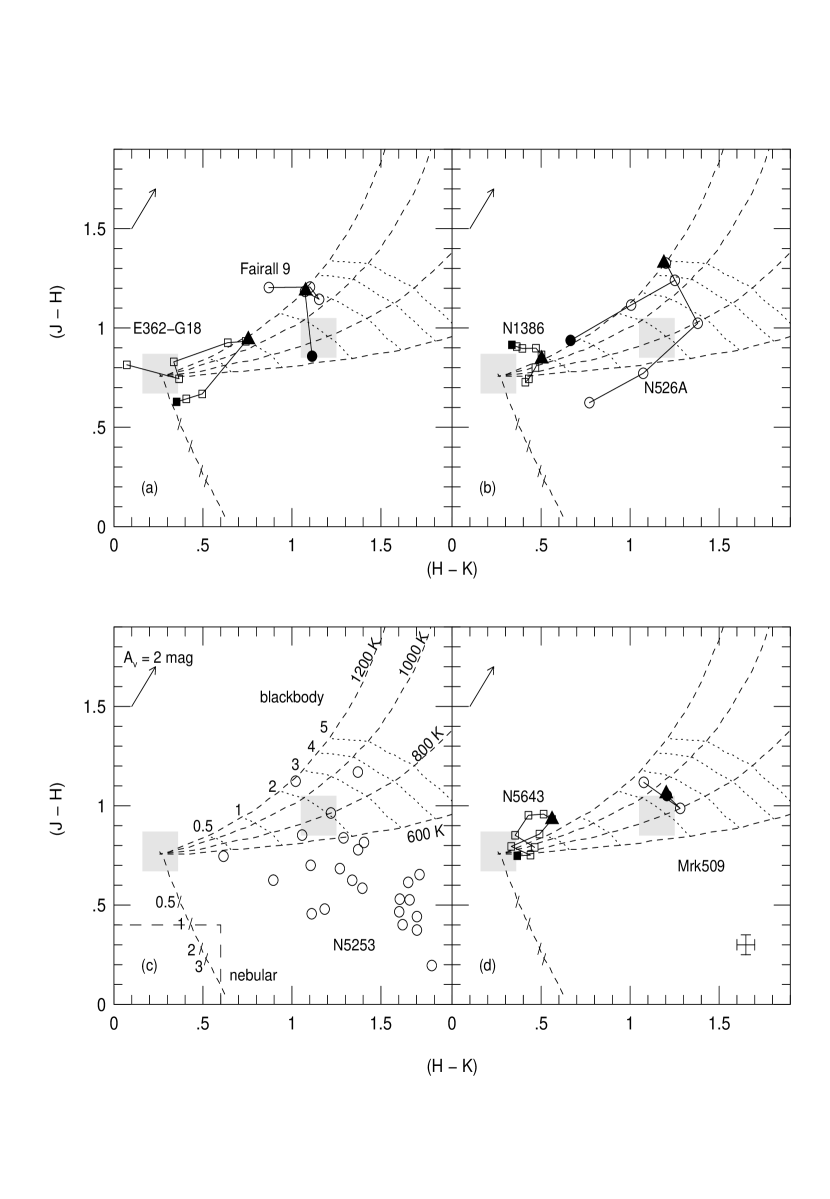
The versus colour-colour diagrams of Figures 26a to 26f are based on the work of Alonso-Herrero et al. (1998). The shaded square to the left represents the colours of bulges of normal spiral galaxies (a late-type stellar population), while the one to the right represents the typical colours of quasars, corrected to zero redshift. The area bounded by dashed lines in the lower left corner of Figs. 26c and 26g corresponds to the region occupied by a young/intermediate age stellar population component with ages ranging from to years, calculated from the models of Leitherer & Heckman (1995). The arrow in the upper-left hand corner represents the effects of 2 mag of visual extinction. The ‘mixing curves’ represented by the dashed lines are the colours of the sum of a late-type stellar population and either a black-body component (assumed to be representative of hot dust emission) with temperatures 600, 800, 1000, and 1200K, or a nebular component, corresponding to hydrogen and helium continuum and line emission. The dotted lines (diagonal slashes) are the loci of the colours for the given ratio of dust (nebular) to stellar luminosities in the K band. The results for each individual galaxy are described below.
| Object | Nucleus (R 08) | Bulge (08 R 2″) | ||||||
|---|---|---|---|---|---|---|---|---|
| NGC 526A | 1.270.03 | 1.240.04 | NW | 0.880.07 | 1.250.10 | SE | 1.120.03 | 0.990.13 |
| NGC 1365 | 1.070.03 | 0.970.03 | NW | 0.780.03 | 0.940.08 | SE | 1.050.03 | 0.570.05 |
| NGC 1386 | 0.870.01 | 0.490.01 | S | 0.770.02 | 0.450.01 | N | 0.890.01 | 0.400.02 |
| NGC 2110 | 1.010.01 | 0.940.02 | SE | 1.020.02 | 0.660.07 | NW | 1.010.04 | 0.680.05 |
| NGC 3281 | 1.130.03 | 1.210.06 | NE | 1.020.01 | 0.720.06 | SW | 1.080.02 | 0.790.10 |
| NGC 4388 (13) | 0.890.01 | 1.420.03 | N | 0.880.02 | 1.190.04 | S | 1.020.07 | 1.160.04 |
| NGC4̇388 (90) | 1.030.02 | 1.510.02 | W | 0.850.05 | 1.350.04 | E | 1.010.01 | 1.280.08 |
| NGC 5643 | 0.930.01 | 0.540.01 | W | 0.940.02 | 0.410.03 | E | 0.820.02 | 0.420.05 |
| NGC 5728 (110) | 0.940.02 | 0.450.03 | NW | 0.840.01 | 0.530.02 | SE | 0.940.01 | 0.320.01 |
| NGC 5728 (20) | 1.040.03 | 0.390.03 | NE | 0.870.05 | 0.510.01 | SW | 1.120.01 | 0.110.05 |
| NGC 7582 | 1.210.04 | 1.330.03 | NE | 0.700.06 | 0.990.07 | SW | 1.310.03 | 1.020.06 |
| ESO 362-G18 | 0.900.04 | 0.690.04 | NE | 0.840.03 | 0.380.05 | SW | 0.650.01 | 0.440.03 |
| Fairall 9 | 1.140.03 | 1.110.02 | SE | 1.190.02 | 1.080.07 | NW | 0.770.05 | 1.060.03 |
| Mrk 509 | 0.980.05 | 1.240.02 | N | 1.110.07 | 1.050.13 | S | 0.590.06 | 1.070.07 |
NGC 5253: Fig. 26c – the data points are scattered over the bottom right of the diagram. Since the long slit spectrum indicates little or no continuum emission, the data can be understood as nebular emission plus spatially inhomogeneous reddening and/or dust emission. From the Br/Pa ratio, we found regions with AV 8 mag, which would be enough to shift the points from the nebular emission curve to the observed location at the middle of the diagram.
NGC 526A: Fig 26b – the data points follow different paths in the cone (SE) and anti-cone (NW) direction, with the colour in the region 08 – 14 SE about 0.3 mag redder than to the NW. This behaviour suggests difference in the underlying stellar population content between the two sides of the nucleus. As can be seen in Fig. 26, the loci of old (left grey square) and young-intermediate (area at bottom left limited by dashed lines) stellar populations are separated by 0.8 mag in , with very little difference in the corresponding colours. Reddening effects are also very likely present and cannot be discarded as contributing to the observed colours. In the central bin (08), the colours suggest hot dust emission dominates the continuum.
NGC 1365: Fig 26f – the colours behave somewhat similarly to NGC 526A, although with the nuclear colour corresponding to a smaller ratio of hot dust to starlight emission. The bluer colour towards the NW may result from contamination of the ‘normal’, old bulge population by younger stars in the ‘hot spots’ (see Storchi-Bergmann & Bonatto 1991; Morganti et al. 1999).
NGC 1386: Fig. 26b – Both colour profiles (Fig. 25) are essentially flat, with rising slightly towards the North (the optical cone direction) and showing only a hint of a redder colour in the nuclear region. In the colour-colour plot, the points concentrate near the pure bulge region, with little or no contribution from hot dust. The orientation of both the high excitation optical and radio emission (Storchi-Bergmann et al. 1996; Weaver et al. 1991), as well as the fact that NGC 1386 contains water vapour megamaser emission (Braatz, Wilson & Henkel 1996), suggest that the collimating structure is seen edge-on. Therefore, the hot dust in the inner regions may be obscured by colder dust further out in the disk, resulting in a small contribution from the nucleus to the near infrared continuum.
NGC 2110: Fig. 26h – The analysis of the J and K band continua presented in Paper I indicates the presence of a hot dust component in the inner 150pc, consistent with emission by a circumnuclear torus. The observed colour profiles confirm this finding: while the distribution is essentially flat across the nucleus, the colour increases by about 0.5 mag in the inner 2″ relative to the external regions. In the colour-colour diagram, ignoring the foreground galactic reddening (G 0.36; Burstein & Heiles 1982), the points trace a continuous path from pure bulge colours to a combination of bulge and a 1200 K black-body component at the nucleus.
NGC 3281: Fig.26g – The colour profiles (Fig. 25) present a similar behaviour to that observed in NGC 2110, with the variation in colour being even more pronounced, with a 0.7 mag decrease from the nucleus to the bulge. This would indicate a higher fraction of hot dust emission in the nuclear region than in the NGC 2110 case, but of a somewhat lower temperature ( 1000 K).
NGC 4388: Fig. 26e – The colour is redder at the nucleus than in the bulge at PA = 13°, similar to what is observed in NGC 2110 and NGC 3281. The effect is much less apparent at PA = 90°, which can be understood if, as mentioned in Section 3.1, we missed the nucleus on this observation. Both PA’s occupy the same region in the colour diagram, and the data points for the whole inner 5–6″ ( 1 kpc) are shifted towards redder colours when compared with other published values (K92, AH98).
NGC 5643: Fig. 26d – The colour profiles are flat across the nucleus. In the colour diagram, the points cluster near the bulge colours, with a small contribution from dust emission or a foreground reddening of AV 1.5 – 2 mag. Again, this could be a case of a torus either too cold to emit in the near infrared or with inner regions obscured from our line of sight by the outer ones.
NGC 5728: Fig. 26e – For PA = 110°, both colour profiles are rather flat. In the colour-colour plot, the data points cluster close to normal bulge colours, similar to what is observed for NGC 5643. Along the perpendicular direction (PA = 20°), is somewhat redder and bluer towards the SW than to the NE.
NGC 7582: Fig. 26h – The profile (Fig. 25) exhibits the same behaviour as observed in NGC 2110 and NGC 3281, with the nuclear colour 0.5 mag redder than the bulge. The profile, however, rises steadily to the SW, with a 0.8 mag increase from 3″ NE to 3″ SW (the cone side). In the colour-colour diagram, the nucleus corresponds to a dominant contribution from 1000 K black-body emission. The data points starting at 3″ NE can be interpreted as a reddened evolving starburst, with increasing reddening towards the nucleus (up to AV 8 mag). The colours observed on the SW (cone) side of the nucleus are suggestive of a reddened , old stellar population.
ESO 362-G18: Fig. 26a – The data points start with bulge colours at 3″ NE, run along a line of increasing contribution from hot dust, up to a maximum of equal contributions from both sources at the nucleus, and then return with colours 0.2 mag bluer towards the SW. This effect can again be explained by a different underlying stellar population: an evolving starburst is bluer in but occupies almost the same region in as the typical late-type, bulge population.
Mrk 509 and Fairall 9: Fig. 26d and 26a – the PSF of the nucleus dominates the inner 4″ due to the brightness of the central source. Since the sources are unresolved, the data points cluster around the colours characteristic of quasars, as expected for these type 1 Seyfert galaxies.
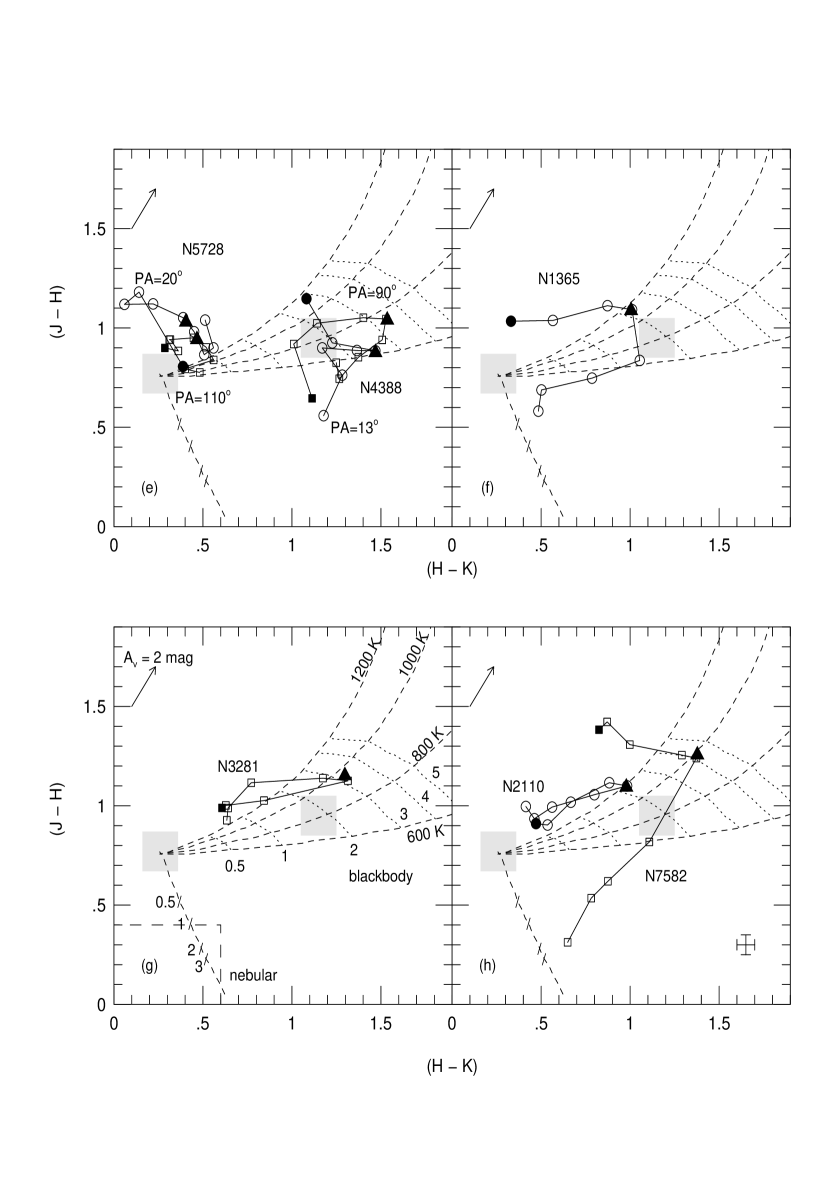
(e) NGC 5728 (circles) PA=20° (-3.4 NE,3.8 SW), (squares) PA=110° (-3.4 NW,3.8 SE) and NGC 4388 (circles) PA=13° (-3.4 NE,2 SW), (squares) PA=90° (-3.4 W,3.8 E); (f) NGC 1365 (-2.8 NW,3.8 SE); (g) NGC 3281 (-3.4 NE,3 SW); (h) NGC 2110 (-3.4 SE,3.8 NW) and NGC 7582 (-3.4 NE,3.8 SW).
4 Summary and conclusions
We obtained near-infrared, long-slit spectra for a sample of 12 Seyfert 2s, 3 Seyfert 1s, and the starburst galaxy NGC 5253, using as the main selection criterion the presence of extended high-excitation emission observed in optical images. From our analysis of the spatial, and spectral emission-line profiles, and of the continuum and colours, we conclude that:
-
•
consistent with the selection criteria, 9 of the 12 objects with extended optical emission lines also present extended emission lines in the near-IR along the position angle of the optical ionization cones or radio emission. In three cases, however, we found that the near-IR emission lines were also extended along PAs oriented perpendicular to the optical/radio emission axis. The clearest case where high-excitation near-IR line emission traces the optical ionization structure is NGC 7582, where the emission lines in the inner few arcsec are extended along the direction of the optical cone. Interestingly, the maxima of the emission-line distributions in this galaxy are consistently offset from the peak of the continuum emission by 08 in the direction opposite to the optical cone. Besides the central peak, the spatial profile of the [Fe ii] 1.64m line in NGC 7582 presents a secondary structure between 05 and 25 SW, with the [Fe ii] 1.64m/Pa ratio increasing from 0.5 at the position of the continuum peak to 4.4 at 16 SW, indicating a different ionization mechanism for the [Fe ii] line in this region. A similar result was found for NGC 1386, for which the [Fe ii] 1.26m/Pa ratio rises from 2 to 6 between the nucleus and the optical extended emission-line region at 2″ N. These high values and the presence of radio emission and/or a high velocity nuclear outflow spatially coincident with the optical ENLR suggest that shocks may play a role as an excitation mechanism for the off-nuclear [Fe ii] line in both galaxies.
-
•
the low resolution (XD) spectra are not sufficiently sensitive to detect the expected H2 emission from the torus. However, in the few cases for which we have a high resolution K band spectra (Mrk 573, IC 5063, NGC 2110), the H2 S(1) 2.12m was clearly detected.
-
•
broad components have been observed in the permitted emission lines of the Seyfert 1 galaxies, in nuclear Pa in NGC 1365, and very likely in Br in Mrk 573. In NGC 1365 the flux of the broad (FWHM 1500 km s-1) component of Pa was used to estimate a reddening of AV 8 mag towards the BLR. A lower limit of 9 mag was obtained for AV towards the BLR of Mrk 573. In NGC 4388 and Mrk 573 the [S ix] 1.262m emission line was detected, and found to be spatially unresolved in both objects. With an ionization potential of 0.328 keV, the detection of this species is an indirect evidence of significant soft X-rays continuum flux in these galaxies. In NGC 5253, the Br/Pa ratio was used to map strong reddening variations, from AV 0 to 6 mag within the central 8″.
-
•
spatial and colour profiles were derived from our spectra. For most Seyfert 2s, the nuclear colours are redder than the extranuclear values, with the nuclear continuum being dominated by hot (T 1000 K) dust emission in NGC 1365, NGC 2110, NGC 3281, NGC 7582, and ESO 362-G18. In NGC 1386, NGC 5643, and NGC 5728, the nuclear colours are consistent with a continuum dominated by the emission from the underlying stellar population plus a smaller contribution from dust and/or foreground reddening effects. The Seyfert 1 nuclei, Mrk 509 and Fairall 9, have colours similar to quasars, as expected.
-
•
the galaxies NGC 526A, NGC 1365, NGC 7582, and ESO 362-G18 show a clear difference between the colours on each side of the nucleus. Since late-type (bulge) and young/intermediate stellar populations differ mostly in their colour, being approximately the same, we explain this effect by differences in the underlying stellar population, very likely coupled with reddening. The observed colour differences could indicate the presence of a younger/intermediate age component, associated, for example, with the star-forming rings known to exist in some of the observed galaxies, and which could provide a larger contribution to the near-IR continuum on one side of the nucleus relative to the other.
Acknowledgements
This work has made use of NASA’s Astrophysics Data System Abstract Service (ADS), and of the NASA/IPAC Extragalactic Database (NED) which is operated by the Jet Propulsion Laboratory, California Institute of Technology, under contract with the National Aeronautics and Space Administration. Research partially supported by the Brazilian Agencies FAPERGS and CNPq.
References
- [Alonso-Herrero et al. 1996] Alonso-Herrero A., Ward M. J., Kotilainen J. K. 1996, MNRAS, 278, 902. (AH96)
- [Alonso-Herrero et al. 1997] Alonso-Herrero A., Rieke M. J., Rieke G. H., Ruiz M. 1997, ApJ, 482, 747.
- [Alonso-Herrero et al. 1998] Alonso-Herrero A., Simpson C., Ward M. J., Wilson A. S. 1998, ApJ, 495, 196. (AH98)
- [Antonucci 1993] Antonucci R. R. J. 1993, ARA&A, 31, 473.
- [Braatz et al. 1996] Braatz J. A., Wilson A. S., Henkel C. 1996, ApJS, 106, 51.
- [Burstein & Heiles 1982] Burstein D., Heiles C. 1982, AJ, 87, 1165.
- [Blietz et al. 1994] Blietz M., Cameron M., Drapatz S., Genzel R., Krabbe A., van der Werf P., Sternberg A., Ward M. 1994, ApJ, 421, 92.
- [Calzetti et al. 1997] Calzetti D., Meurer G. R., Bohlin R. C., Garnett D. R., Kinney A. L., Leitherer C., Storchi-Bergmann T. 1997, AJ, 114, 1834.
- [Colina 1993] Colina L. 1993, ApJ, 411, 565.
- [Falcke et al. 1998] Falcke H., Wilson A. S., Simpson C. 1998, ApJ, 502, 199.
- [Fischer et al. 1987] Fischer J., Smith H. A., Geballe T. R., Simon M., Storey J. W. V. 1987, ApJ, 320, 667.
- [Forbes & Ward 1993] Forbes D. A., Ward M. J. 1993, ApJ, 416, 150.
- [Giannuzzo & Stirpe 1996] Giannuzzo E. M., Stirpe G. M. 1996, A&A, 314, 419.
- [Glass & Moorwood 1985] Glass I. S., Moorwood A. F. M. 1985, MNRAS, 214, 429.
- [Kawara et al. 1990] Kawara K., Nishida M., Gregory B. 1990, ApJ, 352, 433.
- [Kotilainen et al. 1992] Kotilainen J. K., Ward M. J., Boisson C., DePoy D. L., Bryant L. R., Smith M. G. 1992, MNRAS, 256, 149.
- [Kristen et al. 1997] Kristen H., Jörsäter S., Lindblad P. O., Boksenberg A. 1997, A&A, 328, 483.
- [Krolik & Begelman 1988] Krolik J. H., Begelman M. C. 1988, ApJ, 329, 702.
- [Kulkarni et al. 1998] Kulkarni V. P. et al. 1998, ApJ, 492, L121.
- [Leitherer & Heckman 1995] Leitherer C., Heckman T. M. 1995, ApJS, 96, 9.
- [Lumsdey & Puxley 1996] Lumsdey S. L., Puxley P. J. 1996, MNRAS, 281, 493.
- [Marco et al. 1997] Marco O., Alloin D., Beuzit J. L. 1997, A&A, 320, 399.
- [Miller & Goodrich 1990] Miller J. S., Goodrich R. W. 1990, ApJ, 378, 47.
- [Moorwood & Oliva 1990] Moorwood A. F. M., Oliva E. 1990, A&A, 239, 78.
- [Moorwood et al. 1996] Moorwood A. F. M., van der Werf P. P., Kotilainen J. K., Marconi A., Oliva E. 1996, A&A, 308, 1.
- [Morganti et al. 1998] Morganti R., Oosterloo T., Tsvetanov Z. 1998, AJ, 115, 915.
- [Morganti et al. 1999] Morganti R., Tsvetanov Z. I., Gallimore J., Allen M. G. 1999, A&AS, 137, 457.
- [Morris et al. 1985] Morris S., Ward M., Whittle M., Wilson A. S., Taylor K. 1985, MNRAS, 216, 193.
- [Mulchaey et al. 1996] Mulchaey J. S., Wilson A. S., Tsvetanov Z. I. 1996, ApJS, 102, 309.
- [Nagar et al. 1999] Nagar N. M., Wilson A. S., Mulchaey, J. S., Gallimore J. 1999, ApJS, 120, 209.
- [Osterbrock 1989] Osterbrock D. E. 1989 Astrophysics of Gaseous Nebulae and Active Galactic Nuclei, University Science Books, Mill Valley, California.
- [Philips et al. 1983] Phillips M. M., Baldwin J. A., Atwood B., Carswell R. F. 1983, ApJ, 274, 558.
- [Pier & Krolik 1993] Pier E. A., Krolik J. H. 1993, ApJ, 418, 673.
- [Pogge 1989] Pogge R. W. 1989, ApJ, 345, 730.
- [Pogge & de Robertis 1995] Pogge R. W., de Robertis M. M. 1995, ApJ, 451, 585.
- [Schmitt et al. 1994] Schmitt H. R., Storchi-Bergmann T., Baldwin J. A. 1994, ApJ, 423, 237.
- [Schmitt et al. 1999] Schmitt H. R., Storchi-Bergmann T., Cid Fernandes R. 1999, MNRAS, 303, 173.
- [Scoville et al. 1982] Scoville N. Z., Hall D. N. B., Ridgway S. T., Kleinmann S. G. 1982, ApJ, 253, 136.
- [Simpson et al. 1994] Simpson C., Ward M., Kotilainen J. 1994, MNRAS, 271, 250.
- [Simpson et al. 1996a] Simpson C., Forbes D. A., Baker A. C., Ward M. J. 1996a, MNRAS, 283, 777.
- [Simpson et al. 1996b] Simpson C., Mulchaey J. S., Wilson A. S., Ward M. J., Alonso-Herrero A. 1996b, ApJ, 457, L19.
- [Simpson et al. 1997] Simpson C., Wilson A. S., Bower G., Heckman T. M., Krolik J. H., Miley G. K. 1997, ApJ, 474, 121.
- [Stevens et al. 1999] Stevens I. R., Forbes D. A., Norris R. P. 1999, MNRAS, 306, 479.
- [Storchi-Bergmann & Bonatto 1991] Storchi-Bergmann T., Bonatto C. J. 1991, MNRAS, 250, 138.
- [Storchi-Bergmann et al. 1993] Storchi-Bergmann T., Baldwin J. A., Wilson A. S. 1993, ApJ, 410, L11.
- [Storchi-Bergmann et al. 1996b] Storchi-Bergmann T., Rodriguez-Ardila A., Schmitt H. R., Wilson A. S., Baldwin J. A. 1996, ApJ, 472, 83.
- [Storchi-Bergmann et al. 1999] Storchi-Bergmann T., Winge C., Ward M. J., Wilson A. S. 1999, MNRAS, 304, 35. (Paper I)
- [Stone et al. 1988] Stone J. L. Jr., Wilson A. S., Ward M. J. 1988, ApJ, 330, 105.
- [Tran 1995] Tran H. D. 1995, ApJ, 440, 597.
- [Ulvestad & Wilson 1984] Ulvestad J. S., Wilson A. S. 1984, ApJ, 285, 439.
- [Vanzi et al. 1998] Vanzi L., Alonso-Herrero A., Rieke G. H. 1998, ApJ, 504, 93.
- [Veilleux et al. 1997] Veilleux S., Goodrich R. W., Hill G. J. 1997, ApJ, 477, 631.
- [Veilleux et al. 1999] Veilleux S., Bland-Hawthorn J., Cecil G., Tully R. B., Miller S. T. 1999, ApJ, 520, 111.
- [Véron et al. 1980] Véron P., Lindblad P. O., Zuiderwijk E. J., Adam G., Véron M. P. 1980, A&A, 87, 245.
- [Weaver et al. 1991] Weaver K. A., Wilson A. S., Baldwin J. A. 1991, ApJ, 366, 50.
- [Wilson et al. 1985] Wilson A. S., Baldwin, J. A., Ulvestad, J. S. 1985, ApJ, 291, 627.
- [Wilson et al. 1993] Wilson A. S., Braatz J. A., Heckman T. M., Krolik J. H., Miley G. K. 1993, ApJ, 419, L61.
- [Wilson & Tsvetanov 1994] Wilson A. S., Tsvetanov Z. I. 1994, AJ, 107, 1227.