APM 08279+5255: Keck Near- and Mid-IR High-Resolution Imaging 11affiliation: Based on observations obtained at the W. M. Keck Observatory which is operated jointly by the California Institute of Technology, the University of California, and NASA.
Abstract
We present Keck high-resolution near-IR (2.2 m; FWHM 015) and mid-IR (12.5 m; FWHM 04) images of APM 08279+5255, a IR-luminous BALQSO with a prodigious apparent bolometric luminosity of , the largest known in the universe. The -band image shows that this system consists of three components, all of which are likely to be the gravitationally lensed images of the same background object, and the 12.5 m image shows a morphology consistent with such an image configuration. Our lens model suggests that the magnification factor is 100 from the restframe UV to mid-IR, where most of the luminosity is released. The intrinsic bolometric luminosity and IR luminosity of APM 08279+5255 are estimated to be 5 and 1 , respectively. This indicates that APM 08279+5255 is intriniscally luminous, but it is not the most luminous object known. As for its dust contents, little can be determined with the currently available data due to the uncertainties associated with the dust emissivity and the possible effects of differential magnification. We also suggest that the lensing galaxy is likely to be a massive galaxy at .
keywords:
gravitational lensing — infrared: galaxies — quasars: emission lines — quasars: individual (APM 08279+5255)1 INTRODUCTION
In the course of a survey for distant cool carbon stars in the Galactic halo, Irwin et al. (1998) serendipitously discovered an extremely luminous broad absorption line QSO at , APM 08279+5255.111The redshift obtained by Irwin et al. (1998) was 3.87, but the CO line observation by Downes et al. (1999) later showed that the redshift of this system is 3.9110, and that the absorption lines measured by Irwin et al. (1998) are probably blueshifted due to the gas outflow in this object. To avoid confusion, we adopt a redshift of 3.91 throughout this paper. Its phenomenally large apparent luminosity is immediately clear from its observed magnitude: the observed magnitude of 15.2 mag corresponds to an absolute magnitude of mag after a K correction. Furthermore, this object was also detected at 25, 60, and 100 m in the IRAS Faint Source Catalog with flux densities of 0.23, 0.51, and 0.95 Jy. All together, the apparent bolometric luminosity of this object reaches an unprecedented level of L⊙, which would make APM 08279+5255 the most luminous object known in the universe222Throughout this paper, we adopt the values of H km s-1 Mpc-1 and q..
The observations to date indicate that APM 08279+5255 is likely to be gravitationally lensed. Irwin et al. (1998) showed that the -band image of this object, taken under a 09 seeing, is slightly elongated, and that the image likely consists of two point sources separated by 03–045 with a flux ratio of 1.05–1.15, probably being two gravitationally lensed images of the same QSO. Subsequently, Ledoux et al. (1998) performed adaptive-optics observations in the band, which achieved a spatial resolution of 03. Their image shows two point sources separated by 035002 with a flux ratio of 1.210.25, in good agreement with the values derived by Irwin et al. (1998). In addition, by using an optical integral-field spectrograph, Ledoux et al. (1998) showed that the optical spectra of these two sources are quite similar, strengthening the gravitational lensing hypothesis for this object.
At the same time, the far-IR and submillimeter observations have shown that APM 08279+5255 contains a large amount of gas and dust, making this object an extreme example of a hyper/ultra-luminous IR galaxy/QSO. In addition to the IRAS far-IR detections, its continuum was also detected in the submillimeter by Lewis et al (1998). The black-body dust temperature was estimated from the submillimeter SED to be 220 K, which in turn results in a dust mass with no magnification correction of M⊙ (Lewis et al. (1998)). Later, Downes et al. (1999) detected two CO lines (4–3 and 9–8) by millimeter interferometry, and derived the molecular gas temperature of K from the line ratio. The mass of molecular gas was calculated to be M⊙ with a magnification factor of 7–20. From a simultaneous millimeter continuum observation, they also derived the dust mass of M⊙ with a magnification factor of 7–30. The detection of the CO (9–8) line is especially important because this is direct evidence that this object contains hot and dense molecular gas.
APM 08279+5255 was also found to have a significant visual linear polarization ( %, Hines et al. 1999). Hines et al. also suggest that the broad absorption trough formerly identified as a damped Ly- absorption system by Irwin et al. (1998) may be a O iv/Ly broad absorption line intrinsic to the QSO because there is an increase of polarization in the trough.
From the currently available data, APM 08279+5255 looks very much like the hyperluminous IR QSO H1413+117 (Cloverleaf QSO) and the warm ultraluminous IR galaxy Mrk 231, in the sense that it contains a clearly visible QSO nucleus surrounded by a large amount of gas and dust. The major difference between these two objects and APM 08279+5255 seems to be the exceptionally large luminosity of the latter, which is likely the effects of gravitational lensing. In these systems, the existence of a powerful QSO nucleus seems to indicate that the QSO is the dominant luminosity source, generating the large IR luminosity by heating dust.
Here, we present high-resolution images of APM 08279+5255 in the near- and mid-IR taken with the Keck telescope. Our high-resolution (FWHM 015) -band image shows a third component between the two components previously detected. We argue that it is another lensed image of the same background QSO, and examine the intrinsic properties of the lensed QSO based on the lens model. We especially try to constrain the effects of differential magnification since they could introduce a significant distortion in the observed spectral energy distribution (SED) as shown by Blain (1999).
After the initial submission of this paper, we were informed by Drs. Ibata and Lewis that a similar work was going to be submitted based on the analysis of HST/NICMOS images of APM 08279+5255 (Ibata 1999). The two sets of observational data are in excellent agreement. Both studies (1) detect a third image, (2) derive similar positions and relative brightnesses for all three images, and (3) conclude that the third image is likely to be another lensed image of the same background QSO and construct a similar lens model based on this assumption. Although our work was carried out independently of their work, we have opted to incorporate their results whenever they provide critical pieces of information to understand this object.
2 OBSERVATIONS AND DATA REDUCTION
2.1 Near-IR Imaging
The -band images of APM 08279+5255 were taken on the night of UT 1998 October 3 with the Near Infra-Red Camera (NIRC; Matthews & Soifer (1994)) on the Keck I telescope on Mauna Kea in Hawaii. NIRC uses a Hughes-SBRC 256 256 InSb array as the detector, and is attached to the f/25 forward Cassegrain focus of the telescope, producing a pixel scale of 015/pixel with a field of view of 38″ on a side. For this observation, the NIRC image converter (Matthews et al. (1996)) was used with NIRC to achieve a high spatial resolution. The image converter changes the beam from f/25 to f/180, producing a pixel scale of 00206/pixel with a field of view of 53 on a side. For -band imaging, the integration time was 10 seconds per image. The highest resolution image was produced by combining the four images (40 seconds total) with the minimum image size (i.e., selective shift & add). The extremely good seeing that night resulted in a FWHM of 015 in this -band image.
2.2 Mid-IR Imaging
The 12.5 m and 17.9 m images were initially taken on the night of UT 1998 October 3 using the MIRLIN mid-IR camera (Ressler et al. (1994)) on the Keck II telescope. MIRLIN uses a Boeing 128 128 Si:As array, and is attached to the f/40 bent Cassegrain visitor port of the telescope, producing a pixel scale of 0138/pixel with a field of view of 17″on a side. The total integration time was 15 minutes at each wavelength. These images were used to measure the mid-IR flux density of APM 08279+5255. Calibration was done by observing bright stars tied to the IRAS calibration at 12 and 25 m (IRAS Explanatory Supplement 1988).
The higher spatial-resolution 12.5 m image of APM 08279+5255 was taken on the night of UT 1999 November 25 using the Long Wavelength Spectrometer (LWS; Jones et al. (1993)) on the Keck I telescope in the imaging mode. LWS uses a Boeing 128 128 Si:As array, and is attached to the f/25 forward Cassegrain focus of the telescope, producing a pixel scale of 008/pixel with a field of view of 102 on a side. The seeing was 04 FWHM, and the total integration time was 27 minutes.
2.3 Near-IR Photometry
Near-IR photometry was obtained on UT 1998 November 3 with the InSb camera on the 200-inch Telescope at Palomar Observatory. Calibration was done by measuring stars listed by Elias et al. (1982).
The magnitudes and flux densities reported here are listed in Table 1. All the photometry was done with a 4″-diameter beam.
3 RESULTS
3.1 The -band Image
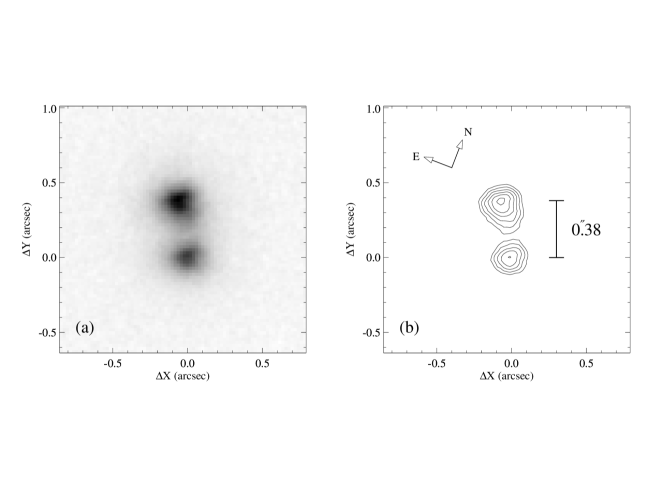
The -band grey-scale image with scale 00206/pixel is shown in Figure 1a with the contour map of the same data in Figure 1b. It is immediately clear from this image that the -band image consists of two bright components, which is consistent with the previous observations by Irwin et al. (1998) and Ledoux et al. (1998). The northern brighter source is slightly extended to the south-west. Since the southern source is quite circularly symmetric, this suggests that the extension in the northern source is a third fainter component.
We performed a point-spread-function (PSF) fitting using DAOPHOT (Stetson (1987)) on the -band image. First, it was assumed that the two main bright components are basically point sources, and that we could construct the PSF by using the upper half of the upper component and the lower half of the lower component. Two axisymmetric PSFs were first produced from two half PSFs by self-reflection, and their average was taken to produce the final PSF. In other words, we assumed that the PSF is symmetric with respect to the horizontal axis in Figure 1.
To determine the position of the third component accurately enough as the starting point for the PSF fitting, we first performed the two-PSF subtraction. The position of the third component was determined in the residual image, and with this added information, we then performed the three-PSF subtraction.
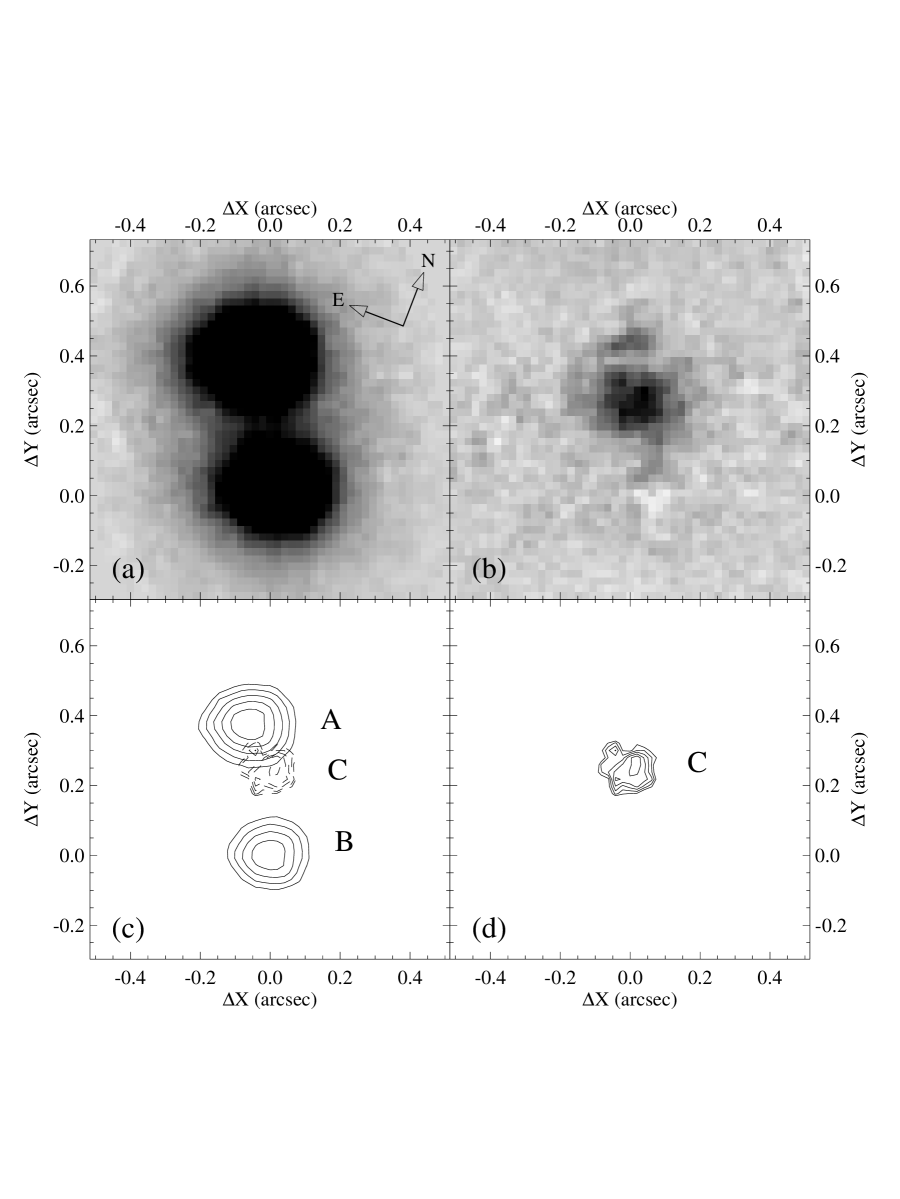
The three components we have finally found are shown in Figure 2a and 2b together with their contour maps Figure 2c and 2d. We refer to these components as A, B, and C in descending order of brightness. The positions and relative brightnesses determined from the PSF fitting for each component are listed in Table 2. Using the flux ratios, the magnitudes of individual components were derived from magnitude of mag for the total system. The derived FWHMs indicate that the seeing was 015 when the image was taken. The FWHM of the component C indicates that this component is also point-like. For our further discussions, we assume that the -band image of APM 08279+5255 consists of three point sources.
Overall our measured positions and relative brightnesses of the three components are in good agreement with the values derived by Ibata et al. (1999).
3.2 The 12.5 m Image
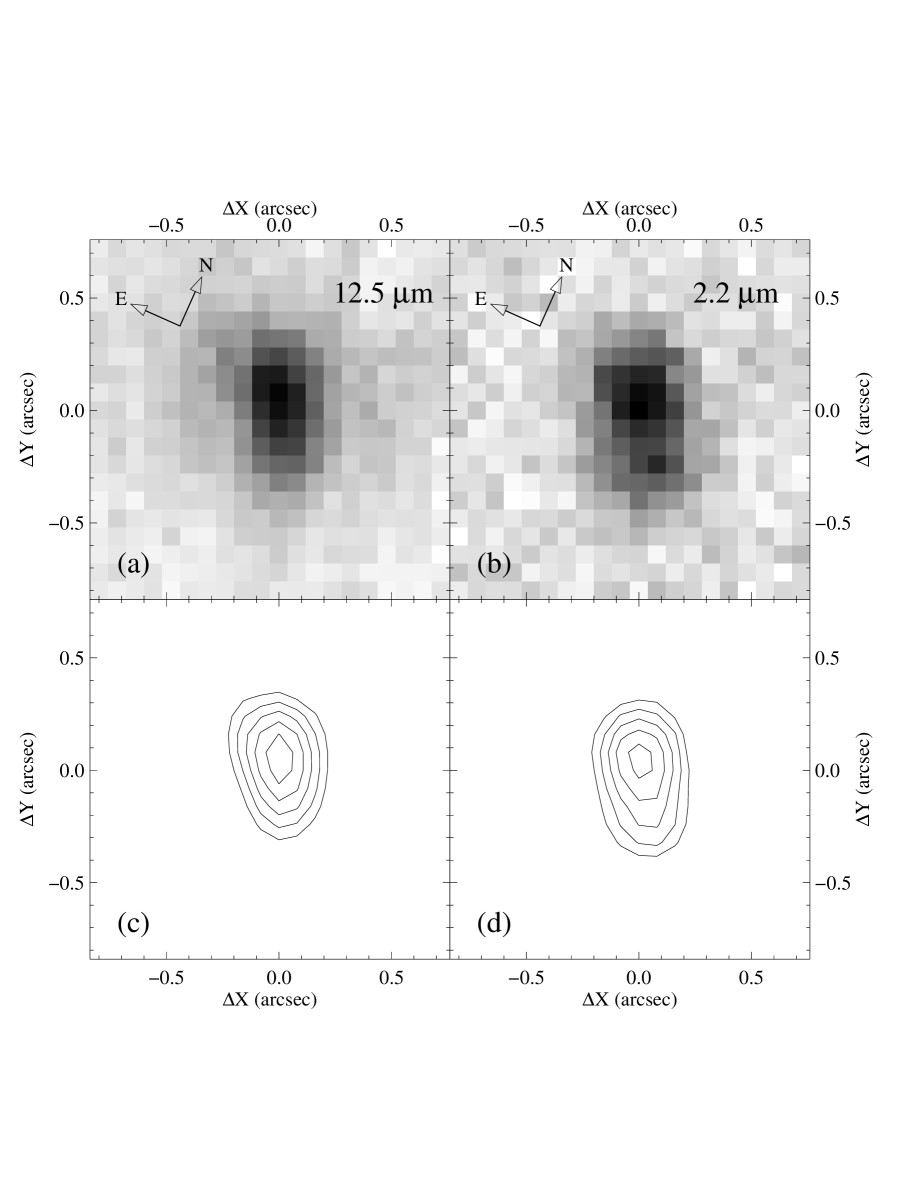
The LWS 12.5 m image of APM 08279+5255 is shown in Figure 3a. Figure 3b is an artificial image showing how the three components detected in the band would look like if observed with the LWS pixel scale (008/pixel) under the same seeing condition (FWHM 04). This image was simulated using the parameters listed in Table 2. Contour maps of the images are also shown in Figure 3c and 3d, respectively.
The morphological resemblance is clear. Although there might be a small difference in morphology between the two images, we cannot say with confidence that it is real. The 12.5 m image shape changes from image to image considerably because of the lower signal-to-noise ratio, and the image shape might have been smeared when a large number of images were combined. Therefore, based on the overall ellipticity of the image contours, we conclude that the image configuration at 12.5 m is similar to that in the band.
4 DISCUSSION
4.1 The Lens Model
To construct a gravitational lens model, we use the elliptical effective lensing potential in the following form (Blandford & Kochanek 1987; Narayan & Bartelmann 1999):
| (1) |
where is the Einstein radius, and are the core radius and ellipticity of the lensing potential, and and are rectangular coordinates in radians with respect to an arbitrarily defined optic axis. Although we treat the Einstein radius itself as a free parameter, it can also be expressed as,
| (2) |
where is the standard angular distance between the lens and the source (cf., Fukugita et al. (1992)), is the angular distance from the observer to the background source, is the internal velocity dispersion of the lensing galaxy (i.e., the mass), and is the speed of light. For a given Einstein radius, this equation sets the constraints on the mass and redshift of the lens. In addition to these parameters specifying the shape of the potential, the center position (,) and the position angle () of the lensing potential must be specified. All together, the model contains six unknown parameters (, , , , and ).
The major uncertainty with APM 08279+5255 is the nature of component C. There are two possibilities: it is either a third lensed image of the same background source or the lensing galaxy. We will construct models based on both these assumptions, and evaluate their validity based on the available observational data.
4.1.1 Three-Image Model
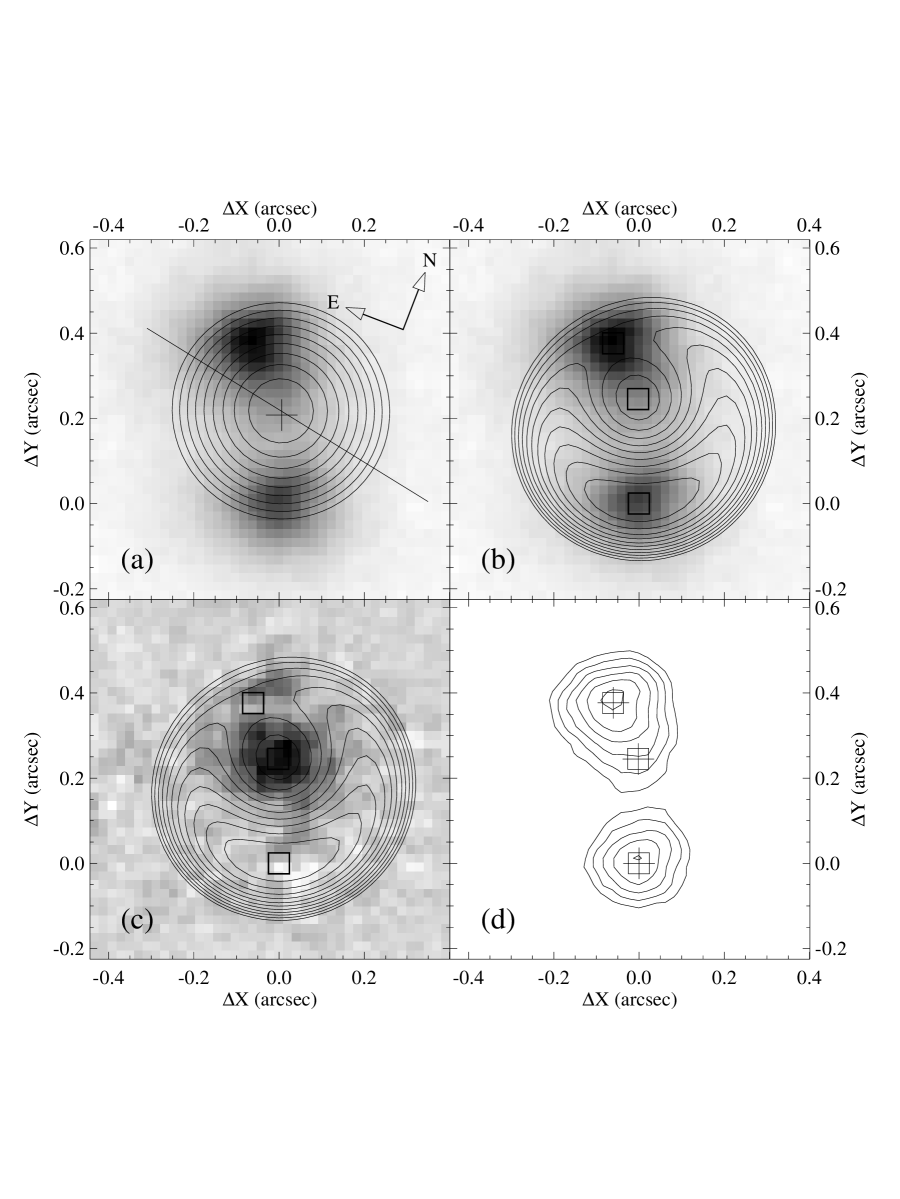
Three lensed images provide six constraints: two relative brightnesses and four coordinates giving two relative image positions with respect to the other. Since the number of model parameters is also six, we can determine the values of the parameters, but cannot assess the goodness of the fit. The best-fit model was searched by taking component B as the reference and varying the parameters such that the source positions of components A and C coincide with that of B while the derived relative magnifications approach the observed flux ratios. Our best-fit model parameters are shown in Table 3. Figure 4 shows the profile of the effective lensing potential, the time-delay surface, and the expected image positions. Basically, this model reproduces the positions and relative brightnesses of three images well within the observational uncertainties. The lens is almost round () and has a large core radius (). This is because the three images are almost in a straight line (i.e., small ) and the third image is very bright (i.e., large ). The total magnification factor for a point source333We originally derived a value of 71, which was quoted by Ibata et al. (1999), but our later calculation increased the value to 86, which agrees with Ibata et al.’s value of 90. was calculated to be 86.
4.1.2 Two-Image Model
Ibata et al. (1999) presented the possibility that component C might be the lensing galaxy rather than a third lensed image. In this case, the number of the model parameters reduces to three (, , and ). The core radius can be set to 0 because the lack of a third image implies a singular potential core while the position of component C directly determines the position of the lensing galaxy (, )444Our model is slightly different from that of Ibata et al. (1999) in that we fix the lens position at the position of component C. Their model treats the lens position as a free parameter.. On the other hand, two lensed images provide three constraints: one relative brightness and two coordinates giving one relative image position with respect to the other. Again, the number of the model parameters and that of the constraints are the same. The derived parameters are shown in Table 3. The major difference from the three-image model is the much lower value of total magnification (7). Also, the ellipticity of the potential is becoming significant (0.08). The overall structure of the time-delay surface is very similar to that of the three-image model.
4.2 Magnification of Extended Sources
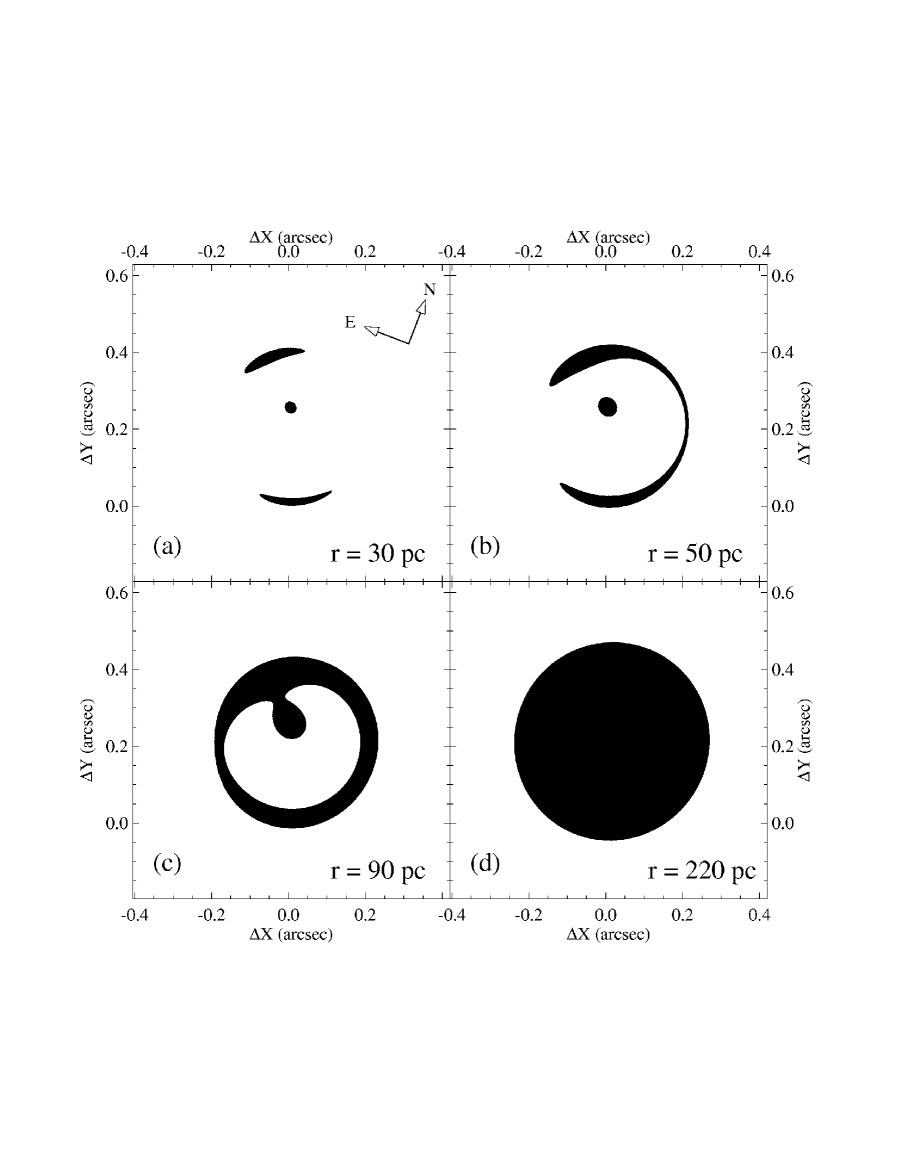
The background source is likely to be spatially extended at longer wavelengths. Therefore, it is necessary to understand how the lens distorts and magnifies an extended source as the outer edge of the source approaches/crosses the caustics. For a background source that is a uniform circular disk, the lensed image can be constructed with the methods of Schramm & Kayser (1987). Since the surface brightness is preserved in gravitational lensing, the areal ratio between the source and the images gives the magnification factor.
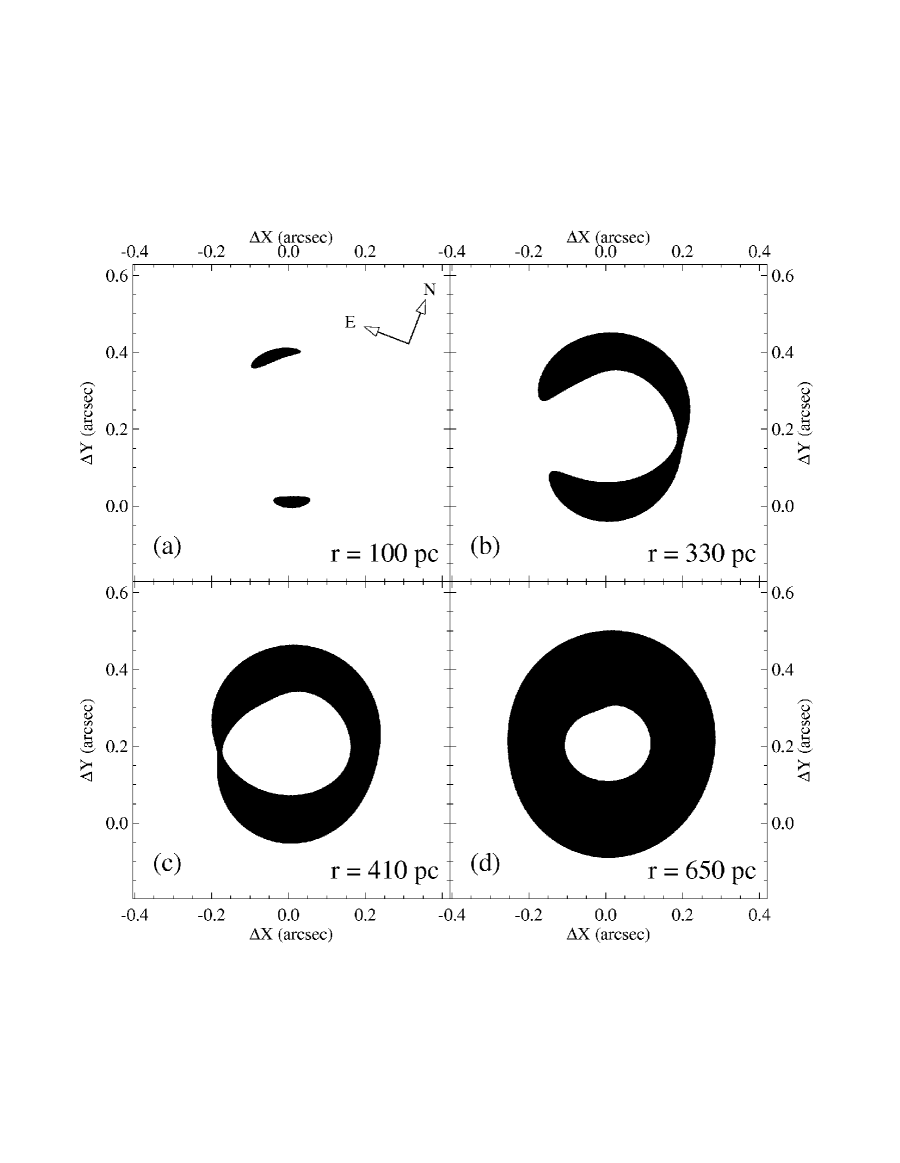
For the two models, we show how the source crosses the caustics (Figures 5 and 6) and how the shapes of the lensed images change (Figure 7 and 8). The behavior is similar in the two models: as the source size increases, it first forms an arc (b) and later turns into a ring (c). In the case of the three-image model, the ring quickly becomes a filled disk due to the third image while the ring is not completely filled in the two-image model even with a source radius of 650 pc (d). Figure 9 shows how the total magnification factor changes as the source radius increases in the two models.
There are three major differences between the two models in terms of their response to extended sources. First, a much larger source size is required in the two-image model for each transition of the lensed image shape as shown in Figure 8. Second, the magnification is much greater in the three-image model. Figure 9 shows that the magnification factor of the three-image model could be as large as when the source radius is 50–90 pc while that of the two-image model is more than an order of magnitude less () for the same radius range. Third, the magnification factor of the two-image model hardly changes with an increasing source size while the magnification factor of the three-images model is very sensitive to such a change (Figure 9). In other words, the effects of differential magnification could be significant with the three-image model.
4.3 Differential Reddening
One uncertainty underlying the discussion so far is differential reddening. For example, if the three-image model is correct, the line of sight to component C intersects the lensing galaxy at a point only 003 from the galaxy’s center (Figure 5b). Such an angular separation corresponds to 200–250 pc at a lensing galaxy’s redshift of . If this is the case, the brightness of component C might be more heavily affected by the reddening in the lensing galaxy than those of the other two components. This would produce observed flux ratios considerably different from the intrinsic ones.
However, the currently available data seem to indicate that differential reddening is not significant in this system. Ibata et al. (1999) noted that the three components have almost identical colors from 1.10 m to 2.05 m. Our -band image also do not show any sign of change in the flux ratio or image morphology, which would have resulted if component C brightens significantly at longer wavelengths. The 12.5 m image also seems to be consistent with the -band image. Therefore, it seems unlikely that the derived models are in serious error due to differential reddening.
4.4 The Nature of the Third Image
As seen in Figure 9, depending on whether component C is a third lensed image or a lensing galaxy, the magnification factor could be drastically different. Therefore, the nature of component C is a decisive factor when determining the intrinsic properties of APM 08279+5255. We list three arguments favoring the idea that component C is a third lensed image rather than the lensing galaxy.
4.4.1 The large apparent brightness of component C
If component C is the lensing galaxy, then it cannot be an ordinary field galaxy. The small separation between the lensed images (04) requires the lensing galaxy to be either a low-mass low-redshift galaxy or a massive high-redshift galaxy in order not to split the lensed images too far apart. However, neither type of galaxy with a normal mass-to-light ratio could produce such a bright apparent magnitude as mag. More quantitatively, inserting 2 in equation (2), we obtain possible combinations of the lensing galaxy redshift and velocity dispersion as (0.5, 100), (1, 120), (2, 170), and (3, 280). To illustrate how much the lensing galaxy must be overluminous, if we take an L∗ galaxy (i.e., km/s) as the lens, it implies that , but the expected observed magnitude of such a galaxy would be mag. Therefore, it requires such a lensing galaxy to be overluminous by more than five magnitudes. Together with the evidence that component C is point-like, this would require that component C is a luminous AGN/QSO nucleus of the lensing galaxy. Although such a QSO–AGN/QSO gravitational lensing may happen (Gott & Gunn 1974), the probability for such an event is in general very small.
4.4.2 Dark Ly-forest line cores
The high-resolution Keck HIRES spectrum of APM 08279+5255 (Ellison et al. 1999a ; Ellison et al. 1999b ) shows no residual flux in the core of strong Ly forest lines up to an observed wavelength of 5715 Å. If component C is a lower-redshift AGN/QSO, its continuum flux should easily be detectable in the core of these strong Ly lines, given the high signal-to-noise ratio of this HIRES spectrum. This means that if component C is an AGN/QSO, its redshift must be larger than 3.7, and it seems rather contrived if a QSO is gravitationally lensed by another QSO system at .
4.4.3 Color
As already mentioned in the discussion of differential reddening, components A, B, and C have almost identical colors from 1.1 m to 12.5 m. This is easy to understand if component C is also a lensed image of the same background source.
Based on these arguments, we conclude that component C is a third lensed image of the QSO. Therefore, we investigate the intrinsic properties of APM 08279+5255 based on the three-image model, although in the end this question can be settled with spectroscopy of component C. If, however, the two-image model is correct, its consequences are easy to derive because this model is not sensitive to differential magnification: the magnification factor is 7-10 over the relevant spectral range, and therefore APM 08279+5255 must be an extremely luminous object with the intrinsic bolometric luminosity L⊙. Also, the shape of the intrinsic SED must be close to what is observed.
4.5 Differential Magnification
In this section, we discuss the consequences for differential magnification of our preferred three-image model. Unlike the two-image model, the magnification factor of the three-image model is sensitive to the source size (Figure 9). Therefore, the effects of differential magnification must be evaluated before the intrinsic properties of the lensed QSO can be discussed. For the discussions below, references are made with respect to the restframe wavelength of APM 08279+5255.
4.5.1 Magnification in the Restframe UV/Optical
The fact that three lensed images are completely point-like in the restframe band (observer’s band) sets the upper limit of 20 pc on the source radius. If the source radius were larger than 20 pc, we should see the effects of image elongation seen in Figure 7a. In the restframe UV, the source size is expected to be either comparable to or smaller than that in the restframe optical. From Figure 9, it can be seen that the magnification factor corresponding to this range of source size is 90, which is same as the value derived by Ibata et al. (1999).
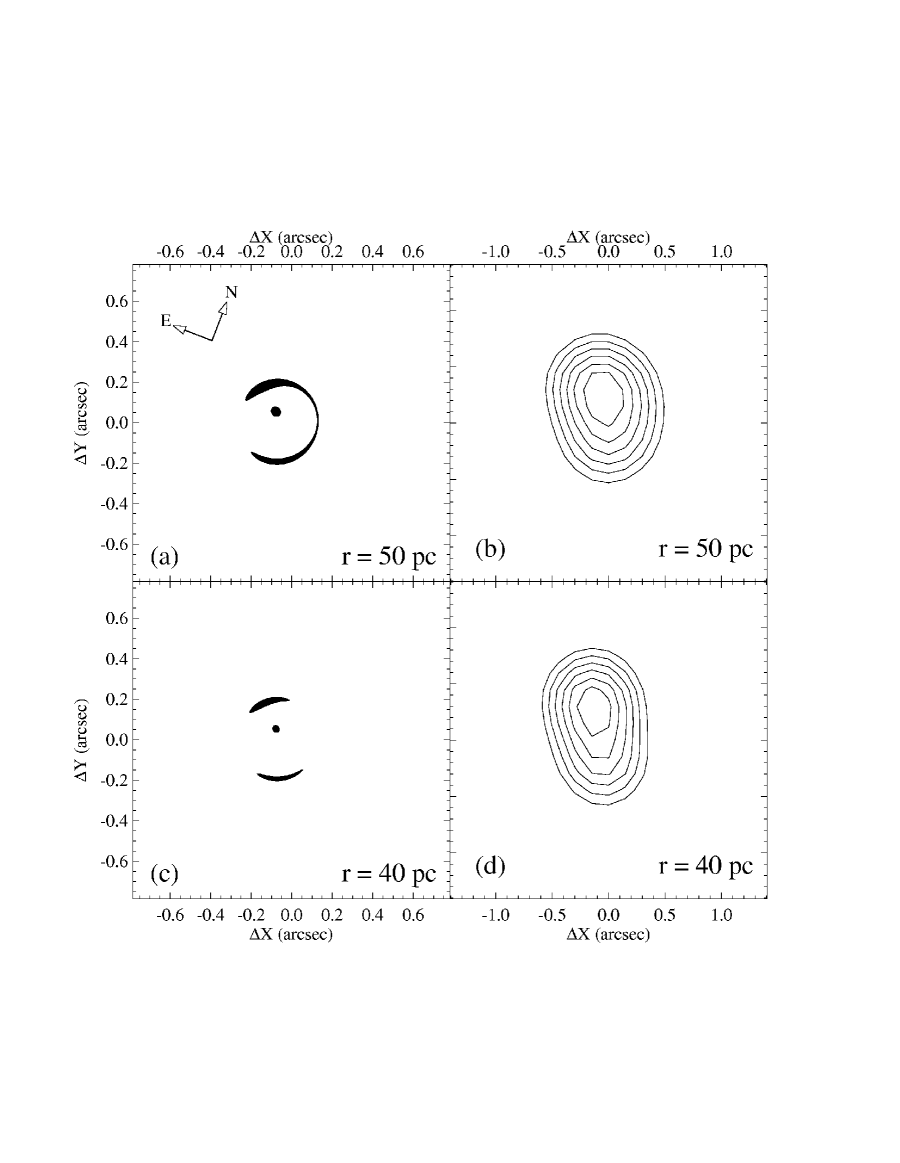
4.5.2 Magnification in the Restframe Near-IR
Since the spatial resolution of the restframe near-IR (observed 12.5 m) image is not high enough to detect the morphology of each component, it is not possible to set as stringent a limit on the source radius as in the restframe optical. As seen in Figure 7, once the source radius reaches 50 pc, components A and B will connect with each other and form an arc, and this would produce a lower ellipticity in the resultant image (Figure 10). However, this has not been seen in Figure 3a and c. Based on the overall ellipticity of the restframe near-IR image, we conclude that the source radius in the restframe near-IR (observer’s 12.5 m) must be less than 50 pc, which corresponds to a magnification factor of 90–120 (Figure 9).
4.5.3 Magnification in the Restframe Mid-IR
There exists no high-resolution spatial information in the restframe mid-IR (observer’s far-IR) which can be used to determine the magnification factor directly. However, it is possible to put constraints on the magnification factor based on the restframe mid-IR luminosity.
With the assumption that the mid-IR emitting region is intrinsically a circular disk on the sky with a constant specific intensity, the mid-IR SED can be modeled with the following expression:
| (3) |
Here, is the magnification factor, is the dust emissivity, is the Planck function evaluated at the emitted frequency, is the dust temperature, is the redshift of the background source, and is the intrinsic radius of the emitting region. The Planck function is evaluated at the emitted frequency () while the observed flux density is expressed at the observed frequency (; ).
As the dust temperature, we adopt the CO gas temperature of 200 K derived by Downes et al. (1999) from the ratio of the CO (4–3) and (9–8) lines. If this 200 K region is strongly magnified, the dust global temperature could be much lower than 200 K, but it does not affect our discussion here because dust at a temperature significantly below 200 K would not provide a significant flux in the restframe mid-IR.
Only specific combinations of and are allowed by the lens model (Figure 9). For each allowed combination, the corresponding value of is determined such that equation (3) reproduces the observed IRAS 100 m flux. Since 100 m is close to the peak of a 200 K blackbody at a redshift of 3.91, the value of essentially scales the total energy output of such a blackbody. Therefore, its value can be regarded as equivalent to that of the Planck-averaged dust emissivity (Draine & Lee 1984).
As long as the dust emissivity is larger than 0.03, it is always possible to find a set of a source radius and a magnification factor which reproduces the observed 100 m flux. However, the emissivity cannot be smaller than this because the intrinsic source size would become larger than 03, which would produce a gravitationally magnified image with a diameter 1″, roughly the upper limit on the millimeter source size set by Downes et al. (1999). A Planck-averaged emissivity of 0.03 is similar to that of astronomical silicate grains with a radius 0.01-1 m at 200 K as found by Draine and Lee (1984).
Depending on the dust emissivity, the magnification factor in the mid-IR could be anywhere between 4 () and 120 (), which corresponds to the source radius of 1.8 kpc and 60 pc, respectively. The case of corresponds to an optically thick source of temperature 200 K. The source radius of the 200 K component becomes larger with a smaller dust emissivity because dust grains can be heated to 200 K at a farther distance from the central source.
4.5.4 Magnification in the Restframe far-IR/submm
The range of possible magnification factors in the restframe far-IR/submm is the same as that in the mid-IR (i.e., 4–120). However, it cannot exceed the magnification factor in the mid-IR since the far-IR/submm emitting region is expected to be larger than the mid-IR emitting region. The magnification factor could be exactly the same in the restframe mid-IR and far-IR/submm if the emission from the 200 K component also dominates in the latter wavelength regime.
Table 4 summarizes the derived magnification factors at different wavebands and the corresponding source sizes. It can be seen that the effects of differential magnification are negligible through the restframe UV, optical, and near-IR while it could potentially be significant in the restframe mid-IR/far-IR/submm.
4.6 Intrinsic Properties
4.6.1 Spectral Energy Distribution
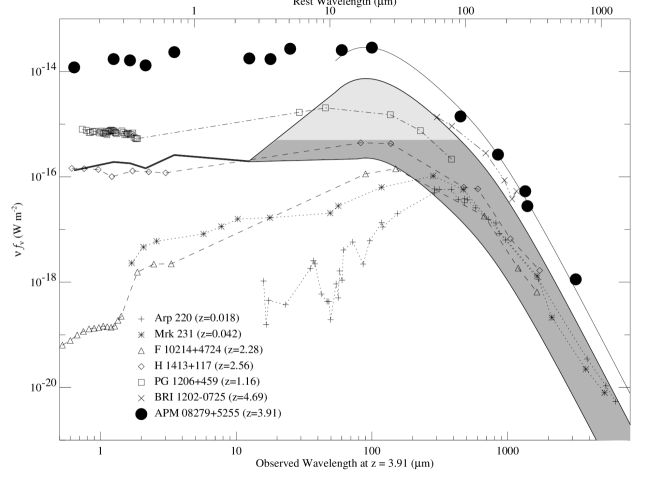
From the restframe visible to near-IR, the magnification factors are estimated to be 100, and the intrinsic SED, basically unaffected by differential magnification, is extremely flat (, Figure 11). On the other hand, in the restframe mid-IR/far-IR/submm, the exact magnification factors are not known. Therefore, we derive instead the possible range of the intrinsic SED allowed by the model.
The allowed range can be calculated based on the fact that the lens model requires the magnification factor to be 4–120 in the restframe mid-IR/far-IR/submm. In Figure 11, we empirically fit the observed SED with the following expression,
| (4) |
where is the optical depth parametrized as,
| (5) |
Here, is set to be 1.5 THz (i.e., 200 m). The possible range of the intrinsic SED (the shaded area in Figure 11) is determined by demagnifying the observed SED fit by factors between 4 and 120. The upper limit corresponds to the case in which the dust emissivity is low (0.03) and therefore the 200 K dust region is large, resulting in a small magnification factor while the lower limit corresponds to the case in which the dust emissivity is unity (i.e., blackbody) and therefore the 200 K region is small, resulting in a large magnification factor.
As seen in Figure 11, in principle the intrinsic SED of APM 08279+5255 could strongly peak at m. However, such an SED is unlikely. If the SED strongly peaks in the restframe mid-IR, the dust covering factor around the central energy source must be large. However, as can be seen in Figure 11, the intrinsic SED is extremely flat at m, which means that our line of sight to the central QSO is relatively dust free. Therefore, if the SED strongly peaks in the mid-IR, it must mean that we are looking into a heavily dust-enshrouded QSO through a relatively transparent hole, which seems unlikely. We believe it more likely that the intrinsic SED is relatively flat up to m and drops at longer wavelengths (dark-shaded region in Figure 11).
4.6.2 Bolometric Luminosity
If we assume that the intrinsic SED is flat up to the restframe mid-IR, the characteristic magnification factor of APM 08279+5255 can be taken as . Therefore, the intrinsic bolometric luminosity is estimated to be . The IR luminosity at m is . Because most of the luminosity is coming out at shorter wavelengths, we can determine the luminosities without knowing the precise shape of the restframe far-IR/submm SED.
4.6.3 Dust Properties
Figure 11 shows that the mid-IR/far-IR/submm SED of APM 08279+5255 is roughly consistent with those of lower-redshift IR-luminous galaxies/QSOs. However, since we cannot constrain the intrinsic SED at m to better than a factor of 10, it is not possible to set meaningful limits on intrinsic properties of this object such as the mass and temperature of dust.
The main sources of uncertainty are the dust emissivity and the effects of differential magnification. As seen in equation (3), the magnification factor is inversely proportional to the dust emissivity. Since the dust emissivity is not well known even in the local universe, this introduces a large uncertainty in the magnification factor, and therefore in the intrinsic luminosity of the dust emission. In addition, there is a possibility that the magnification factor may systematically decrease at longer wavelengths because cooler regions have larger spatial extent (Eisenhardt 1996; Blain 1999). If this is the case, there may exist a cold (e.g., 50 K) massive dust component which is not seen in the observed spectrum due to its small magnification factor. Because of these uncertainties, a self-consistent model can be constructed with a broad range of dust masses () and temperatures (50–200 K).
Figure 11 also illustrates the difficulty of determining dust properties without knowing the exact shape of the mid-IR/far-IR/submm SED. For example, one noticeable feature in the figure is that most of the objects have comparable submillimeter luminosities in spite of the large spread in the bolometric luminosity. This strongly suggests that the dust distribution in these objects are “matter-bounded” (cf. Barvainis et al. 1995): in other words, these objects are likely to have comparable dust masses, and the difference in the IR (m) luminosities is caused by the difference in dust temperature (from 50 K (ULIRGs) to 200 K (PG 1206+459) for the dust component dominating the restframe submm emission). On the other hand, the large submillimeter luminosity of BRI1202-0725 indicates that even if the dust temperature is at 200 K, its dust mass is still as large as those of local ULIRGs, and could be larger by an order of magnitude if the dust temperature is low (e.g., 50 K). The fact that the allowed IR/submm SED range for APM 08279+5255 is broadly consistent with the SEDs of such a variety of objects indicates that with the currently available data, little can be said about the dust mass and temperature of APM 08279+5255.
4.7 The Lensing Galaxy
If the three-image model is correct, there is no observational image that can be associated with the lensing galaxy. The redshift of the lensing galaxy is not determined by the model because the redshift of the lens enters only through the Einstein radius, and this can be produced by a distant massive galaxy or a nearby low-mass galaxy.
The derived core radius of 02 corresponds to a physical length of 1.3–1.6 kpc at a redshift of . A galaxy with a core radius of this size must be a large elliptical-type galaxy with a velocity dispersion of 300 km/s. To be compatible with the derived small Einstein radius, the lensing galaxy must be at a high redshift, probably , although at the moment there is no observational evidence to support this hypothesis. The mass of such a lensing galaxy is calculated to be L⊙ within the Einstein radius of 029. Such a galaxy would not have been detected by any observations to date of this system.
5 SUMMARY AND CONCLUSIONS
We have obtained high-resolution images of APM 08279+5255 in the -band (FWHM 015) and at 12.5 m (FWHM 04). We have constructed a gravitational lens model using the -band image, and determined the magnification factors at longer wavelengths based on the 12.5 m image and other existing data. The basic conclusions are as follows:
-
1.
APM 08279+5255 consists of three components, which are distributed over 04. The third image (component C) is bright ( mag) and compact (FWHM ).
-
2.
Component C could be either a third lensed image (three-image model) or the luminous QSO/AGN nucleus of the lensing galaxy (two-image model). If the three-image model is correct, the magnification factor is high () and the effects of differential magnification could be significant. If the two-image model is correct, the magnification factor is low (), and the effects of differential magnification are negligible. The three-image model is preferred by a number of observational arguments, and therefore we adopt this model to deduce the intrinsic properties.
-
3.
The derived magnification factors for APM 08279+5255 are 90, 90–120, and 4-120 in the restframe UV/optical, near-IR, and mid-IR/far-IR/submillimeter, respectively. The corresponding intrinsic source radii are pc, 50 pc, and 60–1800 pc.
-
4.
By assuming that the intrinsic SED is flat up to m, we estimate an overall magnification factor of . From this, the intrinsic bolometric luminosity of APM 08279+5255 is derived to be . Its intrinsic IR luminosity is . Therefore, APM 08279+5255 is intrinsically luminous, but it is not the most luminous object known.
-
5.
With the currently available data, neither the dust mass nor the dust temperature can be determined due to the uncertainties associated with the dust emissivity and the possible effects of differential magnification.
Acknowledgements.
We thank Drs. Ibata and Lewis for communicating us their results prior to the submission of their paper. E.E. thanks Drs. Chris Fassnacht and Andrew Blain for helpful discussions. The W. M. Keck Observatory is operated as a scientific partnership between the California Institute of Technology, the University of California, and the National Aeronautics and Space Administration. It was made possible by the generous financial support of the W. M. Keck Foundation. Infrared astronomy at Caltech is supported by grants from the NSF and NASA. This research has made use of the NASA/IPAC Extragalactic Database (NED) which is operated by the Jet Propulsion Laboratory, California Institute of Technology, under contract with the National Aeronautics and Space Administration.References
- Barvainis et al. (1995) Barvainis, R., Antonucci, R., Hurt, T., Coleman, P., & Reuter, H.-P. 1995, ApJ, 451, L9
- Benford et al. (1999) Benford, D. J., Cox, P., Omont, A., Phillips, T. G., & McMahon, R. G. 1999, ApJ, 518, L65
- Blain (1999) Blain, A. W. 1999, MNRAS, 304, 669
- Blandford & Kochanek (1987) Blandford, R. D., & Kochanek, C. S. 1987, ApJ, 321, 658
- Downes et al. (1998) Downes, D., Neri, R., Wiklind, T., Wilner, D. J., & Shaver, P. A. 1999, ApJ, 513, L1
- Drain & Lee (1984) Draine, B. T., & Lee, H. M. 1984, ApJ, 285, 89
- Elias (1982) Elias, J. H., Frogel, J. A., Matthews, K., & Neugebauer, G. 1982, AJ, 87, 1029
- (8) Ellison, S. L., Lewis, G. F., Pettini, M., Chaffee, F. H., & Irwin, M. J. 1999a, ApJ, 520, 456
- (9) Ellison, S. L., Lewis, G. F., Pettini, M., Sargent, W. L. W., Chaffee, F. H., Foltz, C. B., Rauch, M., & Irwin, M. J. 1999b, PASP, 111, 946
- Eisenhardt et al. (1996) Eisenhardt, P. R., Armus, L., Hogg, D. W., Soifer, B. T., Neugebauer, G., & Werner, M. W. 1996, ApJ, 461, 72
- Evans et al. (1999) Evans, A. S., Scoville, N. Z., Dinshaw, N., Armus, L., Soifer, B. T., Neugebauer, G., & Rieke, M. 1999, ApJ, 518, 145
- Fukugita et al. (1992) Fukugita, M., Futamase, T., Kasai, M., & Turner, E. L. 1992, ApJ, 393, 3
- Gott & Gunn (1974) Gott, J. R. III, & Gunn, J. E. 1974, ApJ, 190, L105
- Haas et al. (1998) Haas, M., Chini, R., Meisenheimer, K., Stickel, M., Lemke, D., Klaas, U., & Kreysa, E. 1998, ApJ, 503, L109
- Hines et al. (1998) Hines, D. C., Schmidt, G. D., & Smith, P. S. 1999, ApJ, 514, L91
- Ibata et al. (1999) Ibata, R. A., Lewis, G. F., Irwin, M. J., Lehar, J., & Totten, E. J. 1999, AJ, in press
- Isaak et al. (1994) Isaak, K. G., McMahon, R. G., Hills, R. E., & Withington, S. 1994, MNRAS, 269, L28
- IRAS Explanatory Supplement (1988) IRAS Catalogs and Atlases, Vol 1, Explanatory Supplement. 1988, ed. C. A. Beichman, G. Neugebauer, H. J. Habing, P. E. Clegg, & T. J. Chester (Washinton, DC: US GPO)
- Irwin et al. (1998) Irwin, M. J., Ibata, R. A., Lewis, G. F., & Totten, E. J. 1998, ApJ, 505, 529
- Jones et al. (1993) Jones, B., & Puetter, R. C. 1993, Proc. SPIE, 1946, 610
- Klaas et al. (1998) Klaas, U., Haas, M., Heinrichsen, I., & Schulz, B. 1997, A&A, 325, L21
- Kneib et al. (1998) Kneib, J.-P., Alloin, D., Mellier, Y., Guilloteau, S., Barvainis, R., & Antonucci, R. 1998, A&A, 329, 827
- Ledoux et al. (1998) Ledoux, C., Theodore, B., Petitjean, P., Bremer, M. N., Lewis, G. F., Ibata, R. A., Irwin, M. J., & Totten, E. J. 1998, A&A, 339, L77
- Lewis et al. (1998) Lewis, G. F., Chapman, S. C., Ibata, R. A., Irwin, M. J., Totten, D. J. 1998, ApJ, 505, L1
- Matthews & Soifer (1994) Matthews, K., & Soifer, B. T., 1994, in Infrared Astronomy with Arrays, ed. I. McLean (Dordrecht: Kluwer), 239
- Matthews et al. (1996) Matthews, K., Ghez, A. M., Weinberger, A. J., & Neugebauer, G. 1996, PASP, 108, 615
- Narayan & Bartelmann (1999) Narayan, R., & Bartelmann, M. 1999, in Formation of Structure in the Universe, eds. A. Dekel & J. P. Ostriker, (New York: Cambridge Univ. Press), p360
- Neugebauer et al. (1987) Neugebauer, G., Green, R. F., Matthews, K., Schmidt, M., Soifer, B. T., & Bennett, J. 1987, ApJS, 63, 615
- Ressler et al. (1994) Ressler, M. E., Werner, M. W., van Cleve, J., & Choa, H. 1994, Experimental Astronomy, 3, 277
- Rigopoulou et al. (1996) Rigopoulou, D., Lawrence, A., & Rowan-Robinson, M. 1996, MNRAS, 278, 1049
- Sakamoto et al. (1999) Sakamoto, K. Scoville, N. Z., Yun, M. S., Crosas, M., Genzel, R. & Tacconi, L. J. 1999, ApJ, 514, 68
- Sanders et al. (1988) Sanders, D. B., Soifer, B. T., Elias, J. H., Madore, B. F., Matthews, K., Neugebauer, G., & Scoville, N. 1988, ApJ, 325, 74
- Schramm & Kayer (1987) Schramm, T., & Kayer, R. 1987, A&A, 174, 361
- Soifer et al. (1999) Soifer, B. T., Neugebauer, G., Matthews, K., Becklin, E. E., Ressler, M., Werner, M. W., Weinberger, A. J., & Egami, E. 1999, ApJ, 513, 207
- Stetson (1987) Stetson, P. PASP, 99, 191
| Band | Magnitude | Flux density | |
|---|---|---|---|
| (m) | (mag) | (mJy) | |
| 1.25 | J | 13.34 0.03 | 7.19 0.20 |
| 1.65 | H | 12.65 0.03 | 8.97 0.25 |
| 2.15 | Ks | 12.08 0.03 | 9.40 0.26 |
| 3.5 | L′ | 9.90 0.04 | 27.3 1.0 |
| 12.5 | 6.35 0.15 | 74 11 | |
| 17.9 | 5.2 | 103 50 |
| Components | X | Y | Flux ratio | K | /dof | FWHM | ||
|---|---|---|---|---|---|---|---|---|
| A | -0060 | 0377 | 0191 | 0330 | 1.28 | 12.82 | 0.93 | 015 |
| B | 0000 | 0000 | 0000 | 0000 | 1.00 | 13.09 | 0.93 | 015 |
| C | -0002 | 0245 | 0090 | 0228 | 0.26 | 14.55 | 0.92 | 015 |
| Total | 12.08 |
| Parameter | Three-image | Two-image |
|---|---|---|
| Einstein radius () | 029 | 019 |
| Ellipticity () | 0.012 | 0.083 |
| Core radius () | 021 | 0″ |
| Position angle (E of N) | 79 | 100 |
| Lens positionaaThe positions are (, ) from component B. | (0074, 0205) | (0090, 0228) |
| Source positionaaThe positions are (, ) from component B. | (0069, 0196) | (0067, 0184) |
| Magnification for A bbThe magnification factors are for a point source. | 34 | 3 |
| Magnification for B bbThe magnification factors are for a point source. | 43 | 4 |
| Magnification for C bbThe magnification factors are for a point source. | 9 | |
| Total MagnificationbbThe magnification factors are for a point source. | 86 | 7 |
| UV/Optical | Near-IR | Mid-IR/Far-IR/Submm | |
|---|---|---|---|
| Magnification | 90 | 90–120 | 4–120 |
| Source radius (pc) | 20 | 50 | 60–1800 |