Madison WI., 53706
Physical morphology and triggers of starburst galaxies
Abstract
We present a method of determining the likely triggering mechanisms for luminous, nearby starbursts based on their optical asymmetry and (B-V) color – what we term as indices of ‘physical morphology.’ By comparing the starbursts’ locations in a color-asymmetry diagram to an independent, nearby galaxy sample, we identify which starbursts are likely triggered by an interaction/merger. We confirm our morphological interpretation based on a comparison to 20% and 50% HI velocity-width ratios. We further explain how this use of physical morphology can put constraints on the dynamical history of other galaxies, including star-forming galaxies at high redshifts.
Key Words.:
starburst galaxies – high-redshift galaxies – galaxy parameters - color, asymmetry, line widths.1 Introduction
The large number of galaxies at high redshifts () undergoing intense star-formation (Steidel et al. 1996, Lowenthal et al. 1997) suggest starburst galaxies were a dominant phase of early galaxy evolution. While the rate and specific intensity of star formation in these distant galaxies is certainly higher than typical, nearby starbursts (Weedman et al. 1999), local starbursts are similar to star-forming high- galaxies in terms of their structural and stellar characteristics (Giavalisco et al. 1996; Hibbard & Vacca 1997; Heckman et al. 1998; Conselice et al. 2000a).
Related issues include determining how starbursts are triggered, and if the triggering mechanisms change with . Starburst triggering mechanisms include: interactions and mergers (Schweizer 1987; Jog & Das 1992), bar instabilities (Shlosman et al. 1990), and kinematic effects from SNe and stellar winds (e.g. Heckman et al. 1990). While the merging is expected to be more common at earlier epochs, the first epoch of star-formation could occur as a result of the inital collapse of individual gas clouds.
For nearby, luminous galaxies, usually it is possible to determine what triggers a starburst by examining kinematic, and pan-chromatic structural information. This can be quite expensive in telescope time, particularly for high- starbursts, where detailed spectroscopic information is difficult to obtain at present. While some starbursts are undergoing interactions or mergers, it is difficult to quantify the strength and youth of such events. A method of determining starburst triggers based on morphology or other, easily observable properties of a galaxy would be ideal. In this paper we present a method to determine objectively if a starburst is triggered by a galaxy interaction based on its color and -band asymmetry.
2 The Sample and Optical Data
The sample consists of five UV-bright examples of nearby galaxies chosen from a study of northern hemisphere starbursts: Markarian 8, NGC 3310, NGC 3690, NGC 7673, NGC 7678. These galaxies were imaged in several bands with the WIYN 3.5m telescope111The WIYN Observatory is a joint facility of the University of Wisconsin-Madison, Indiana University, Yale University, and the National Optical Astronomy Observatories., located at the Kitt Peak National Observatory, using a 20482-pixel thinned SB2K CCD with a arcmin2 field of view and a scale of 0.2 arcsec per pixel. The seeing during the observations on average was FWHM. The -band images used here are bias subtracted, flat-fielded, and cleared of foreground stars and background galaxies. These contaminating objects typically can cause rather high asymmetries if not properly removed. The (B-V) colors for all galaxies are from the RC3 catalog, except NGC 3690, where we adopt Weedman’s (1973) value.
Each of the starbursts in our sample are benchmarks; i.e. they are relatively well studied and understood.

Markarian 8 hosts an intense starburst, with very blue colors (Huchra 1977). This galaxy contains several distinct ‘pieces’ with visible tidal tails, and has long been recognized as a merger, or a strongly interacting double galaxy (Casini & Heidmann 1976; Keel & van Soest 1992). The interaction/merger between the multiple components of this galaxy are responsible for triggering the star-formation in the disk.
NGC 3310, classified as a barred spiral (RC3), has it’s very young starburst in a 1 kpc diameter ring around the nucleus. The bar and the size of the ringed structure suggest this starburst was triggered by a bar instability (Athanassoula 1992; Piner et al. 1995). Faint outer ripples are evidence for a minor merger or interaction with another galaxy, probably a dwarf (e.g. Balick & Heckman 1981; Schweizer & Seitzer 1988); this plausibly produced the bar instability which led to the starburst.
NGC 3690, along with Markarian 8 are the most extreme interactions/mergers in our sample. The second ‘half’ of NGC 3690 is IC 694 (e.g. Gehrz et al. 1983). There is no disk structure to this galaxy, which is populated by very luminous, high surface-brightness star forming regions (Soifer et al. 1989).
NGC 7673 morphologically consists of an inner disturbed spiral structure, faint outer ripples (Homeier & Gallagher 1999), and huge, blue star-forming clumps embedded in a disturbed H I disk (Nordgren et al. 1997). These features are clues that this galaxy recently interacted with another galaxy, triggering the starburst.
NGC 7678, classified as a barred spiral, contains a starburst located in a roughly symmetrical spiral pattern, similar to NGC 3310. This starburst consists of several bright H II regions (Goncalves et al. 1998) and contains a Seyfert nucleus (Kazarian 1993). NGC 7678 contains a large, massive blue arm where much of the starburst is located (Vorontsov-Velyaminov 1977).
Most of these galaxies show evidence for an interaction, but in various degrees and intensities. NGC 3310, NGC 7678 are probably minor mergers, or interactions that occurred in the distant past, while NGC 3690, NGC 7673, and Markarian 8 are obvious collisions that contain very disturbed structures.
3 Asymmetry
The asymmetry method used here, described in detail by Conselice, Bershady & Jangren (2000), gives a simple, quantified measure of how a galaxy deviates from perfect axi-symmetry. Like Abraham et al. (1996), our algorithm consists of rotating a galaxy 180about a center, subtracting the rotated image from the original, and dividing the sum of the absolute value of the pixels in the residual image by the sum of pixel values in the original image. The higher the intensity of the residuals, the larger the asymmetry. In our implementation, however, (a) we repeat the asymmetry computation using different center estimates until a minimum asymmetry is found, and (b) we make a correction for noise.
The rotational asymmetry of normal galaxies increases with the ‘lateness’ of their morphological type (Conselice, 1997), indicating that at least some component of their asymmetry is associated with the flocculent appearance of star-formation within galaxies. Asymmetry may also arise, however, from large-scale, dynamical perturbations. Other methods of asymmetry measurement (e.g. Zaritsky & Rix, 1997; Kornreich, Haynes, & Lovelace, 1998) are particularly sensitive to this dynamical component. In contrast, our rotational measurement is sensitive to both dynamical and flocculent components of asymmetry. As we show in the next section, interacting and irregular galaxies can be distinguished on the basis of the relative amplitudes of these two asymmetry components via the color-asymmetry diagram. Asymmetry is a powerful quantitative morphological parameter, and in conjunction with the color of a galaxy, it can be used to determine the physical nature of a galaxy.

4 The Color-Asymmetry Diagram (CAD)
The CAD for a sample of 113 nearby galaxies (Frei et al. 1996; Conselice et al. 2000b) and the starburst sample is shown in Figure 1. A correlation between asymmetry and color can be seen for most Hubble types: Early type galaxies (E, S0) populate the symmetric, red corner of the diagram; later type galaxies become progressively bluer and more asymmetric. This ‘fiducial’ trend with Hubble type is indicated by the dashed line in Figure 1. Some objects do not lie on the fiducial color-asymmetry sequence. Most of these are highly-inclined systems, as discussed by Conselice et al. 2000b. However, visual inspection of the most extreme outliers at blue colors of B-V0.7 (i.e., NGC 3079, Arp 18, and NGC 4254) indicates they are are too asymmetric for their colors because they are dynamically disturbed. It appears to be possible to distinguish if a galaxy is interacting or merely undergoing normal star formation (such as irregular galaxies) based simply on its position in the CAD.
Where do the starbursts lie in the CAD? Their CAD positions are mostly consistent with a strong interaction, or merger origin (Figure 1, ). Moreover, the amount of deviation from the fiducial galaxy sequence appears to be correlated roughly with the degree of interaction/merger. For example, NGC 3690 and Markarian 8 are major mergers between galaxies of similar sizes, and have two of the most deviant positions. NGC 3310, on the other hand, almost fits along the fiducial galaxy sequence; this starburst is believed to be produced by a bar instability or minor interaction (Conselice et al. 2000a). The fact that NGC 3310 does not fit exactly along this sequence is probably due to the fact that it was involved with a minor merger in the past (Balik & Heckman 1981).
We can quantify and test our interpretation of the CAD by comparing a starbursts deviance in the CAD with a kinematic indicator of deviance. A variety of HI studies show that interacting galaxies often have unusual and asymmetric global HI emission line profiles, often with extended velocity tails (e.g., Gallagher, Knapp, & Faber 1981, Bushouse 1987, Mirabel & Sanders 1988, Sancisi 1997). Here we introduce the use of the ratio of HI line-width at 20% and 50% maximum, as extracted from the Lyon-Meudon Extragalactic Database (LEDA) as a new dynamical indicator. High values of W20 / W50 imply shallower rising HI profiles or wings, and hence should be an indicator of a recent dynamical disturbance.
As Figure 2 shows, this line-width ratio is large for the starburst galaxies with asymmetries that deviate from the fiducial sequence. Galaxies shown by the color-asymmetry digram to be strongly interacting or merging, namely NGC 7673, NGC 3690 and Markarian 8, all have the largest HI line width ratios. NGC 3310 and NGC 7678, which have symmetric inner spiral structures and are probably older starbursts perhaps triggered by bar instabilities, have smaller line-width ratios and are less deviant from the fiducial sequence in color and asymmetry. Hence our interpretation of starburst origin based on the color-asymmetry diagram is corroborated.
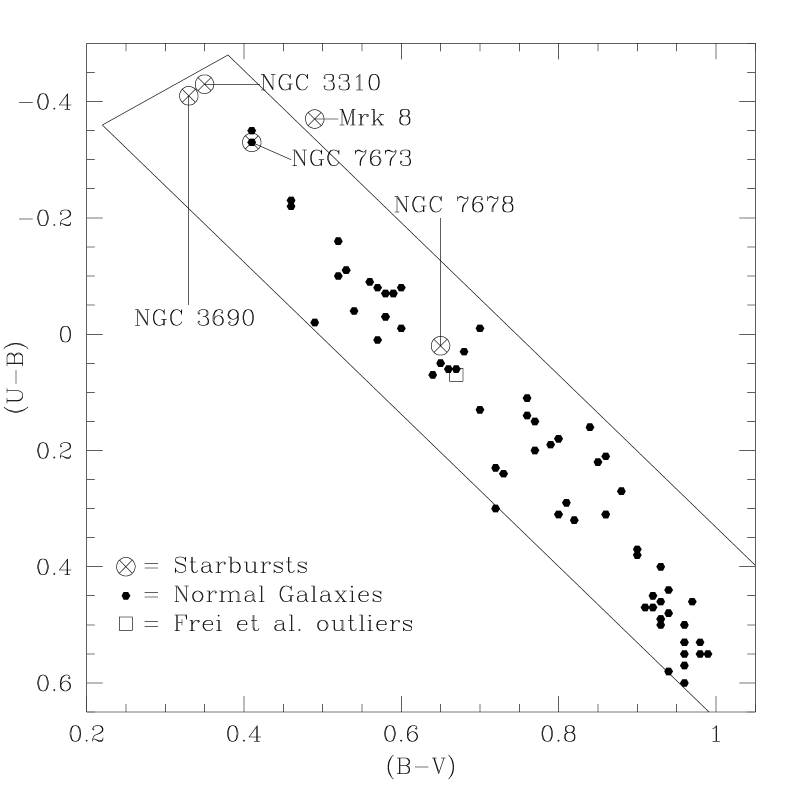
Finally, we note that the starburst galaxies with high asymmetries have blue UBV colors (Figure 3), but do not lie outside the range for normal galaxies (rectangle, Figure 3, adopted from Huchra, 1977). Larson and Tinsley (1978) showed that galaxies with tidal features, such as tidal tails, had a large scatter on a UBV color-color plots. This is not evident for our small sample, which indicates that the color-asymmetry method is more sensitive to identifying merger-induced starbursts than colors alone.
5 Implications for High-Redshift Galaxies
The origins and triggering mechanisms of the increasingly abundant and luminous starbursts observed at intermediate and high are still an issue of debate. Merging is invoked as a likely candidate for triggering because the physical volume of the universe decreases at earlier times, however this has not been demonstrated directly. The physical-morphological method outlined in this paper can be used to determine if merging is indeed the culprit. If these star-forming galaxies at high are triggered by interactions/mergers then their positions in the CAD would be similar those for the starbursts presented in this paper. If the interactions/mergers are minor, then their locations would fall near the normal galaxy fiducial sequence, similar to NGC 3310.
In principle, the high resolution of the Hubble Space Telescope allows detailed morphological studies of distant galaxies. For example, asymmetry has previously been used in conjunction with the concentration of light for galaxies in the Hubble Deep Field (Abraham et al. 1996) and other WFPC-2 images (Jangren et al. 1999). The method used to compute the asymmetries in Abraham et al.’s study differ in several important respects from the method used here and by Jangren et al. In particular, Conselice et al. (2000b) demonstrated that high angular resolution ( 0.1 arcsec FWHM) is critical for the study of distant galaxy asymmetry. While deep NICMOS images of the Hubble Deep Field allow an unprecedented opportunity to study the rest frame optical morphology of high- galaxies, adaptive optics on large, ground-based telescope or the Next Generation Space Telescope may ultimately prove critical for the study of asymmetries in distant galaxies.
6 Conclusions
In this letter we have demonstrated a morphological method of deciphering the triggering mechanisms of starbursts galaxies through the use of a color-asymmetry diagram. Based on a sample of nearby starbursts, we have demonstrated that those starbursts generally regarded as triggered by interactions or mergers are located in a special region of CAD characterized by large optical asymmetry at a given color. In contrast, the two starbursts in our sample (NGC 3310 and NGC 7678) that are probably not triggered from a major interaction/merger fall nearly on the fiducial color-asymmetry sequence of normal galaxies.
While our sample is small, we suggest that the color-asymmetry diagram can be used to separate starbursts triggered by mergers/interactions from those triggered from other causes. We confirm this interpretation by comparing the degree of deviation from the fiducial color-asymmetry sequence to HI line-width ratios, which serves as a dynamical indicator of strong gravitational interactions. This physical-morphological method is quantitative and appears to be superior to analyses of outliers in, e.g., two-color plots such as and . This physical-morphological method is also well-suited for studying the nature and evolution of distant galaxies where it is difficult to gather information beyond images, magnitudes, and redshifts.
This work was funded by NASA contract WAS7-1260 to JPL; AR7539, AR7518 and GO7875, and GO7339 from STScI which is operated by AURA, Inc. under NASA contract NAS5-26555; NASA LTSA contract NAG5-6032; and NSF contract AST-9970780. JSG and CJC thank the WFPC-2 team.
References
- (1) Abraham, R.G., Tanvir, N.R., Santiago, B.X., Ellis, R.S., Glazebrook, K., & van den Bergh, S., 1996, MNRAS 297L, 47
- (2) Athanassoula, E., 1992, MNRAS 259, 345
- (3) Balick, B., & Heckman, T., 1981, A&A 96, 271
- (4) H. 1987, ApJ, 320, 49
- (5) Casini, C., & Heidmann, J., 1976, A&A 47, 371
- (6) Conselice, C.J., 1997, PASP 107, 1251
- (7) Conselice, C.J., Gallagher, J.S., Calzetti, D., Homeier, N.L., & Kinney, A., 2000a, AJ, in press.
- (8) Conselice, C.J., Bershady, M.A., Jangren, A., 2000b, ApJ, in press.
- (9) Frei, Z., Guhathakurta, P., Gunn, J.E., & Tyson, J.A., 1996, AJ, 111, 174
- (10) Gallagher, J.S., Knapp, G.R., & Faber, S.M., 1981, AJ, 86, 1781
- (11) Gehrz, R.D., Sramek, R.A., & Weedman, D.W., 1983, ApJ 267, 551
- (12) Giavalisco, M., Livio, M., Bohlin, R.C., Macchetto, F.D. & Stecher, T.P., 1996, AJ 112, 369
- (13) Goncalves, A.C., Veron, P., & Veron-Cetty, M.-P., 1998, A&AS 127, 107
- (14) Heckman, T.M., Armus, L., Miley, G.K., 1990, ApJS 74, 833
- (15) Heckman, T.M., Carmelle, R., Leitherer, C., Garnett, D.R. & van der Rydt, F., 1998, ApJ 503, 646
- (16) Hibbard, J.E., & Vacca, W.D., 1997, AJ 114, 1741
- (17) Homeier, N.L., & Gallagher, J.S., 1999, ApJ, 522, 199
- (18) Huchra, J.P., 1977, ApJ 217, 928
- (19) Kazarian, M.A., 1993, Afz, 36, 353
- (20) Keel, W.C., & van Soest, E.T.M., 1992, A&AS 94, 553
- (21) Jangren, A., Bershady, M.A., Conselice, C.J., 2000, AJ, submitted
- (22) Jog, C.J. & Das, M., 1992, ApJ 400, 476
- (23) Kornreich, D.A., Haynes, M.P., & Lovelace, R.V.E, AJ, 116, 2154
- (24) Larson, R.B., & Tinsley, B.M., 1978, ApJ, 219, 46L
- (25) Lowenthal et al. 1997 ApJ, 481, 673L
- (26) Mirabel, I. F., Sanders, D. B. 1988, ApJ, 335, 104
- (27) Nordgren, T.E., Chengalur, J.N., Salpeter, E.E., & Terzian, Y., 1997, AJ 114, 77
- (28) Piner, B.G., Stone, J.M., & Teuben, P.J., 1995, ApJ 449, 508
- (29) Sancisi, R. 1997, in Galaxy Interactions at Low and High Redshift, IAU Symposium 186, p24
- (30) Schweizer, F., 1987 in “Nearly Normal Galaxies”, New York, Springer-Verlag, 18
- (31) Schweizer, F., & Seizer, P., 1988 328, 88
- (32) Shlosman, I., Begelman, M.C., & Frank, J., 1990, Nature 345, 679
- (33) Soifer, B.T., Boehmer, L., Neugebauer, G., & Sanders, D.B., 1989, AJ, 98, 766
- (34) Steidel, C.S., Giavalisco, M., Pettini, M., Dickinson, M., & Adelberger, K.L., ApJ, 1996, 462L, 17
- (35) Vorontsov-Velyaminov, B.A., 1977, A&AS 28, 1
- (36) Weedman, D.W., 1973, ApJ, 183, 29
- (37) Weedman, D.W., Wolovitz, J.B., Bershady, M.A., & Schneider, D.P., 1998, AJ 116, 1643
- (38) Zaritsky, D., Rix, H.-W., 1997, ApJ, 477, 118