Formation of Primordial Galaxies under UV background Radiation
Abstract
The pancake collapse of pregalactic clouds under UV background radiation is explored with a one-dimensional sheet model. Here, attention is concentrated on elucidating the basic physics on the thermal evolution of pregalactic clouds exposed to diffuse UV radiation. So, we treat accurately the radiation transfer for the ionizing photons, with solving chemical reactions regarding hydrogen molecules as well as atoms. The self-shielding against UV radiation by H2 Lyman-Werner bands, which regulates the photo-dissociation of hydrogen molecules, is also taken into account. As a result, it is found that when the UV background radiation is at a level of , the cloud evolution bifurcates with a critical mass as , where is the final collapse epoch. A cloud more massive than cools below K due to H2 line emission at the pancake collapse and would undergo the initial starburst. The pancake possibly evolves into a virialized system in a dissipationless fashion. Consequently, this leads to the dissipationless galaxy formation at . A cloud less massive than cannot cool by H2 emission shortly after the pancake collapse, but could cool in the course of shrinking to the rotation barrier. This is likely to lead to the dissipational galaxy formation at relatively low redshifts as . The present results provide a solid physical mechanism which controls the star formation efficiency in the pregalactic clouds. In the context of a standard CDM cosmology, lies between 1 and 2 density fluctuations.
keywords:
galaxies: formation — radiation transfer — shock heating — molecular processes1 INTRODUCTION
It has been widely accepted that the formation of the first generation of objects, say Pop III objects, is regulated by the cooling by primordial hydrogen molecules. A number of authors have explored the formation of Pop III objects in so-called ’dark age’ () by concentrating on the role of hydrogen molecules (Matsuda, Sato, & Takeda 1965; Yoneyama 1972; Hutchins 1976; Carlberg 1981; Palla, Salpeter, & Stahler 1983; Susa, Uehara, & Nishi 1996; Uehara et al. 1996; Annonis & Norman 1996; Tegmark et al. 1997; Nakamura & Umemura 1999). Also, even if the gas contains metals, the metallic line cooling is overwhelmed by the hydrogen/helium cooling at K when the metallicity is lower than (Böhringer & Hensler 1989). In fact, recently the metal abundance in the intergalactic space is inferred to be at a level of (Cowie et al. 1995; Songaila & Cowie 1996; Songaila 1997; Cowie & Songaila 1998). Moreover, at lower temperature of K, the cooling is estimated to be still predominant as long as the metallicity is lower than , from the comparison of the cooling of the solar abundance gas (Spitzer 1978) with the maximal cooling (Kang & Shapiro 1992). Hence, hydrogen molecules are likely to play a fundamental role on the formation of galaxies under the metal poor environment.
In addition, there seem to be situations where UV background radiation significantly influences the dynamical as well as thermal evolution of pregalactic clouds. At the epochs of , the existence of UV background of at the Lyman limit is inferred from so-called proximity effect of Ly forest (Bajtlik, Duncan, & Ostriker 1988; Giallongo et al. 1996). Also, the Gunn-Peterson optical depths show that the intergalactic space was in fact highly ionized (Gunn & Peterson 1965; Schneider, Schmidt, & Gunn 1989, 1991). The UV background is attributed to the radiation from quasars and partially from young galaxies (e.g. Giallongo et al. 1996). Even in the dark age of the universe, say , the first generation of objects as well as unseen proto-quasars might be external photoionization sources for subsequently collapsing objects. So far, many authors have considered the dynamical effects produced by the UV background radiation (Umemura & Ikeuchi 1984; Dekel & Rees 1987; Babul & Rees 1992; Efstathiou 1992; Chiba & Nath 1994; Thoul & Weinberg 1996; Quinn, Katz, & Efstathiou 1996; Navarro & Steinmetz 1997), to account for Ly clouds or to reconcile the paradox that in the hierarchical clustering paradigm for galaxy formation, low mass galaxies are overproduced compared with observations (White & Frenk 1991; Kauffman, White, & Guiderdoni 1993; Cole et al. 1994). The simulations have been hitherto based upon the assumption that the medium is optically thin against UV photons. However, the gas clouds become optically thick as the gravitational collapse proceeds. The significance of the optical depth has been stressed by the accurate treatment on radiative transfer (Tajiri & Umemura 1998).
The primary effects of UV radiation are photoionization, UV heating, and photo-dissociation of [Haiman, Rees, & Loeb 1996 (hereafter HRL), 1997; Corbelli, Galli, & Palla 1997; Kepner, Babul, & Spergel 1997]. HRL, with including radiation transfer effects in one-zone clouds, estimated the UV heating rate and the cooling rate under the assumption of the chemical equilibrium. They found that the cooling rate can exceed the heating rate at for high density. However, basically the chemical reactions regarding formation are not in equilibrium (e.g. Susa et al. 1998; Bertoldi & Draine 1996; Diaz-Miller, Franco & Shore 1998; Hollenbach & Tielens 1999). In particular, if ionization processes such as shock heating or photoionization take place, the chemical processes become out of equilibrium (e.g. Shapiro & Kang 1987). Thus, the non-equilibrium process for the formation of should be involved, coupled with hydrodynamical process.
In this paper, we re-examine the thermal and dynamical evolution of pregalactic clouds under UV background radiation. In the present analysis, we solve properly the radiative transfer of diffuse UV photons and include non-equilibrium chemical reactions regarding formation due to shock-ionization and photoionization. The goal is to elucidate the key physics on the effects of the UV background radiation upon the thermal evolution of pregalactic clouds. For the purpose, we make the dynamical model as simple as possible. A cosmological density perturbation far beyond the Jeans scale forms a flat pancake-like disk. Although the pancake formation is originally studied by Zel’dovich (1970) in the context of the adiabatic fluctuations in baryon or hot dark matter-dominated universes, recent numerical simulations have shown that such pancake structures also emerge in a CDM cosmology (e.g., Cen et al. 1994). Thus, the pancakes are thought to be a ubiquitous feature in gravitational instability scenarios. Here, we consider pancakes in the plane-parallel symmetry. Also, previous 1D/2D/3D simulations on the pancake collapse in a dark matter-dominated universe show that the pancake is finally dominated by baryons after the caustics (Shapiro, Struck-Marcell, & Melott 1983; Bond et al.1984; Shapiro & Struck-Marcell 1985; Yuan, Centrella, & Norman 1991; Umemura 1993; Cen et al. 1994; Miralda-Escude & Rees 1994; Hernquist et al. 1995; Zhang, Anninos, & Norman 1995; Anninos & Norman 1996). The presence of dark matter increases the shock velocity of the falling matter into the caustics. According to previous analyses (e.g. Shapiro & Kang 1987), such shocks change the thermal evolution in the absence of a UV background when the temperature exceeds K since the temperature controls H2 fraction in the postshock regions. However, under UV background radiation, the difference of shock velocity will not alter the results significantly, because the sheets are initially ionized by UV radiation and therefore quickly heated up to K. Thus, the thermal evolution of shocked region will be rather similar for any infall velocity, regardless of the shock temperature. Thus, in order to highlight the relevant physics of thermal processes, we deliberately exclude the dark matter contribution. Nonetheless, some dynamical effects are anticipated from dark matter, e.g. Jeans instability. They are discussed later in the light of the present results.
In section 2, we describe the basic equations and initial conditions. In section 3, the numerical results are presented. In section 4, we make the physical interpretation of numerical results and present the condition on the cooling of a collapsing pancake. Section 5 is devoted to the implications for galaxy formation under UV background radiation. In the last section, we summarize the results.
2 Formulation
2.1 Basic Equations
In this section, we give the basic equations for hydrodynamical calculations. We assume the plane-parallel symmetry throughout this paper. A set of the ordinary hydrodynamical equations is given as below.
| (1) | |||||
| (2) | |||||
| (3) |
where , and denote the density, the thermal pressure, the velocity, and the length measured from the mid-plane, respectively, and is the total energy per unit mass,
| (4) |
is the column density,
| (5) |
and is the gravitational acceleration,
| (6) |
The symbol denotes the cooling rate minus heating rate per unit mass due to the radiative and chemical processes of i-th species. We take H2 cooling rate from Hollenbach & Mckee (1979), and the other atomic cooling rates are the same as those in Shapiro & Kang (1987), except the cooling rate concerning on helium. Photoheating rate is calculated by taking into account the radiation transfer effects. The formulation is given in Appendix A. The equation of state is assumed as , where denote the Boltzman constant, and is the mean molecular weight of the five species discussed below in this section. The hydrodynamical equations are solved by the Piecewise Parabolic Method (PPM) described in Colella & Woodward (1984). PPM is one of the accurate methods to resolve the strong shock front. We take typically 800 spatial Lagrange grids. The hydrodynamical routine is tested by the Sod’s problem. This code resolves the shock front typically by a few mesh.
In the equations (1), (2), and (3), the cosmic expansion is neglected. It is because we have considered the massive clouds far beyond the Jeans scale () and also postulated that the initial stage is close to the maximum expansion for a density fluctuation. The effects of the cosmic expansion could be important for a density perturbation near the Jeans scale, since the temperature is raised up to K by UV background radiation in spite of the expansion and consequently the dynamics could be significantly influenced by the UV heating (e.g. Umemura & Ikeuchi 1984). However, far beyond the Jeans scale, the thermal pressure of gas around K anyway does not affect the dynamical evolution until the maximum expansion as shown by previous calculations (e.g. Thoul & Weinberg 1996). Therefore, we attempt to pursue the history after the maximum expansion.
The hydrodynamical equations are coupled with the non-equilibrium rate equations for chemical reactions:
| (7) |
where is the fraction of i-th species, , with being the number density of hydrogen nuclei, and ’s are the coefficients of reaction rates (see Table 1). In the present calculations, we take into account six species e, H, H+, H-, H2, and H. Here, we neglect helium. This is because the helium lines are not an effective coolant for lower temperature ( K) in which we are here especially interested. Nonetheless, some of helium lines including recombination lines may affect the ionization structure, because they are energetic enough to ionize HI. However, according to Osterborck (1989), the difference between the ionization structure of pure hydrogen and hydrogen + helium gas for 40000 K black body radiation is small. In the case of the power-law spectrum of UV background radiation which we consider, the difference could be larger, because the higher energy photons contribute more to the ionization of helium compared to the case of black body radiation. In fact, in the recent calculation by Abel & Haehnelt (1999), in which the radiation transfer effects of helium recombination photons are taken into account, the temperature of the clouds could differ by a factor of 2. Although we have dismissed helium to focus upon elucidating the key physics, we should keep in mind that helium could be important in highly quantitative arguments.
The photoionization and heating processes due to the external UV radiation are pursued by solving the frequency-dependent radiative transfer equation for hydrogen,
| (8) |
where , , and denote the direction cosine, the absorption coefficient, and the emissivity, respectively. The frequency-integration in the transfer equation can be done analytically for the continuum, while the recombination line near the Lyman limit is separately treated by solving transfer equation with a source term which comes from the recombination. The details are described in Appendix A. Equation (8) assumes steadiness of the radiation fields. When a neutral cloud is exposed to background ionizing radiation, ionized regions spread inward. In the ionized regions, the radiation propagates basically at the light speed, which is typically times larger than the hydrodynamical velocity of the system. Thus, as for the radiation fields, it is sufficient to solve the steady radiative transfer equation. But, the ionization front propagates with a different speed, which is determined by the balance between the number of neutral atoms flowing through the front per second and the corresponding number of ionizing photons reaching the front. Resultantly, the speed of ionization front is much lower than the light speed, typically 500 km s-1 for UV background of . In order to capture the ionization front propagation, we take the following numerical procedures. First, the steady radiative transfer equation (8) is solved, where typically 800 spatial grids are used, which number is equivalent to the number of Lagrange meshes assigned for hydrodynamics, and 40 angular grids are adopted. We have checked that the resultant accuracy is not significantly changed if we use the larger number of angular grids. The integration of equation (8) is performed with the summation of the exact formal solution in every grid (Stone, Miharas, & Norman 1992). This method is accurate, even if the optical depth of each grid can exceeds unity. Also, the validity of this method is enhanced by the fact that the ionization front is not sharply edged, but fairly dull for a power law of UV radiation (Tajiri & Umemura 1998). For the photons which cause H2 dissociation through the Solomon process (e.g. HRL1996), we employ the self-shielding function given by Draine & Bertoldi (1996), instead of directly solving the radiation transfer equation. Next, the rate equations including photoionization are solved implicitly for a time step which is determined as bellow. Finally, the hydrodynamical equations with the thermal equation is integrated explicitly.
The time step of the calculation is taken as follows:
| (9) |
Here represents the hydrodynamical time, and is employed so that the Courant condition is satisfied. denotes the time scale of gravity, which is defined as , where , , , and represents the pressure, the adiabatic index, the density, and the gravitational acceleration, respectively. and represent local cooling time, and heating time scale, respectively. With these procedures, we have checked the propagation speed of the ionization front defined by the point . In all of our simulations, the I-front propagation speeds are less than 1 percent of the speed of light. Thus, the assumption of the steady radiation transfer is valid.
2.2 Initial Conditions
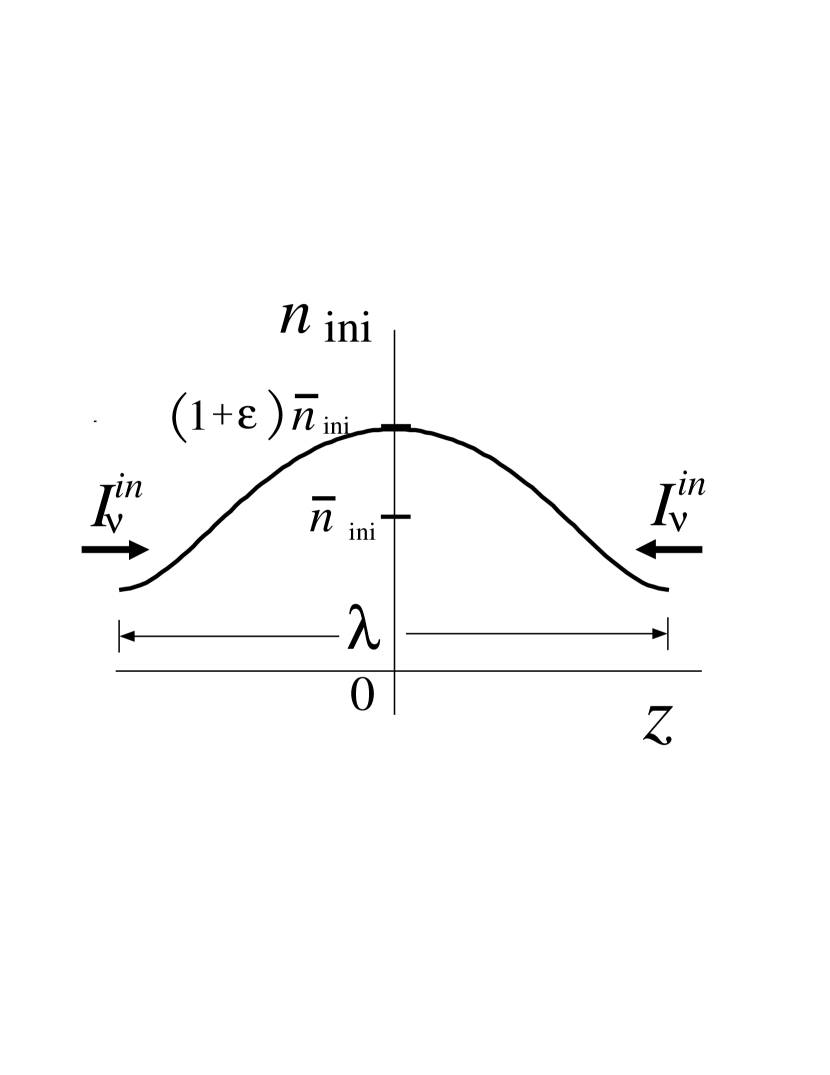
We assume the initial density distributions to have a cosine profile;
| (10) |
where and are the initial mean number density and the thickness of the sheet (See Fig.1), and denotes the density contrast, which is set to be 0.5 throughout this paper. The ranges of and which we consider are respectively and . The initial velocity is null for every mass layer, because the initial stage is implicitly assumed to be close to the maximum expansion stage of a density fluctuation. In general, an overdense region at the maximum expansion is surrounded by an underdense region which is still expanding. Hence, if we introduce the initial velocity distributions more realistically, the further mass may accrete from the underdense region after the pancake collapse. However, the envelope does not seem to contribute to the self-shielding because of its low density, and thus the self-shielding is determined by the column density of the first collapsed sheet. Hence, we neglect the surrounding expanding underdense region, and model only the overdense region. Moreover, the velocity gradient may exist in a collapsing overdense region, and then leads to the delay of mass accretion from outer regions. The degree of self-shielding is determined by the total recombination number per unit time () in the volume against the UV photon number per unit time () from the boundary. If the envelope has a density distribution in proportion to , is proportional to , whereas is constant, as far as the envelope undergoes nearly sheet-like collapse. Thus, an envelope with a distribution steeper than would not contribute to the self-shielding. In other words, the inner regions which collapse nearly simultaneously contribute mainly to the self-shielding. Although there are such qualitative expectations, we cannot assess accurately the effects by the initial velocity gradient and the cosmological expansion, because we have not included them. They should be quantitatively investigated in the future analyses.
The initial temperature and chemical composition are given respectively by the thermal equilibrium and by the ionization equilibrium. Also, the fractions of H2, H- and H are initially determined by the chemical equilibrium. When determining the initial equilibrium state, H2 cooling rate is ignored, because we set the initial condition so that the UV heating should overwhelm the H2 cooling. It will be shown below that this condition can be satisfied even if the cloud is almost neutral.
The incident radiation intensity, , is assumed to have a power low spectrum as
| (11) |
where is the frequency at the Lyman limit. The observations require the diffuse UV radiation to be at a level of at (Bajtlik, Duncan, & Ostriker 1988; Giallongo et al. 1996). At higher redshifts, we have no indication for . Here, we assume , and the scaling to is argued. As for , two typical cases are considered, i.e. or 5, which are the same choice as Thoul & Weinberg (1996). The former represents a quasar-like spectrum, and the latter resembles a spectrum of star-forming galaxies around the Lyman limit frequency.
3 Thermal and Dynamical Evolution
In this section, we show the characteristic behaviors of the thermal/dynamical evolution resulting from numerical runs, and elucidate the dependence of the final states upon the initial states.
3.1 Hard Spectrum Case:
Figures 2 and 3 show the time evolution of spatial distributions of various physical quantities in the case of . Figure 2 represents the case with kpc and cm-3. In this figure, each horizontal axis represents the Lagrange coordinate, normalized by the half total surface density, . The thick line shows the distribution at , where with being the proton mass. The calculations are terminated there. Figure 2 shows that in the course of the collapse, a thin cold sheet quickly forms due to the efficient molecular cooling, which is confined by a shock-heated high temperature layer. The lower panels in Figure 2 show the corresponding HI and H2 distributions. Only an outer envelope () is photoionized and the rest parts of the sheet are self-shielded against UV radiation. As a result, the sheet is mostly neutral throughout the dynamical evolution, excepting the collisionally ionized postshock regions. In the early phase, UV heating exceeds the H2 line cooling even in the almost neutral regions. The H2 cooling becomes efficient as the collapse proceeds to a further degree, and finally the temperature drops down to K. Then, the collisional dissociation of hydrogen molecules becomes ineffective, and thus the fraction of hydrogen molecules at continues to increase.
Figure 3 represents the case with lower density and larger size, i.e., and Mpc. The sheet also collapses because the initial thickness is larger than the initial Jeans length. However, the central temperature does not drop below K, and the resultant H2 fraction is too low to overwhelm the UV heating. Why the evolution results in the different final states from the case shown in Figure 2 is basically understood by the difference of the degree of self-shielding against the external UV radiation. In the previous case, the most regions are so strongly shielded from the external UV that abundant H2 form and the cooling rate due to H2 becomes predominant. Contrastively, in the present case, the external UV permeates the inner regions to a considerable degree, so that UV heating overwhelms H2 cooling everywhere until the collapse stops due to the thermal pressure.
3.2 Soft Spectrum Case:
Figure 4 shows the case of a softer spectrum, . The other initial parameters are the same as Figure 3. Compared to the previous hard spectrum cases, the inner parts of the sheet are quickly self-shielded as the collapse proceeds. This is due to the fact that there are fewer high energy photons which penetrate the deep inside the sheet owing to the smaller ionization cross-section (see e.g. Tajiri & Umemura 1998). As a result, the photoionization rate as well as the UV heating rate damps strongly in the inner regions, so that a cold layer ( K) due to H2 cooling emerges eventually. The self-shielded regions grow thicker and the the fraction of H2 goes up to a level of similar to the case of Figure 2.
3.3 Summary of the Dependence on Initial States
In Figure 5, the final physical states of the sheets for at are summarized on the initial density-to-size diagram. Depending upon the initial thickness and mean density , the sheets evolve in different ways. Filled circles in Figure 5 denote the initial conditions on which the clouds eventually cool below K during the collapse. Open circles denote the ones on which the clouds cannot cool ( K). The boundary of the evolutionary bifurcation is well fitted by a simple power low relation as
| (12) |
The small open squares, open triangles, and filled triangles in Figure 5 trace the evolutionary paths for three typical parameters. In the paths, the time-dependent thickness () is defined by the thickness within which 80% of the total mass of the sheet is contained and the time-dependent mean density () is defined by the spatially averaged density over ;
| (13) | |||||
| (14) |
The open squares and open triangles are respectively the results for the initial parameters of and . For such initial conditions, the sheet shrinks due to Jeans instability []. However, the collapse ceases by the thermal pressure before it intersects the critical line marked by , above which the sheet can be self-shielded and cool down due to formed H2. (The further details on are discussed in the next section.) On the other hand, the filled triangles, corresponding to the run with , come into the regions before the thermal pressure prevents the sheet from collapsing. Consequently, this sheet is shielded and cools below .
Figure 6 shows the dependence on the initial states for . Because of the smaller number of runs, it is somewhat hard to divide clearly the parameter space. If we dare to draw the boundary, it is proportional to , which is numerically
| (15) |
This criterion is slightly different from the previous case, in the sense that for does not cross the intersection point of , although for does.
4 Physical Conditions for H2 Cooling under UV background
In this section, we attempt to understand the underlying physics of the present numerical results. To begin with, we introduce a scale, , which characterizes the relative efficiency of H2 cooling to UV heating. Then, coupled with some physical arguments, we try to estimate the boundary of the bifurcation, , which has been derived by the present numerical calculations.
As a measure of the penetration of UV photons into the cloud, a shielding length, , is defined by the balance between the UV heating rate and the H2 cooling rate, which are respectively
| (16) | |||||
| (17) |
where is the UV heating rate per particle and denotes the H2 cooling function. As shown in Appendix A [eq.(A12)], in an optically thick regime, the UV heating rate is expressed by a power law of the optical depth at the Lyman limit, not by an exponential law. This is again because higher energy photons have the smaller ionization cross-section. The optical depth at the Lyman limit measured from the outer boundary () is
| (18) |
where is the ionization cross-section. If the slab is almost neutral,
| (19) | |||||
| (20) |
Equating (16) with (17) at the midplane of the slab (), and also using equations (20) and (A12), we can assess as
| (21) |
where . The is plotted in Figures 5 and 6 by long-dashed lines. The cooling rate has been assumed to be , which is a maximal value of H2 cooling for the primordial gas that is once heated up to (Shapiro & Kang 1987; Susa et al. 1998).
The obtained represents the degree of self-shielding against the external UV at the initial stages: (1) For , the sheet is promptly self-shielded enough to be cooled by the H2. (2) For , the sheet is not self-shielded initially, so that the gas is heated up to K due to predominant UV heating. A similar argument with is also applicable to each dynamical stage. In the case, we should just replace the density by , and by , both of which are defined in section 3. Then, we interpret as the boundary beyond which the sheet is quickly self-shielded and consequently cools down owing to the efficient formation of H2. In fact, the clouds denoted by filled circles in Figure 5 satisfy the condition before the collapse is abruptly decelerated by approaching . Eventually, the clouds cool down below K. On the other hand, the clouds denoted by open circles above in Figure 5 result in warm sheets of K, because the clouds first meet before intersect . If we assume that the sheet clouds evolve keeping the relation as anticipated in the ideal sheet collapse, the boundary of the bifurcation in the space is expected to be a line which satisfies and meets the intersection point of . This prediction, , is close to the numerically obtained boundary, . The small difference of the dependence may come from the fact that the simulations contain the spatial structure of density and temperature, and therefore partial self-shielding.
We remark that the Jeans length is maximally scaled by in the presence of dark matter, where is the baryon density parameter and is the total density parameter. However, the baryonic component dominates the gravity of the sheets in the final phase of the collapse, although dark matter component does initially. Thus, what actually happens is the intermediate of these two extreme cases. Although calculations that include dark matter are necessary to evaluate the effect quantitatively, we leave them elsewhere.
5 Implications for Galaxy Formation
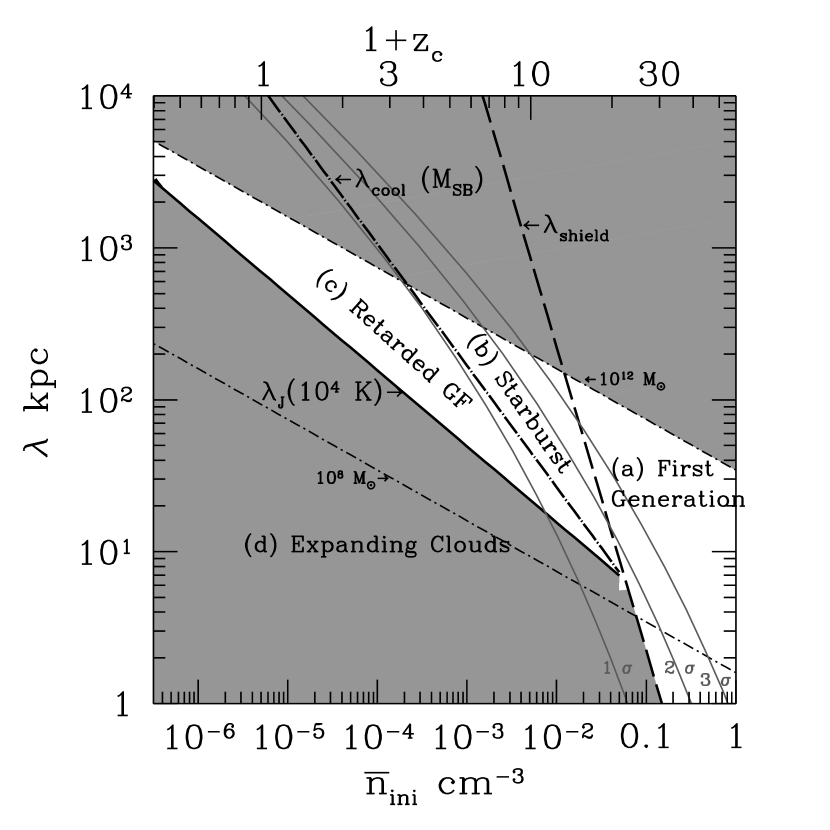
Based upon the present numerical results, we consider the context of the galaxy formation under UV background radiation. First of all, the cooling by atomic processes of primordial gas is essential for the formation of H2 molecules which control the star formation in primordial objects. The elaborate analyses by Rees & Ostriker (1977) and also by Blumenthal et al. (1984) show that the cooling mass is roughly constant almost regardless of the virial temperature and density, which is . If there is UV background radiation, the cooling mass could alter because the line cooling by H and He at K is seriously reduced (e.g. Thoul & Weinberg 1996). The mass, however, is basically determined by the cooling mechanisms at K. At such temperature, the cooling in photoionized gas is dominated by collisional ionization, radiative recombination, and thermal bremsstrahlung, and possibly the Compton cooling at high redshifts. These mechanisms may potentially cool the clouds with down to several K. In fact, it is shown by numerical calculations that the clouds with can cool and collapse under UV background (Umemura & Ikeuchi 1984). Thus, we set here the upper mass of primordial galaxies to be . Then, the evolution of pregalactic clouds under UV background radiation is discriminated into four categories; (a) promptly self-shielded clouds, (b) starburst pancakes, (c) retarded star-forming galaxies, and (d) expanding clouds. In Figure 7, the parameter regions corresponding to the four categories are shown for , with lines of equal mass, say, and . The upper abscissa is the collapse redshifts, , if the initial stage is assumed to be at the maximum expansion of a spherical top-hat density fluctuation. , , and are assumed in order to interpret the maximal expansion density into the collapse redshift , where is the present Hubble constant in units of . In this figure, 1, 2, and 3 density fluctuations expected in a standard CDM are also shown. Some further details for each category are discussed in the following, restricting ourselves to the case .
5.1 Promptly Shielded Clouds
The evolution of promptly self-shielded clouds above is virtually equivalent to the evolution under no UV background radiation. The collapse redshifts of such clouds are expected to be . The formation of primordial objects under no UV background has been hitherto extensively studied by numerous authors (Matsuda, Sato, & Takeda 1965; Yoneyama 1972; Hutchins 1976; Palla, Salpeter, & Stahler 1983; Susa, Uehara, & Nishi 1996; Annonis & Norman 1996; Tegmark et al. 1997). As a result, we can expect the first generation of objects in the mass range of at down toward at (Tegmark et al. 1997).
5.2 Initial Starbursts in Pancakes
The region (b) in Figure 7 results in cold pancakes due to H2 cooling, in which initial starbursts may take place. The instability of a shock-compressed layer has been discussed by several authors (Elmegreen & Elmegreen 1978; Vishniac 1983; Lubow & Pringle 1993; Whitworth et al. 1994; Yamada & Nishi 1998). According to Elmegreen & Elmegreen (1978), the fastest growing modes have the size of the sheet thickness and the fragmentation timescale is where in the high external pressure limit. We estimate the line mass at fragmentation by a condition , where . Under an assumption that cold ( K) sheets fragment into filaments, the resultant line mass is tabulated in Table 2 with other properties, where is the ratio of to the critical line density , and and denote the mass fraction of the shocked matter and cooled matter, respectively. It is noted that is smaller than unity for the fastest growing modes. Hence, for the fragmentation, it is necessary for other growing modes to accumulate further mass so that the filaments would be super-critical. The super-critical filaments would eventually bear massive stars (Nakamura & Umemura 1999).
We can estimate the minimum mass of the starburst pancakes by . Again, if the initial stage is at the maximum expansion, then
| (22) |
The collapse epochs of the clouds in region (b) range from to . The clouds may undergo further shrinking after the sheet-like collapse, because the rotation barrier is smaller by than the maximum expansion size, where is the dimensionless spin parameter which is peaked around 0.05 (Heavens & Peacock 1988). Consequently, the violent relaxation would take place in a collisionless fashion. Hence, the starburst pancakes highly possibly lead to the dissipationless galaxy formation. It is worthy noting that lies between 1 and 2 fluctuations in a standard CDM scenario. Thus, they could form a relatively clustered population of galaxies.
5.3 Retarded Galaxy Formation
The clouds with the smaller mass than cannot cool below K at the first pancake collapse, but they might pass in the course of shrinking down to the rotation barrier, so that the clouds are self-shielded against external UV radiation to cool down by H2 molecules. Assuming , the marginal size, , above which the clouds can pass is much smaller than size of the Jeans unstable clouds for . Thus, no cloud can be stopped by the rotation barrier before the cloud is self-shielded. In the clouds in the region (c), the star formation is likely to be retarded until the pancake disk shrinks considerably. Therefore, the region (c) tends to result in the so-called dissipational galaxy formation (e.g. Larson 1976; Carlberg 1985; Katz & Gunn 1991). The collapse epochs are relatively later (), compared to the region (b), and the region (c) is corresponding to CDM fluctuations lower than 1. Thus, it is likely that the region (c) leads to a less clustered population of galaxies. Futhermore, for low redshifts (), the intensity of UV background is no longer at a level of , but could be smaller by two orders of magnitude (Maloney 1993; Henry & Murthy 1993; Dove & Shull 1994). Since for as seen in (21), the clouds with in the region (c) might cool quickly in the course of shrinking down to the rotation barrier.
5.4 Expanding Clouds
In the region (d), the clouds are no longer gravitationally bound because of the enhancement of thermal pressure due to UV heating. They are relatively low mass systems. They could be Lyman alpha absorption systems which are seen in QSO spectra (Umemura & Ikeuchi 1984, 1985; Bond, Szalay, & Silk 1988).
6 CONCLUSIONS
We have numerically explored the thermal and dynamical evolution of pregalactic clouds under UV background radiation. The plane-parallel collapse of primordial gas clouds has been pursued, including chemical reactions with respect to hydrogen molecules as well as atomic hydrogen. Also, the radiation transfer for the ionizing photons has been properly treated. As a result, it is found that the cloud evolution under UV background branches off into four categories in the initial parameter space of density and size. They are (a) promptly self-shielded clouds, which evolve into dense objects with at collapse redshifts () greater than 10, (b) starburst pancake clouds with the mass higher than , which lead to the dissipationless galaxy formation at , (c) retarded star-forming galaxies with the mass lower than , which undergo star formation in the course of shrinking down to the rotation barrier at , consequently leading to the dissipational galaxy formation, and (d) less massive expanding clouds, which could be detected as Lyman alpha absorbers in QSO spectra. If we assume a standard CDM cosmology, density fluctuations of 1-2 coincides with . That is, fluctuations higher than 2 result in the dissipationless formation of massive galaxies at , and eventually constitute a clustered population. From a further realistic point of view, there must be local subgalactic clumps growing in a pregalactic cloud in a bottom-up scenario like a CDM cosmology. They are likely to be self-shielded earlier than uniform components. Thus, can be considered as a measure of determining the bulge-disk ratios (B/D) of formed galaxies. Above , the B/D ratio should be larger, while the ratio becomes smaller below .
Acknowledgements.
We are very grateful to Steven N. Shore for reviewing the article and making valuable comments and criticism, and also for enormous assistance as a editor. We also thank T. Nakamoto for continuous encouragement. We thank also R. Nishi and H. Uehara for useful discussions. This work is supported in part by Research Fellowships of the Japan Society for the Promotion of Science for Young Scientists, No.2370 (HS), and the Grants-in Aid of the Ministry of Education, Science, Culture, and Sports, 09874055 (MU).Appendix A Frequency Integration for Photoionization and UV Heating Rate
In this appendix, a method to integrate the frequency dependence in radiation transfer equation is presented (see also Tajiri & Umemura 1998). This method is applied to plane-parallel calculations in this paper. However, it is also potent for the 3D calculations on cosmic ionization problem (Nakamoto, Umemura & Susa 1999). The frequency-dependent radiation transfer equation is given by a general form as,
| (A1) |
where is the unit directional vector, and denote the opacity and the emissivity, respectively. For the gas composed of pure hydrogen, the emissivity is almost null for , where denotes the width of the Lyman limit emission resulting from radiative recombination;
| (A2) |
where , and denote the gas temperature, and Planck constant, respectively. Typically, for K. As far as higher energy photons of are concerned, the solution of equation (A1) is simply
| (A3) |
where denotes the incident intensity at the boundary. The optical depth in the solid angle is rewritten in terms of the optical depth at Lyman limit, ,
| (A4) |
because the photoionization cross-section is . Using the equations (A3) and (A4), we obtain the photoionization rate coefficient for this energy range of photons, , in terms of an integration as
| (A5) | |||||
| (A6) |
where we have assumed and denotes the incomplete gamma function. denotes the optical depth measured in the vertical directions of a slab, which is already introduced in section 4. It is noted that the integration in frequency space has been carried out just analytically with the incomplete gamma function. In other words, we do not have to solve the radiation transfer equation for .
On the other hand, photons with are scattered to produce diffuse radiation. For hydrogen, the scattering albedo is given by , where is the total recombination coefficient to all bound levels and is the recombination coefficient to all excited levels. Hence, we have to integrate the radiation transfer equation including the emissivity by scatterings. In this frequency range, the frequency-dependence of the opacity and the emissivity are thought to be small, because is ten times smaller than for . So, we approximate the opacity and emissivity to be constant in this frequency range. After the transfer equation is solved, we calculate the angle averaged intensity in terms of the numerical solution . Using , we obtain the photoionization rate coefficient for this frequency range, ;
| (A7) |
Finally, by adding (A6) to (A7), we obtain the total ionization rate ;
| (A8) |
The UV heating rate is also obtained in a similar way. The result is,
| (A9) | |||||
| (A10) | |||||
| (A11) |
In particular, for an infinite sheet, we have an asymptotic expression for the absorption part () in an optically thick limit as
| (A12) |
where represents the gamma function. It should be noted that the UV heating rate is not proportional to , but is proportional to for large . If we choose as in the present paper, the UV heating rate is proportional to . This shallow dependence upon the optical depth comes from a steep dependence of ionization cross section upon frequencies.
References
- (1) Abel,T. & Haehnelt, M.G. 1999, ApJ, L13
- (2) Anninos, P. A., & Norman, M. L. 1996, ApJ, 460, 556
- (3) Babul, A., & Rees, M. J. 1992, MNRAS, 255, 346
- (4) Bajtlik, S. Duncan, R. C., & Ostriker, J. P. 1988, ApJ, 327, 570
- (5) Beiniek, R.J. 1980, J.Phys.B, 13, 4405
- (6) Bertoldi, F. & Draine,B.T. 1996, ApJ, 458, 222
- (7) Blumenthal, G. R., Faber, S. M., Primack, J. R., & Rees, M. J. 1984, Nature, 311, 517
- (8) Böhringer, H., & Hensler, G. 1989, A&A, 215, 147
- (9) Bond, J. R., Centrella, J., Szalay, A. S.,& Wilson, J. R. 1984, MNRAS, 210, 515
- (10) Bond, J. R., Szalay, A. S., & Silk, J. 1988, ApJ, 324, 627
- (11) Carlberg, R. G. 1981, MNRAS, 197, 1021
- (12) Carlberg, R. G. 1985, ApJ, 298, 486
- (13) Cen, R., Miralda-Escude, J., Ostriker, J. P., & Rauch, M. 1994, ApJ, 437, L9
- (14) Chiba, M., & Nath, B. 1994, ApJ, 436, 618
- (15) Cole, S., Aragon-Salamanca, A., Frenk, C.S., Navarro, J.F.,& Zepf, S.E. 1994, MNRAS, 271, 781
- (16) Colella, P., & Woodward, P.R. 1984, J. Comp. Phys., 1984, 54, 174
- (17) Corbelli, E., Galli, D & Palla, F. 1997, ApJ, 487, 53L
- (18) Cowie, L. L., Songaila, A., Kim, T.,& Hu, E. M. 1997, AJ, 109, 1522
- (19) Cowie,L.L., & Songaila, A. 1998, Nature, 394, 44
- (20) de Jong, T. 1972, A&A, 20, 263,
- (21) Dekel, A., & Rees, M. J. 1987, Nature, 326, 455
- (22) Diaz-Miller, R.I., Franco,J. & Shore,S.N. 1998, ApJ, 501, 192
- (23) Dove, J. B., & Shull, M. 1994, ApJ, 423, 196
- (24) Draine, B. T., & Bertoldi, F. 1996, ApJ, 468, 269
- (25) Duley, W.W., & Williams, D.A. 1984, in Interstellar Chemistry (London: Academic Press)
- (26) Efstathiou, G. 1992, MNRAS, 256, 43
- (27) Elmegreen,B.G., & Elmegreen, D.M. 1978, ApJ, 220, 1051
- (28) Giallongo, E., Cristiani, S., D’Odorico, S., Fontana, A., & Savaglio, S. 1996, ApJ, 466, 46
- (29) Gunn, J. E., & Peterson, B. A. 1965, ApJ, 142, 1633
- (30) Haiman,Z., Rees, M. J., & Loeb, A. 1996, ApJ, 467, 522
- (31) Heavens, A., & Peacock, J. 1988, MNRAS, 232, 339
- (32) Henry, R. C., & Murthy, J. 1993, ApJ, 418, L17
- (33) Hernquist, L, Katz, N., Weinberg, D. H., & Miralda-Escude, J. 1995, ApJ, 457, L51
- (34) Hollenbach,D.J., & McKee,C. 1979, ApJS, 41, 55
- (35) Hollenbach,D.J., & Tielens,A.G.G.M. 1999, Rev.Mod.Phys., 71,173
- (36) Hutchins, J. B., 1976, ApJ, 205, 103
- (37) Izotov, Yu.I., & Kolensnik, I.G. 1984, Soviet Astro., 28, 15.
- (38) Kang, H., & Shapiro, P., ApJ, 386, 432
- (39) Karpas,Z.,Anicich, V., & Huntress, W.T.,Jr. 1979, J. Chem. Phys., 70, 2877
- (40) Katz, N., & Gunn, J. E. 1991, ApJ, 377, 365
- (41) Kauffmann, G., White, S.D.M., & Guiderdoni, B. 1993, MNRAS, 264, 201
- (42) Kepner, J., Babul, A., & Spergel, N. 1997, ApJ, 487, 61
- (43) Larson, R. B. 1976, MNRAS, 176, 31
- (44) Lotz, W. 1968, Zs. Phys., 216, 241
- (45) Lubow, S.H., & Pringle, J.E. 1993, MNRAS, 263, 701
- (46) Maloney, P. 1993, ApJ, 414, 41
- (47) Matsuda, T., Sato, H., & Takeda, H. 1969, Progr. Theor. Phys., 42, 219
- (48) Miralda-Escude, J., & Rees, M. J. 1994, MNRAS, 266, 343
- (49) Mitchell, G.F., & Deveau, T.J. 1983, ApJ, 266, 646
- (50) Nakamoto, T., Umemura, M., & Susa, H. 1999, submitted to Nature
- (51) Nakamura, F., & Umemura, M. 1999, ApJ, 515, 239
- (52) Navarro, J, & Steinmetz, M. 1997, ApJ, 478, 13
- (53) Osterbrock, D.E. 1989, Astrophysics of Gaseous Nebula & Active Galactic Nuclei (University Science Books), section 2
- (54) Palla, F., Salpeter, E. E., & Stahler, S. W., 1983, ApJ, 271, 632
- (55) Poularert, G., Brouillard, F., Claeys, W., McGowan, J.W., & Van Wassenhove,G. 1978, J. Phys., B, 11, L671
- (56) Prasad,S.S., & Huntress, W.T.,Jr. 1980, ApJS, 43, 1
- (57) Quinn, T., Katz, N., & Efstathiou, G. 1996, MNRAS, 278, L49
- (58) Ramaker, D.E., & Peek,J.,M. 1976, Phys.Rev. A, 13, 58
- (59) Rees, M. J., & Ostriker, J. P., 1977, MNRAS, 179, 541
- (60) Schneider, D. P., Schmidt, M., & Gunn, J. E. 1989, AJ, 98, 1951
- (61) Schneider, D. P., Schmidt, M., & Gunn, J. E. 1991, AJ, 102, 837
- (62) Shapiro, P.R., & Kang, H., 1987, ApJ, 318, 32
- (63) Shapiro, P. R., & Struck-Marcell, C. 1985, ApJS, 57, 205
- (64) Shapiro, P. R., Struck-Marcell, C., & Melott, A. L. 1983, ApJ, 275, 413
- (65) Songaila, A. & Cowie, L.L. 1996, AJ, 112, 335
- (66) Songaila, A. 1997, ApJ, 490, L1
- (67) Spitzer, L. Jr., 1956, in The Physics of Fully ionized Gases (New York:Interscience), p. 88
- (68) Spitzer, L. Jr. 1978, in Physical Processes in the Interstellar Medium (John Wiley & Sons, Inc. 1978), p. 143
- (69) Stone, J.M., Mihalas, D., & Norman, M.L. 1992, ApJS, 80, 819
- (70) Susa, H., Uehara, H., & Nishi, R. 1996, Prog. Theor. Phys., 96, 107
- (71) Susa, H., Uehara, H., Nishi, R., & Yamada, M. 1998, Prog. Theor. Phys., 100, 63
- (72) Tajiri, Y., & Umemura, M. 1998, ApJ, 502, 59
- (73) Tegmark, M., Silk, J., Rees, M. J., Blanchard, A., Abel, T., & Palla, F. 1997, ApJ, 474, 1
- (74) Thoul, A. A., & Weinberg, D. H., 1996, ApJ, 465, 608
- (75) Uehara, H., Susa, H., Nishi, R., & Yamada, M. 1996, ApJ, 473, L95
- (76) Umemura, M., & Ikeuchi, S. 1984, Prog. Theor. Phys., 72, 47
- (77) Umemura, M. 1993, ApJ, 406, 361
- (78) Vishniac, E.T. 1983, ApJ, 274, 152
- (79) White, S.D.M.,& Frenk, C.S. 1991, ApJ, 379, 52
- (80) Whitworth, A.P., Bhattal, A.S., Chapman, S.J., Disney, M.J.,& Turner, J.A. 1994, A&A, 290, 421
- (81) Yamada, M., & Nishi, R. 1998, ApJ, 505, 148
- (82) Yoneyama, T. 1972, PASJ, 24, 87
- (83) Yuan, W. , Centrella, J. M., & Norman, L. M. 1991, ApJ, 376, L29
- (84) Zel’dovich, Ya. B. 1970, A&A, 5, 84
- (85) Zhang, Y., Anninos, P., & Norman, M. 1995, ApJ, 453, L57


| Reactions | References |
|---|---|
| H++ e H + | Spitzer 1956 |
| H + e H-+ | de Jong 1972 |
| H-+ H H2+e | Beiniek 1980 |
| 3H H2+ H | Palla, Salpeter & Stahler 1983 |
| H2+ H 3H | SK |
| 2H + H22H2 | Palla, Salpeter & Stahler 1983 |
| 2H22H + H2 | SK |
| H + e H++2e | Lotz 1968 |
| 2H H + H++ e | Palla, Salpeter & Stahler 1983 |
| H + H+H+ | Ramaker & Peek 1976 |
| H+ H H2+ H+ | Karpas, Anicich & Huntress 1979 |
| H2+ H+H+ H | Prasad & Huntress 1980 |
| H-+ H+H+ e | Poularert et al. 1978 |
| H+ e 2H | Mitchell & Deveau 1983 |
| H+ H-H + H2 | Prasad & Huntress 1980 |
| H-+ e H + 2e | Duley 1984 |
| H-+ H 2H + e | Izotov & Kolensnik 1984 |
| H-+ H+2H | Duley 1984 |
| H + H++ e | see text |
| H2+ 2H | Draine & Bertoldi 1996 |
| (shocked) | (cooled) | ||||
|---|---|---|---|---|---|
| 100 | not cooled | ||||
| 100 | |||||
| 100 |