ANALYSIS AND INTERPRETATION
OF X-RAY PROPERTIES
OF BLACK HOLE CANDIDATES
Sergey P. Trudolyubov
A thesis submitted in partial fulfillment of
the requirements for the degree of
DOCTOR OF PHILOSOPHY (Astrophysics)
at the
SPACE RESEARCH INSTITUTE
RUSSIAN ACADEMY OF SCIENCES
December 1999
Advisor Dr. Marat R. Gilfanov
Summary
The thesis is mainly devoted to the study of spectral and timing characteristics of the X-ray emission from Galactic black hole candidates GRS 1915+105, GX 339–4, 4U 1630–47, XTE J1748–288, GRS 1739–278, KS/GRS 1730–312, GRS 1737–31. The main results include: observation of the correlated evolution of spectral and timing parameters of these sources and its interpretation in the framework of two–phase model of the accretion flow near the compact object; development of the quantitative model for the evolution of GRS 1915+105 during flaring state providing direct estimate of the disk accretion rate in the system; restrictions on the parameters of the spatial distribution and luminosity function of the Galactic hard X-ray transient sources; application of the the bulk motion comptonization model to the analytic approximation of the broad–band energy spectra of Galactic black hole candidates in the high/very high state obtained with RXTE.
Full ps–version of the thesis (in russian) can be found at:
http://hea.iki.rssi.ru/ tsp/research.html
The first part of the thesis contains a brief description of instruments aboard the GRANAT, MIR/KVANT and RXTE observatories and observational techniques used in the analysis.
In the second part the results of hard X-ray observations of well-known Galactic black hole candidate GX 339–4 with GRANAT/SIGMA in are presented. It was shown that the evolution of spectral and temporal characteristics of the source emission is very similar for individual outbursts (Fig. 1). Prominent correlation between the hardness of energy spectrum and the level of aperiodic variability of hard X-ray emission of GX 339–4 has been found, which is typical for the black hole candidate systems in the hard spectral state (Fig. 1). Basing on the properties of the long–term X-ray evolution of GX 339–4, we propose the triggering of the irradiation/magnetically–driven mass transfer instability in the low mass binary system as possible origin of the source transient outbursts.
The third part of the thesis consists of 3 chapters, describing X-ray properties of the Galactic microquasar GRS 1915+105 in different spectral states.
![[Uncaptioned image]](/html/astro-ph/0001139/assets/x1.png) Figure 1: The evolution of the characteristics of hard X-ray radiation
from GX 339–4 with time since the beginning of the , and
outbursts: keV energy flux – upper panel ;
best–fit bremsstrahlung temperature – middle panel ; (
Hz) fractional rms2 of keV flux fluctuations – lower panel. Solid circles, open circles and solid squares in each panel
correspond to the , and SIGMA data respectively.
Figure 1: The evolution of the characteristics of hard X-ray radiation
from GX 339–4 with time since the beginning of the , and
outbursts: keV energy flux – upper panel ;
best–fit bremsstrahlung temperature – middle panel ; (
Hz) fractional rms2 of keV flux fluctuations – lower panel. Solid circles, open circles and solid squares in each panel
correspond to the , and SIGMA data respectively.

In the first chapter we present the results of observations of GRS 1915+105 with PCA and HEXTE instruments aboard RXTE from October 1996 through April 1997, when the source exhibited transitions between the states with high and low X-ray luminosities. With the exception of some individual features, the general temporal and spectral characteristics of the X-ray emission from GRS 1915+105 and the pattern of their evolution were similar to the properties of other Galactic black hole candidates in the so–called intermediate state, which corresponds to a transition between the canonical low and high states. The broad–band source spectrum in the keV energy range can be represented as a sum of a relatively weak soft component with a characteristic temperature of keV and a hard component; the latter can be fitted by a power law with a photon index of about and an exponential cutoff at energies keV. The temporal evolution of the energy spectrum is characterized by a gradual increase in its hardness as the total X-ray luminosity decreases from to erg/s (for the assumed source distance of 12.5 kpc). A distinctive feature of the power spectrum of GRS 1915+105 during the period under consideration is the presence of a quasi–periodic oscillation (QPO) peak at frequencies Hz. The variations of the QPO centroid frequency are strongly correlated with the variations of spectral and timing parameters (in particular parameters of the soft spectral component). This type of correlation holds on the wide range of time scales (from seconds to months)(Fig. 2). Based on our observational data and taking into account the similarity of the salient features in the behavior of GRS1915+105 to the corresponding properties of Galactic black-hole candidates, we may assume that a further decrease in the source luminosity (below the observed values during the reported period) would result in a transition of GRS 1915+105 to a state close to the canonical low state.
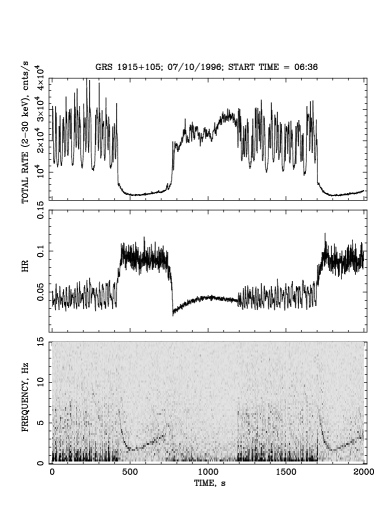
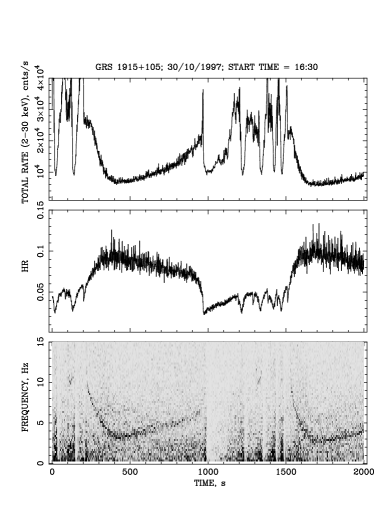
The second chapter contains the analysis based on the RXTE observations of GRS 1915+105 in the flaring state, when the spectrum and fast variability of the source were changing on the time scales from a few seconds up to seconds (Fig. 3). We show that rich variety of source bursting behavior can be reduced to a sequence of two types of transitions between soft and hard states qualitatively distinguished by their spectral and temporal properties. The quasi–periodic oscillations (QPOs) with the frequency varying between 2 and 10 Hz are associated with the episodes of harder source spectrum. In each observation we found tight correlation between the duration of the hard episode and the characteristic QPO frequency . For a half of the observations this correlation matches the relation between the viscous time scale, and the Keplerian frequency, , when both quantities are evaluated for various radii in the radiation pressure dominated accretion disk (Fig. 4). Assuming that the QPO frequency is proportional to the Keplerian frequency at the boundary between an optically thick accretion disk and a hot comptonization region, the changes of the QPO frequency can then be understood as due to variations of this boundary position on the viscous time scales. Aforementioned model allows to estimate typical value of the disk accretion rate, in GRS 1915+105 during the flaring state: , where – viscosity parameter and – compact object mass.


In the third chapter we present the interpretation of the spectral and temporal properties of GRS 1915+105 in the framework of two–component model of the accretion flow involving hot comptonization region near the compact object surrounded by the optically thick accretion disk.
The fourth part demonstrates that the comparison of the hard X-ray transient detection rates by GRANAT/SIGMA and currently operating all–sky monitors (CGRO/BATSE, GRANAT/WATCH) leads to following conclusions regarding the spatial and luminosity distributions of the hard X-ray transients:
(i) the spatial distribution of X-ray Novae exhibits a concentration towards the Galactic Center similar to the distribution of the visible matter in the Galaxy. In particular, it is more concentrated than Galactic disk population.
(ii) if hard X-ray transients follow distribution of visible mass in the Galaxy then their peak luminosity in the keV band is close to erg s-1 with a relatively small scatter.
In the fifth part the results of application of the bulk motion comptonization model to the approximation of broad–band spectra of galactic black hole candidates in the high/very high state are presented. It is shown that this model gives reasonable description of the observational data in the keV energy domain.
![[Uncaptioned image]](/html/astro-ph/0001139/assets/x7.png) Figure 5: The dependence of the QPO centroid frequency on the
X-ray flux in the soft spectral component in the keV energy range
(without correction for an interstellar absorption). The parameters of
the soft component are for the best-fit approximation by
multicolor disk black body plus power law model. PCA data
for the very high state observations (June ) have
been used. Each point corresponds to the data averaged over 256-s time
intervals.
Figure 5: The dependence of the QPO centroid frequency on the
X-ray flux in the soft spectral component in the keV energy range
(without correction for an interstellar absorption). The parameters of
the soft component are for the best-fit approximation by
multicolor disk black body plus power law model. PCA data
for the very high state observations (June ) have
been used. Each point corresponds to the data averaged over 256-s time
intervals.
![[Uncaptioned image]](/html/astro-ph/0001139/assets/x8.png) Figure 6: Similar X-ray variability patterns for 4U1630-47
(upper panel)(Feb. 18, 1998 observation), GRO J1655–40
(middle panel) and GRS 1915+105 (lower panel) according
to the RXTE/PCA observations ( keV energy range, fluxes
correspond to the 5 Proportional Counter Units).
Figure 6: Similar X-ray variability patterns for 4U1630-47
(upper panel)(Feb. 18, 1998 observation), GRO J1655–40
(middle panel) and GRS 1915+105 (lower panel) according
to the RXTE/PCA observations ( keV energy range, fluxes
correspond to the 5 Proportional Counter Units).

![[Uncaptioned image]](/html/astro-ph/0001139/assets/x10.png) Figure 8: The changes in 4U1630-47 energy spectrum between the low
(filled circles) and high (open circles) flux episodes for the
same observation. Ratios of energy spectra to a power law with photon
index are shown. The differences in both the temperature
of soft component and the slope of hard component can be interpreted as
an inward motion of the accretion disk inner edge during the periods of
higher flux.
Figure 8: The changes in 4U1630-47 energy spectrum between the low
(filled circles) and high (open circles) flux episodes for the
same observation. Ratios of energy spectra to a power law with photon
index are shown. The differences in both the temperature
of soft component and the slope of hard component can be interpreted as
an inward motion of the accretion disk inner edge during the periods of
higher flux.


The sixth part of the thesis consists of 5 chapters, containing the results of systematic analysis of emission properties of several Galactic black hole candidate X-ray Novae: KS/GRS 1730–312, GRS 1739–278, GRS 1737–31, XTE J1748–288 and 4U 1630–47. Detection of the correlated evolution of spectral and timing characteristics of these sources is one of the most important results. For example, in the case of XTE J1748–288 the correlation between the QPO frequency and soft spectral component flux was clearly detected (Fig. 5). Similarly to the Galactic microquasar GRS 1915+105 (Fig. 2), this type of correlation holds on a wide range of timescales. Another interesting feature is the quasi–regular modulation with periods of s detected during the maximum phase of the outburst of 4U 1630–47 (Fig. 6). It is notable that somewhat similar type of variability was observed in Galactic microquasars GRS 1915+105 and GRO J1655-40 (Fig. 6 ). We speculate that this mode might be common for black hole binaries emitting at certain luminosity level. It is remarkable that in all cases, this mode corresponds to a relatively narrow interval of source luminosities. Our analysis revealed significant differences in spectral and temporal behavior of the source at high and low fluxes during this period of time (Fig. 8, 9).
As in the case of GRS 1915+105 the correlated spectral and timing behavior in course of the X-ray Novae outburst can be generally understood in the framework of the two-phase model of the accretion flow around the compact object (i.e. the composition of a hot inner comptonization region and surrounding optically thick accretion disk). The interaction between these two distinct regions determines the properties of the spectrum and variability of the source. Assuming the QPO phenomenon to be related to the dynamical time scale on the boundary between the hot inner region and the outer accretion disk, we can treat the observed increase of the QPO centroid frequency as an indication of the inward motion of this boundary during the rise phase of the outburst. This interpretation is supported by simultaneous shift of the maximum of the PDS band-limited noise component (depending on the characteristic radius of the inner comptonization region) and softening of the energy spectrum. Similarity of the rise phases of X-ray Novae outbursts and the outbursts allows us to suggest that in all these cases the approach of the inner edge of an optically thick accretion disk to the black hole causes the rise of the soft X-ray emission and softening of the broad–band energy spectrum. Alternatively, the hardening of the energy spectrum and decrease of the QPO centroid frequency and frequency of the BLN component maximum observed during the final stages of the X-ray Novae outbursts, could be explained in terms of the outward motion of the boundary between the inner region and an optically thick accretion disk.
The variations in the characteristic QPO frequencies hint at a change of some typical radius of the system, in particular, the inner radius of the optically thick accretion disk. Because the luminosity of the disk depends on both the accretion rate and the inner radius of the disk, we can not simply attribute any changes in the source luminosity to the change of the accretion rate onto the central object. In fact, the luminosity can vary significantly for the same accretion rate, if the geometry of the system and relative contribution from disk and corona component change. The observation of several plateaus at the peak of the outburst of some sources (e.g 4U 1630–47) shows the existence of quasi–stationary modes of the accretion for this state.
Part of the research has made use of data obtained through the HEASARC Online Service, provided by the NASA/GSFC.