Observation of Microlensing towards the Galactic Spiral Arms. EROS II 3 year survey ††thanks: This work is based on observations made at the European Southern Observatory, La Silla, Chile.
Abstract
We present an analysis of the light curves of 9.1 million stars observed during three seasons by EROS (Expérience de Recherche d’Objets Sombres), in the Galactic plane away from the bulge. Seven stars exhibit luminosity variations compatible with gravitational microlensing effects due to unseen objects. The corresponding optical depth, averaged over four directions, is . While this value is compatible with expectations from simple galactic models under reasonable assumptions on the target distances, we find an excess of events with short timescale towards the direction closest to the Galactic Centre.
Key Words.:
Galaxy: Bar – Galaxy: kinematics and dynamics – Galaxy: stellar content – Galaxy: structure – (Cosmology:) gravitational lensingsee also our WWW server at URL :
http://www.lal.in2p3.fr/recherche/eros
1 Introduction
Extensive photometric surveys, triggered by Paczyński’s suggestion (1986), have led to the observation of microlensing effects towards the Magellanic clouds (EROS, Aubourg et al. (1993); MACHO, Alcock et al. (1993) ) and the Galactic bulge (OGLE, Udalski et al. (1994); MACHO, Alcock et al. (1995)).
The few hundred events observed towards the Galactic Centre (Udalski et al. (1994); Alcock et al. (1997)) have strengthened the hypothesis of a barred structure. The early suggestion of de Vaucouleurs (1964) that the Galaxy is barred is now supported by many other observations including photometric measurements (Dwek et al. (1995)), studies of gas (Weiner et al. (1999)), stellar kinematics (Zhao et al. (1996)) and star counts (Stanek et al. (1994)). Nevertheless, the bar parameters (shape, size, mass …) are not yet precisely known.
In order to improve our knowledge of the Galactic structure, EROS started a dedicated observation program towards the Galactic Spiral Arms (GSA) in 1996. Four regions of the Galactic plane located at large angles from the Galactic Centre are now being monitored to disentangle the disc, bar and halo contributions to the optical depths. Three events with long Einstein crossing time have already been published, based on two year (1996-97) EROS observations (Derue et al. 1999b , hereafter paper I). Because of their long duration, they are more easily interpreted as lensing events due to disc objects, rather than to halo deflectors. We present in this paper an analysis of the three-year data set (1996-1998).
2 Experimental setup and observations
The telescope, camera and observations, as well as the operations and data reduction are described in paper I and references therein. Four different directions are being monitored in the Galactic plane, corresponding to a total of 29 fields with high stellar densities, covering a wide range of Galactic longitude. The three year data set contains 9.1 million light curves : 2.1 towards , 1.8 towards , 3.0 towards and 2.2 towards . The observations span the period between July 1996 and November 1998, except for which is being monitored only since January 1997. An average of 100 measurements per field were obtained in each of the and bands, which are close to Cousins I and Johnson R to magnitudes. As indicated in paper I, the distance distribution of our source stars is not precisely known. We adopt an average distance for source stars of kpc for the discussion presented in this paper.
3 The search for lensed stars
3.1 Data analysis selection results
The data analysis is similar to that of the first two years, except that no rejection criteria based on the colour-magnitude diagram were applied. This was made possible by the longer time coverage, allowing a better rejection against variable stars. The first step of the event selection filter requires the presence of a single bump, simultaneous in the two EROS colours. To reject ordinary variable stars, we use the combined of the microlensing fit from light curves in both colours, estimated outside the peak (i.e. restricted to periods where the fitted magnification is lower than 10%). We retain high signal-to-noise ratio events by requiring a significant improvement of the microlensing fit (ml) over a constant flux fit (cst):
where is the number of degrees of freedom.
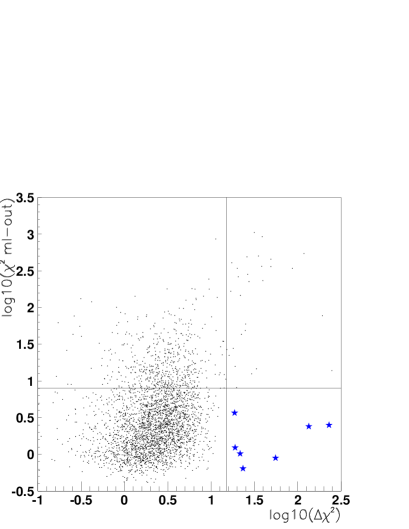
Seven light curves satisfy all the requirements and are labelled GSA1 to 7. Fig. 1 shows the distribution of versus for lightcurves satisfying all the other selection criteria. The seven candidates are located in a region of the diagram corresponding to lightcurves with a magnification well described by a microlensing fit and constant outside the peak. The upper right side of the diagram is populated by variable stars, mostly red and bright.
| Candidate | GSA1 | GSA2 | GSA3 | GSA4 | GSA5 | GSA6 | GSA7 |
|---|---|---|---|---|---|---|---|
| field | |||||||
| (h:m:s) eq.2000 | 18:29:09.0 | 16:11:50.2 | 16:16:26.7 | 18:32:26.0 | 18:32:12.0 | 18:33:45.5 | 18:35:12.4 |
| (d:m:s) eq.2000 | -14:15:09 | -52:56:49 | -54:37:49 | -12:56:04 | -12:55:16 | -14:41:41 | -14:56:27 |
| - | 17.7 - 20.7 | 17.8 - 19.4 | 17.5 - 18.6 | 17.1 - 17.9 | 17.9 - 19.9 | 17.2 - 18.5 | 17.5 - 18.7 |
| (days) | |||||||
| Max. magnification | |||||||
| contribution to () | 0.51 | 0.15 | 0.12 | 0.30 | 0.44 | 0.35 | 0.22 |
Table 1 contains the characteristics of the 7 candidates. GSA1 & 2 have been studied in detail in paper I leading to additional constraints on lens masses and distances. None of the new candidates shows any noticeable deviation from standard microlensing curves. Finding charts and lightcurves can be found in Derue et al. 1999b (see also our WWW server).
3.2 The analysis efficiency
To determine the efficiency of each selection criterion, we have applied them to Monte-Carlo generated light curves, obtained from a representative sample of the observed light curves on which we superimpose randomly generated microlensing effects.
| Event timescale | Direction | |||
|---|---|---|---|---|
| (days) | ||||
| 2.1 | 2.1 | 5.3 | 9.4 | |
| 6.0 | 5.1 | 12.5 | 14.5 | |
| 8.5 | 8.0 | 17.0 | 17.0 | |
| 11.5 | 10.5 | 25.0 | 18.7 | |
| 13.8 | 10.5 | 30.0 | 18.5 | |
The microlensing parameters are uniformly drawn in the following intervals: impact parameter expressed in units of the Einstein radius , maximum magnification time in a search period starting 150 days before the first observation and ending 150 days after the last observation, and Einstein radius crossing time days. As in paper I, the analysis efficiency (or sampling efficiency) reported in Table 2 is relative to a set of unblended stars, normalised to .
4 Galaxy model, optical depth and event timescale
We have computed the expected optical depth (probability of observing a magnification larger than 1.34 for a pointlike source) using a three component model for the deflectors : a bulge, described by a barlike triaxial distribution, a thin disc, and a standard isotropic and isothermal halo (same as model 1 in paper I). The expected optical depth averaged over the four directions is for this model. Fig. 2 shows the optical depth up to as a function of Galactic longitude for two values of the bar semi-major axis ( as in paper I and ), at the average latitude of our fields . Note that at this Galactic latitude, the bulge and disc contributions are already reduced by a factor with respect to zero latitude; moreover, the bulge contribution also changes dramatically with the distance to the target (here assumed to be at 7 kpc, while the Galactic centre is at 8.5 kpc).
Assuming a standard halo completely made of compact objects would lead to a halo contribution of less than 10% to the GSA optical depth. Moreover the EROS measurements towards the LMC (Ansari et al. (1996); Alcock et al. (1998); Lasserre (1999)) and the SMC (Afonso et al. (1999)) suggest that no more than 40% of this halo can be made of MACHOs lighter than . Thus, for the sake of clarity, we will neglect the halo contribution in the following discussion.
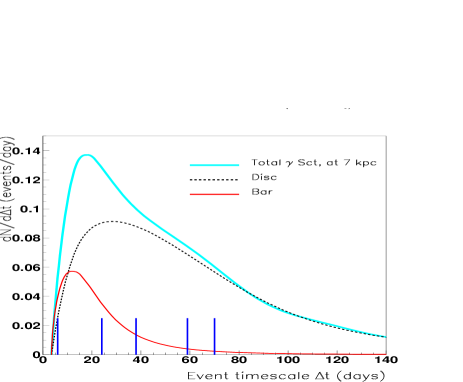
Fig. 3 shows the expected event duration distribution towards . The durations for the five events observed toward are also indicated. The predicted distribution is obtained using the kinematic characteristics and mass functions given in paper I. As the disc lenses have a low velocity relative to the line of sight, disc-disc events have longer timescales ( days) than bar-disc events ( days).

5 Optical depth estimation
For a given target, an estimate of the optical depth or a limit (when ) can be computed using the expression:
where is the number of monitored stars in the target and the duration of the search period (1170 days for this 3 year analysis, except 990 days towards ).
We compute an average optical depth by a weighted mean () over the four directions. We find the value , in agreement with expectations.
In Fig. 2 we report for each target the measured optical depth. The quoted errors include only Poisson fluctuations and indicate the bayesian 68% confidence intervals. In the case of and , where no events were observed, we have computed a 95% confidence level upper limit, assuming a mean event duration of 50 days : and .
The two targets and are located at nearly symmetric longitudes with respect to the Galactic Centre. Yet, we find an optical depth toward () significantly higher (at more than ) than toward (). In addition, the average measured event timescale toward is 40 days, half of that observed for . These features suggest a significant contribution from the bar toward . Although an asymmetry is expected from the bar contribution in model I, our observations indicate a larger difference in optical depths. Indeed we find a deficit in the event rate toward and an excess toward , compared to our model’s predictions, as can be seen in figure 2.
Provided that this is not due to a statistical fluctuation, at least two
simple hypotheses could explain the observed asymmetry:
- An increase in the bar length parameter enhances
the asymmetric contribution to the optical depth.
Changing this parameter from to kpc leads to
an optical depth toward .
- The optical depth is very sensitive to the poorly known distance
distribution of the monitored source stars, which depends on
the star number density and the extinction along the line of sight.
For example, changing the
source star distances from 7 kpc to 9 kpc (resp 11 kpc)
increases the expected optical depth from to
(resp. ). However,
this hypothesis alone cannot account for the shorter
event durations observed toward .
6 Conclusion
We have searched for microlensing events with durations ranging from a few days to a few months in four Galactic disc zones lying at to from the Galactic Centre. We find seven events that can be interpreted as microlensing effects due to massive compact objects. The estimated average optical depth is compatible with expectations from simple Galactic models. However, we observe variations of the event rate with the Galactic longitude which differ from these models predictions. Additional data is needed to confirm the reported discrepancy and to shed light on its interpretation.
Acknowledgements.
We are grateful to D. Lacroix and the technical staff at the Observatoire de Haute Provence and to A. Baranne for their help in refurbishing the MARLY telescope and remounting it in La Silla. We are also grateful for the support given to our project by the technical staff at ESO, La Silla. We thank J.F. Lecointe for assistance with the online computing. We wish to thank also C. Nitschelm for his contribution to the data taking.References
- Afonso et al. (1999) Afonso C., Alard C., Albert J.-N. et al. (EROS Coll.), 1999, A&A 344, L63
- Alcock et al. (1993) Alcock C., Akerlof C.W., Allsman R.A. et al. (MACHO Coll.), 1993, Nat 365, 621.
- Alcock et al. (1995) Alcock C., Allsman R.A., Axelrod T.S. et al. (MACHO Coll.), 1995, ApJ 445, 133.
- Alcock et al. (1997) Alcock C., Allsman R.A., Alves D. et al. (MACHO Coll.), 1997, ApJ 479, 119.
- Alcock et al. (1998) Alcock C., Allsman R.A., Alves D. et al. (EROS Coll., MACHO Coll.), 1998, ApJ 499, L9.
- Ansari et al. (1996) Ansari R., Cavalier F., Moniez M. et al. (EROS Coll.), 1996, A&A 314, 94.
- Aubourg et al. (1993) Aubourg É., Bareyre P., Bréhin S. et al. (EROS Coll.), 1993, Nat 365, 623.
- de Vaucouleurs (1964) de Vaucouleurs G., 1964, in The Galaxy and the Magellanic Clouds, IAU Symp. 20, eds F.J. Kerr & A.W. Rodgers, (Camberra: Austr. Acad. Sci), 195.
- (9) Derue F., 1999a, Ph.D. thesis, CNRS/IN2P3, LAL report to be published.
- (10) Derue F., Afonso C., Alard C. et al. (EROS Coll.), 1999b, astro-ph/9903209, A&A accepted
- Dwek et al. (1995) Dwek E., Arendt R.G., Hauser M.G. et al., 1995, ApJ 445, 716.
- Freudenreich (1998) Freudenreich H.T., 1998, ApJ 492, 495.
- Lasserre (1999) Lasserre T., 1999, astro-ph/9909505
- (14) Paczyński B., 1986, ApJ 304, 1.
- Stanek et al. (1994) Stanek K.Z., Mateo M., Udalski A. et al. (OGLE Coll.), 1994, ApJL 429, L73.
- Udalski et al. (1993) Udalski A., Szymański M., Kaluzny J. et al. (OGLE Coll.), 1993, Act. Astr. 43, 289.
- Udalski et al. (1994) Udalski A., Szymański M., Stanek K.Z. et al. (OGLE Coll.), 1994, Act. Astr. 44, 165.
- Weiner et al. (1999) Weiner B.J and Sellwood J.A., in astro-ph/9904130.
- Zhao et al. (1996) Zhao H., Spergel D.N., Rich R., 1996, MNRAS 282, 175.