X-ray and optical observations of three clusters of galaxies: Abell 901, Abell 1437, and Abell 3570††thanks: Partly based on observations collected at the European Southern Observatory
Abstract
We analyse three clusters of galaxies, Abell 901 (z=0.17), Abell 1437 (z=0.13) and Abell 3570 (z=0.037). They have low to intermediate X-ray fluxes and an irregular morphology in the ROSAT All-Sky Survey (RASS). These clusters are chosen to test the abilities and limitations of the RASS in terms of cluster fluxes and cluster morphologies. Therefore some “worst” cases are used here. X-ray observations with the ROSAT/HRI and optical spectroscopic observations are carried out. The ROSAT/HRI observations, which have a much better spatial resolution than the RASS, reveal in two of the three cases a significantly different morphology than seen in the RASS. The reasons are point sources which could not be resolved in the RASS and were therefore confused with the cluster emission. For A3570 we could confirm the relaxed state of the cluster by the optical determination of a small velocity dispersion. In the cluster with the lowest flux (Abell 901) the countrate measurement is strongly affected by point sources, in the two other cases the countrate measurements of the RASS are reliable, i.e. they are reproduced by the ROSAT/HRI measurement. We conclude that for clusters with a flux of a few times erg/cm2/s or smaller, which show at the same time a non-relaxed morphology, the flux measurement of the RASS can be seriously affected by fore- or background sources. We point out that an all-sky survey of a second ABRIXAS mission would provide a much clearer source distinction for low-flux clusters and thus a much improved countrate determination.
Key Words.:
Galaxies: clusters: individual: Abell 901, Abell 1437, Abell 3570 – intergalactic medium – Cosmology: observations – dark matter – X-rays: galaxies1 Introduction
Clusters of galaxies are excellent probes for cosmological theories. Different cosmological models predict vastly different properties for the clusters as a function of redshift. Therefore relations of cluster properties, their distributions and evolution can be used to constrain cosmological parameters. Selection according to X-ray luminosity is a good way to find the highest mass concentrations because of a relatively well defined correlation between the X-ray luminosity and the total cluster mass (Reiprich & Böhringer 1999; Schindler 1999). A second advantage of high luminosity clusters is, of course, that they require shorter exposure times than their fainter counterparts to get the same numbers of photons. Therefore many X-ray studies have concentrated so far on luminous clusters.
But also low-luminosity clusters are interesting for different reasons. For example, low-luminosity clusters are the links between massive clusters and groups of galaxies. Groups differ in various properties from clusters. Their relation is steeper than the one for clusters (compare Ponman et al. 1996 with Arnaud & Evrard 1999), their gas mass fraction is smaller (compare Pildis et al. 1995 and Ettori & Fabian 1999 or Mohr et al. 1999) and their silicon abundance is lower (Fukazawa et al. 1998). To investigate the physics causing these differences it is important to understand how these properties change with mass or X-ray luminosity.
Low-luminosity clusters are also needed to determine the slope of various relations well. With a long leverage the slope of a relation can be determined more accurately, therefore the luminosities should preferably span several orders of magnitude. For other studies, e.g. the determination of the correlation function or distribution of properties, large samples of clusters are desirable to get the most accurate results. Therefore, when large numbers are required also faint clusters must be taken into account.
| cluster | ROSAT/HRI | ESO3.6m/MEFOS | ||
|---|---|---|---|---|
| exposure time | date | exposure time | date | |
| A901 | 12680 s | 15/05/97 - 01/06/97 | 9000 s | 15/05/96 |
| A1437 | 16210 s | 30/06/97 - 02/07/97 | - | - |
| A3570 | 18860 s | 04/02/98 - 05/02/98 | 5400 s | 15/05/96 |
Nearby low-luminosity clusters sometimes provide problems. Not only is the countrate determination more sensitive to the background subtraction, but also contamination by other fore- and background sources can become critical, in particular when the cluster shows asymmetries and substructure. The degree of source confusion affecting morphological studies and countrate determinations depends on the sensitivity and the resolution of the detector. Already the factor of 5 between the point spread function (PSF) of the ROSAT/PSPC and the ROSAT/HRI can make a big difference, in particular for low-flux clusters (compare the ROSAT/PSPC observation of Cl0939+4713 (Schindler & Wambsganss 1996) and the corresponding ROSAT/HRI observation (Schindler et al. 1998)). In the RASS (Voges et al. 1996) the spatial resolution is even more critical because the source is not always in the centre of the field-of-view, where the detector has the best spatial resolution, like in most pointed observations. But the source is observed at different off-axis angles as the detector scans the sky. The radius including 50% of the photons increases by about a factor of 13 when moving from the centre to the border of the ROSAT/PSPC. As the final image of a source is composed of many PSFs the final 50% radius in the RASS is about 80, i.e. about six times larger than the on-axis PSPC resolution (depending also on the energy).
Clusters which have low fluxes because they are far away, are also very interesting, in particular for cosmological applications. But their extent in the sky is much smaller than for nearby clusters and thus they are less affected by source confusion. Therefore, we concentrate this investigation on nearby clusters with low to intermediate luminosity.
Three clusters – A901, A1437 and A3570 – were selected for a detailed look with the high resolution of the ROSAT/HRI and for optical observations. Each of the clusters shows irregular structure in the RASS. This investigation does of course not show representative RASS clusters, but it is a “worst-case” study. For RASS clusters with high flux and/or regular shape countrate determination and morphological analyses are straightforward and reliable.
The paper is organised as follows. After a description of the observations (Sect. 2) we present the analysis of the optical data in Sect. 3 and the analysis of the X-ray data in Sect. 4. Finally, Sect. 5 gives our summary and conclusions. Throughout this paper we use km/s/Mpc and .
2 Observations
Three clusters were selected which have low to intermediate X-ray luminosity and show at the same time a very irregular structure in the RASS: A901, A1437, and A3570 (the RASS images will be published by Böhringer et al.). For this analysis X-ray and optical observations were conducted. The X-ray observations were carried out with the ROSAT/HRI (Trümper 1983) and analysed with EXSAS. The optical observations consist of spectra taken with MEFOS (Felenbok et al. 1997) at the ESO3.6m telescope. The analysis of the spectra was carried out with Figaro. The spectra determine the distance of the cluster in the case of A901 and for A3570 a velocity distribution. Details of the optical and X-ray observations are listed in Table 1.
3 Optical analysis
For two of the clusters – A901 and A3570 – optical spectra could be taken. In A901 redshifts of three galaxies could be well determined. These three galaxies are at similar redshifts (see Table 2). We derive a cluster redshift of . Unfortunately, the number of galaxies is not sufficient to estimate the velocity distribution.
In A3570 we found 17 cluster member galaxies (see Table 2) in addition to the three galaxies known previously (Postman & Lauer 1995). From these 20 galaxies we derive a cluster redshift (very similar to the redshift 0.0372 by Abell et al. 1989). The velocity distribution is shown in Fig 1. The velocity dispersion based on these 20 galaxies km/s is relatively small. Such a small velocity dispersion is a first hint for a virialised state of the cluster. If merging of subclusters would take place and not all of the mergers would happen perpendicular to the line-of-sight a broad velocity distribution would be expected. Assuming virial equilibrium we estimate the cluster mass from the velocity dispersion and the estimate of the virial radius by Girardi et al. (1998) to .
| cluster | (J2000) | (J2000) | redshift |
| A901 | 09 54 57.5 | -10 11 50 | 0.171 |
| 09 55 38.2 | -10 10 19 | 0.169 | |
| 09 56 53.2 | -10 10 14 | 0.164 | |
| A3570 | 13 45 17.2 | -38 10 21 | 0.0372 |
| 13 45 46.0 | -37 56 45 | 0.0406 | |
| 13 45 49.7 | -37 37 18 | 0.0365 | |
| 13 46 09.9 | -38 00 01 | 0.0364 | |
| 13 46 18.5 | -38 20 18 | 0.0405 | |
| 13 46 54.0 | -37 51 48 | 0.0376 | |
| 13 47 04.1 | -38 03 57 | 0.0348 | |
| 13 47 08.9 | -37 55 23 | 0.0366 | |
| 13 47 11.7 | -38 07 33 | 0.0379 | |
| 13 47 23.9 | -37 51 00 | 0.0390 | |
| 13 47 27.3 | -37 57 54 | 0.0390 | |
| 13 47 45.8 | -37 50 41 | 0.0376 | |
| 13 47 51.0 | -38 00 52 | 0.0383 | |
| 13 47 57.5 | -37 56 29 | 0.0373 | |
| 13 48 07.2 | -38 16 47 | 0.0346 | |
| 13 48 38.2 | -37 43 41 | 0.0355 | |
| 13 49 12.0 | -37 55 54 | 0.0370 |

4 X-ray analysis
4.1 Abell 901
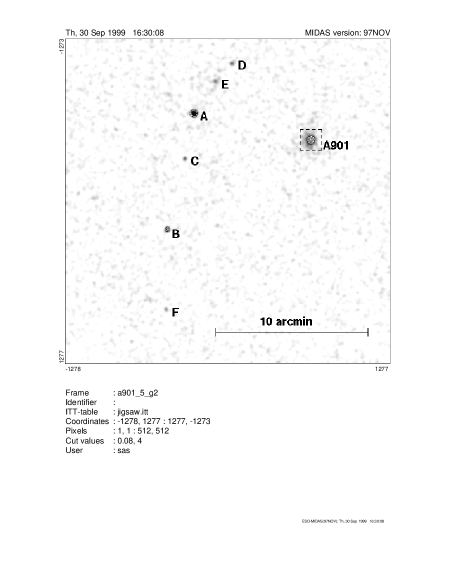
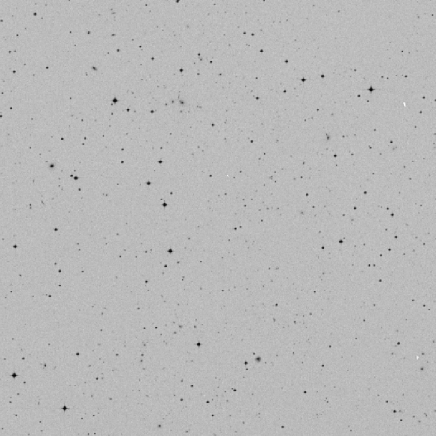
A ROSAT/HRI image of a 21 region around A901 shows several sources (Fig. 2). A901 turns out to have a very compact structure contrary to the previous conclusion from the RASS. Ebeling et al. (1996) list A901 as a double cluster. Their so-called “brighter subcluster” turns out to be a number of point-like sources, while the true cluster emission is what they call the “fainter subcluster”. In Fig. 2a six X-ray point sources with a signal-to-noise ratio of at least 3 are indicated. For three of them optical counterparts can be found on ROE/NRL COSMOS finding charts (see Fig. 2b and Table 4). Unfortunately, for none of these counterparts optical spectra could be taken because the optical observations were carried out before the X-ray observations. At the position of A902 ( West of F) no X-ray emission can be detected.
The optical centre of A901 determined by Abell et al. (1989) is located between the X-ray position of A901 and source A. To test the extent of the X-ray emission of A we derive an X-ray profile (see Fig. 4a). The profile is compared with the on-axis PSF of the ROSAT/HRI. The profile of A is only slightly more extended than the on-axis PSF, which is expected for a point source 6 away from the pointing position. Therefore, we conclude that most likely the X-ray emission from A is point-like and therefore not (sub-)cluster emission, but probably emission from an active nucleus in the centre of a galaxy. The most likely candidate for this AGN is a galaxy of 16.6m in B (see Table 4). This galaxy is located at a distance of 5 from the cluster emission – a distance smaller than the pointing accuracy of ROSAT.
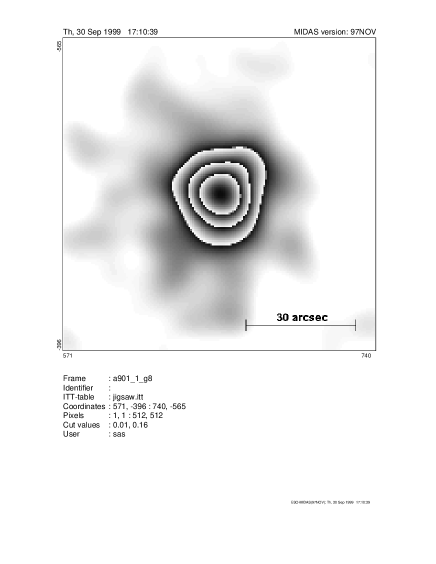
The only cluster emission is coming from the region indicated by “A901” in Fig. 2a (, ). This emission is shown magnified in Fig. 3 on a scale of 1.4. The emission is very compact, but not point-like, as can be clearly seen from the comparison of the cluster profile and PSF (see Fig. 4a). A -model fit to the cluster profile (Cavaliere & Fusco-Femiano 1976; Jones & Forman 1984) reveals an extremely small core radius of or kpc (see also Table 5) reflecting the compactness of the emission.
|
|
The X-ray emission of A901 can be traced out to a radius of almost 2, corresponding to 430 kpc. Within this radius a countrate of cts/s is found. If the emission of A901 and the 6 point sources is summed up, the total countrate is at least a factor 1.8 larger than the cluster countrate, i.e. the cluster countrate would be largely overestimated if the point sources were not resolved. For the flux and luminosity shown in Table 5 only the cluster emission of A901 was used.
Estimating a temperature of 4 keV from relations (Allen & Fabian 1998; Markevitch 1998; Arnaud & Evrard 1999) and assuming hydrostatic equilibrium we estimate the total mass at the outer radius kpc. The gas mass is kpc, i.e. the gas mass fraction is about 13%.
Obviously, A901 with a flux of -keVerg/s/cm2 is falsely in the RASS X-ray brightest Abell cluster sample of Ebeling et al. (1996) as this sample has a flux limit of erg/s/cm2. Ebeling et al. list a flux of erg/s/cm2 for the “brighter subcluster”, which is in reality not cluster emission. For the “fainter subcluster”, which is the true A901 emission, they list correctly erg/s/cm2, but this value is far below their flux limit.
The compact (but not point-like) nature of the X-ray emission ( kpc) could be interpreted as emission from a galaxy or from a group of galaxies. But a comparison of X-ray luminosity and blue luminosity of the central galaxy (16m in B) shows that A901 lies far above the relation for early-type galaxies found by Eskridge et al. (1995) and Irwin & Sarazin (1998). A group of galaxies can also be excluded, not only because the X-ray luminosity is too high, but also from the gas mass fraction. The gas mass fraction of 13% is typical for a normal cluster (Ettori & Fabian 1999, Schindler 1999), and would be too high for a group of galaxies (e.g. Pildis et al. 1995). An estimate of the central cooling time yields about years. Therefore it is possible, that the compact X-ray emission is caused by a cooling flow.

|

|
4.2 Abell 1437
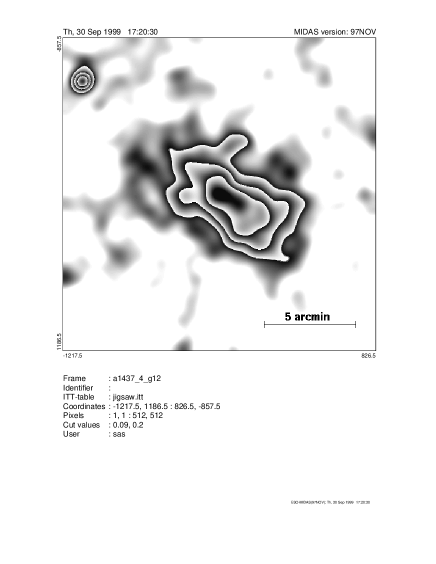
The cluster A1437 at a redshift z=0.1339 (Struble & Rood 1987) is the most X-ray luminous cluster of this sample. The cluster centre in X-rays (see Table 5) does not coincide with the optical position: Abell et al. (1989) determined a position 45 in the SE of the X-ray maximum. The emission of the cluster is strongly elongated in SW-NE direction (see Fig. 5). This elongation can be seen as well in the RASS. The RASS distinguishes also easily the point source in the NE, for which an optical counterpart can be found on APM finding charts (see Table 4). Although the cluster shape is not exactly elliptical, we fit ellipses to the isophotes (Bender & Moellenhof 1987) to estimate the elongation. The position angle varies around (N over E). The minimum axis ratio of 0.38 is reached at 0.01 cts/s/arcmin2. At this level the centre of the ellipse is shifted 35 to the west and 36 to the south with respect to the position of the X-ray maximum.
The fit parameters of the surface brightness profile are not well constrained (see Table 5) because of the non-spherical morphology of the cluster. Therefore, radial profiles of the cluster emission are determined in four different sectors using as centre the X-ray maximum listed in Table 3 and subsequently fitted with models (see Fig. 4b). The two central bins show some excess emission. This excess cannot come from a cooling flow because the central cooling time is about years. It is probably a small contamination by an AGN. Because of this excess we try to fit the overall profile with and without these two bins. The results are listed in Table 3. In both – the fit parameters and the fit curves – it is obvious, that the cluster is very asymmetric.
Such asymmetries can arise during a merger of subclusters. From combined N-body and hydrodynamic simulations it is known that such elongated morphologies are common shortly after the collision of two subclusters, when the intra-cluster gas is squeezed out perpendicular to the collision axis (Schindler & Müller 1993).
| region | sector | inner radius | |||
|---|---|---|---|---|---|
| (N over E) | (arcmin [kpc]) | ( counts/arcmin2/s) | (arcmin [kpc]) | ||
| all | 0 | 1.2 | 2.8 [520] | 0.63 | |
| all | 0.5 [90] | 1.2 | 3.7 [700] | 0.80 | |
| NE | 0 | 1.2 | 2.5 [470] | 0.57 | |
| NE | 0.5 [90] | 1.1 | 3.7 [700] | 0.77 | |
| SE | 0 | 1.5 | 0.7 [140] | 0.35 | |
| SE | 0.5 [90] | 2.4 | 0.3 [ 50] | 0.32 | |
| SW | 0 | 1.4 | |||
| SW | 0.5 [90] | 1.4 | |||
| NW | 0 | 1.1 | 2.7 [500] | 0.75 | |
| NW | 0.5 [90] | 1.1 | 2.8 [530] | 0.79 |
The X-ray emission can be traced out to about 9. After excluding the point source in the NE a countrate of cts/s is found. This corresponds to a flux of -keVerg/s/cm2. For A1437, which is the most luminous cluster of this sample, the flux determination from the RASS (-keVerg/s/cm2 (Ebeling et al. 1996) and -keVerg/s/cm2 (Ebeling et al. 1998), respectively) is reliable. Also the morphological determination from the RASS is good: the point source in the NE can be distinguished easily and the elongated shape of the cluster is visible in the RASS as well.
4.3 Abell 3570
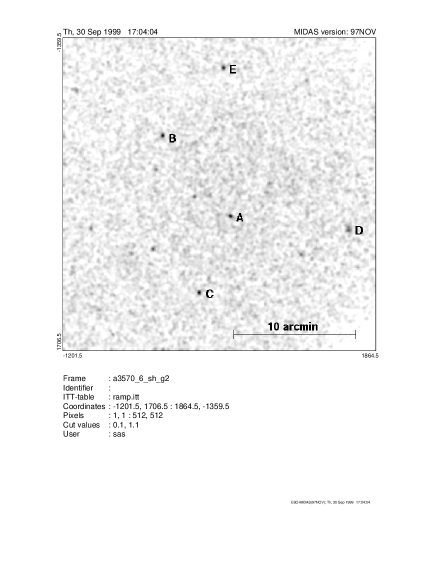
The cluster A3570 is the nearest cluster of this sample (). The X-ray emission is faint and the extent is of the same order as the field-of-view of the ROSAT/HRI. With small smoothing the cluster X-ray emission is hardly visible, because the region is dominated by discrete sources (see Fig. 6a and Table 4). One of the sources (D) is not point-like but has a small extent. This source can be identified with the galaxy ESO 325 - G016 – a cluster galaxy at redshift of (Postman & Lauer 1995).
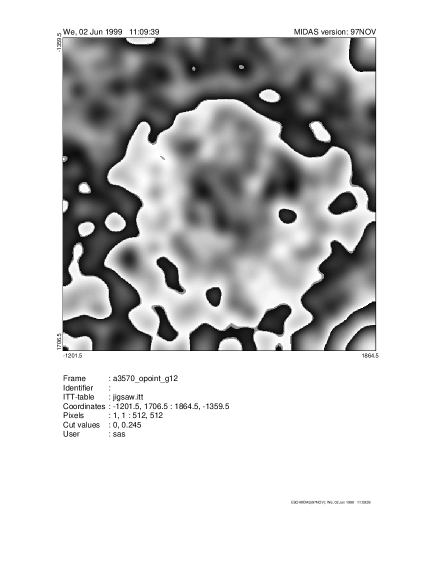
To make the cluster emission visible we remove all point sources, which have a signal-to-noise ratio of at least 3 above the surrounding cluster emission, by fitting a warped surface to the pixels surrounding the point source region and apply a much coarser smoothing (see Fig. 6b). The cluster emission is extended and regular. There is no significant sign of subclustering or merging, i.e. the complex structure seen in the RASS disappears on resolving the discrete sources. Therefore, A3570 is very likely a relaxed cluster. Fitting the profile for this cluster is not possible because the profile is so shallow.
|
|
| pointing | source | (J2000) | (J2000) | HRI count rate | identification |
| A901 | A | 09 56 28.2 | -09 57 15 | 0.039 | galaxy 17m(blue) |
| B | 09 56 35.4 | -10 04 53 | 0.006 | - | |
| C | 09 56 30.6 | -10 00 12 | 0.001 | star 14m(blue) | |
| D | 09 56 18.1 | -09 53 57 | 0.002 | - | |
| E | 09 56 22.3 | -09 55 07 | 0.002 | star 15m(blue) or galaxy 17m(blue) | |
| F | 09 56 35.6 | -10 10 08 | 0.001 | - | |
| A1437 | A | 12 00 55.7 | 03 26 58 | 0.007 | galaxy 16m(red) |
| A3570 | A | 13 47 12.5 | -37 57 15 | 0.002 | - |
| B | 13 47 40.7 | -37 50 38 | 0.002 | - | |
| C | 13 47 25.6 | -38 03 30 | 0.002 | - | |
| D | 13 46 23.3 | -37 58 21 | 0.001 | ESO 325 - G016 | |
| E | 13 47 15.5 | -37 45 06 | 0.002 | - |
Because of the large extent of the cluster the image had to be vignetting corrected for the countrate determination (Snowdon 1998). The countrate determination is difficult, because the cluster emission fills probably the whole field-of-view of the HRI. We estimate the countrate to be cts/s by counting all the photons within (corresponding to 250 kpc), excluding the discrete sources and using a standard ROSAT/HRI background. Out to this radius we can clearly trace the X-ray emission, but probably the cluster extends further beyond the field-of-view. Therefore, we estimate the upper limit of the countrate by adding the photons found beyond this radius north and east of the cluster and assume the same number in the south and west, which is not covered by the detector. The lower limit is obtained by using the background at the border of the field-of-view, which is a very conservative estimate. For flux and luminosity see Table 5.
The discrete sources change the cluster morphology drastically by feigning substructure in the RASS image. But they do not contribute significantly to the countrate. We estimate the countrate of the discrete sources by fitting a warped surface to the pixels surrounding the point source region and subtract these fitted counts from the original counts. The discrete sources together have a very small count rate of about 0.01 cts/s, which is negligible compared to the cluster emission.
For the X-ray luminosity -keVerg/s the velocity dispersion 0 km/s is relatively low. While a temperature of 4 keV is consistent with the relations, the relations predict only 2 keV (White et al. 1997; Mushotzky & Scharf 1997, Wu et al. 1999). The small velocity dispersion confirms the conclusion from the ROSAT/HRI observation, that A3570 is a regular, non-merger cluster.
| cluster | A901 | A1437 | A3570 | |
| position (J2000) | 09 55 57.0 | 12 00 25.7 | 13 47 16.1 | |
| -09 58 59 | +03 20 50 | -37 56 28 | ||
| HRI countrate | [cts/s] | |||
| luminosity (0.1-2.4 keV) | [ erg/s] | |||
| flux (0.1-2.4 keV) | [ erg/cm2/s] | |||
| luminosity (bolometric) | [ erg/s] | |||
| [cts/s/arcmin2] | 0.27 | 0.012 | - | |
| - | ||||
| [arcmin] | - | |||
| [kpc] | - | |||
| redshift | 0.17 | 0.13 | 0.037 | |
| velocity dispersion | [km/s] | - | - | 460 |
| [cm-2] | 0.51 | 0.19 | 0.44 |
5 Conclusions
We analysed three clusters of galaxies with low to intermediate X-ray luminosities which show an irregular appearance in the ROSAT All-Sky Survey. As the confusion with fore- and background sources is increasingly critical with decreasing flux and increasing substructure of the cluster, we test the limitations of the RASS. With only three clusters, of course, this cannot be a statistical study, but it is meant to be a “worst-case” study. We would like to stress that for higher fluxes source confusion is less important and that for clusters with these fluxes the RASS results are very reliable.
The results of the follow-up observations – X-ray observations with the ROSAT/HRI and optical spectroscopic observations – are summarized in Table 5. The ROSAT/HRI observations, which have a much better spatial resolution than the RASS, revealed in two of the three cases a different morphology than seen in the RASS. The reasons are point sources which could not be resolved in RASS and were therefore confused with the cluster emission. In one of the three clusters the countrate measurement is affected by the point sources, in the two other cases the countrate measurements of the RASS are reliable. The results for the three clusters are the following:
-
•
Abell 901: With a flux of -keVerg/cm2/s this cluster is the faintest one in the sample. Both the measurement of the countrate and the determination of the morphology provide difficulties in the RASS. Several discrete sources cannot be distinguished from the cluster emission in the RASS. With the RASS information only it was concluded that this cluster consists of two subclumps (Ebeling et al. 1996), while the true cluster X-ray emission is very compact (kpc). The countrate would be overestimated by at least 80% if the discrete sources cannot be separated from the cluster.
-
•
Abell 1437: This cluster has the highest flux of all the clusters in the sample -keVerg/cm2/s. With such a high flux the RASS results are very reliable. There is no problem with the countrate or morphology determination. The point source in the NE of the cluster can easily be distinguished in the RASS.
-
•
Abell 3570: This cluster has several point sources superposed on the cluster emission. Although the countrate determination is not affected by these sources (their countrate is only 1% of the cluster countrate) the true morphology is very regular in contrast to the impression from the RASS. Optical measurements of the cluster galaxies give a very small velocity dispersion confirming the picture of a relaxed cluster.
We conclude that for clusters with fluxes less than a few times erg/cm2/s, which have at the same time an irregular morphology, the confusion with fore- and background sources can be a problem in the RASS. So morphological analyses of RASS clusters tend to overestimate the fraction of clusters with substructure.
A new X-ray all-sky survey with a potential second ABRIXAS (Friedrich et al. 1996) mission would have several advantages to push this source confusion limit down.
-
•
The spatial resolution of ABRIXAS is about 2.5 times better than the resolution of the RASS, which makes it easier to distinguish between point and extended sources.
-
•
The energy range of ABRIXAS (0.5-12 keV) is much better suited for clusters than the ROSAT range (0.1-2.4 keV). Although both surveys have about the same sensitivity at 1 keV, ABRIXAS with its harder energy range would detect 3-5 times more photons from a standard cluster.
-
•
The spectral resolution of ABRIXAS is better than that of the ROSAT/PSPC. Together with the wider energy range of ABRIXAS this provides an improved possibility to separate hard cluster emission from soft foreground sources.
Acknowledgements.
I thank Chris Collins for introducing me into the secrets of optical spectra, Hans Böhringer for making the RASS images of the three clusters available to me, Peter Friedrich for providing the ABRIXAS numbers, and Phil James and Joachim Wambsganss for carefully reading the manuscript. It is a pleasure to thank Carlo Izzo for his most helpful EXSAS support. I acknowledge gratefully the hospitality of the Institut d’Estudis Espacials de Catalunya in Barcelona. During the stay there I was supported by the TMR grant ERB-FMGE CT95 0062 by CESCA-CEPBA.References
- (1) Abell G.O., Corwin H.G., Olowin R.P., 1989, ApJS 70, 1
- (2) Allen S.W., Fabian A.C., 1998, MNRAS 297, L57
- (3) Arnaud M., Evrard A.E., 1999, MNRAS 305, 631
- (4) Bender R., Moellenhof C., 1987, A&A 177, 71
- (5) Cavaliere A., Fusco-Femiano R., 1976, A&A 49, 137
- (6) Dickey J.M., Lockman F.J., 1990, ARA&A 28, 215
- (7) Ebeling H., Voges W., Böhringer H., Edge A.C., Huchra J.P., Briel U.G., 1996, MNRAS 281, 799
- (8) Ebeling H., Edge A.C., Böhringer H., Allen S.W., Crawford C.S., Fabian A.C., Voges W., Huchra J.P., 1998, MNRAS 301, 881
- (9) Eskridge P.B., Fabbiano G., Kim D.-W., 1995, ApJS 97, 141
- (10) Ettori S., Fabian A.C., 1999, MNRAS 305, 834
- (11) Felenbok P., Gúerin J., Fernandez A., Cayatte V., Balkowski C., Kraan-Korteweg R.C., 1997, Experimental Astronomy 7, 65
- (12) Friedrich P., Hasinger G., Richter G., et al., 1996, in: proceedings of the conference ”Röntgenstrahlung from the universe”, MPE Report 263, H.U. Zimmermann, J.E. Trümper, H. Yorke (eds.), p. 681
- (13) Fukazawa Y., Makishima K., Tamura T., Ezawa H., Xu H., Ikebe Y., Kikuchi K., Ohashi T., 1998, PASJ 50, 187
- (14) Girardi M., Giuricin G., Mardirossian F., Mezzetti M., Boschin W., 1998, ApJ 505, 74
- (15) Irwin J.A., Sarazin C.L., 1998, ApJ 499, 650
- (16) Jones C., Forman W., 1984, AJ 276, 38
- (17) Pildis R.A., Bregman J.N., Evrard A.E., 1995, ApJ 443, 514
- (18) Ponman T.J., Bourner P.D.J., Ebeling H., Böhringer H., 1996, MNRAS 283, 690
- (19) Postman M., Lauer T.R., 1995, ApJ 440, 28
- (20) Markevitch M., 1998, ApJ 504, 27
- (21) Mohr J.J., Mathiesen B., Evrard A.E., 1999, ApJ 517, 627
- (22) Mushotzky R.F., Scharf C.A., 1997, ApJ 482, L13
- (23) Reiprich T.H., Böhringer H., 1999, in: Proceedings of the 4th ASCA Symposium on Heating and Acceleration in the Universe held in Tokyo, Japan, Inoue H., Ohashi T., Takahashi T. (eds.), in press
- (24) Schindler S., 1999, A&A 349, 435
- (25) Schindler S., Müller E., 1993, A&A 272, 137
- (26) Schindler S., Wambsganss J., 1996, A&A 313, 113
- (27) Schindler S., Belloni P., Ikebe Y., Hattori M., Wambsganss J., Tanaka Y., 1998, A&A, 338, 843
- (28) Snowden S.L., 1998, ApJS 117, 233
- (29) Struble M.F., Rood H.J., 1987, ApJS 63, 543
- (30) Trümper J., 1983, Adv. Space Res. 2, 142
- (31) Voges W., Boller T., Dennerl K., et al., 1996, in: Proceedings of the workshop Röntgenstrahlung from the universe, held in Würzburg, Germany, Zimmermann H.U., Trümper J.E., Yorke H. (eds.), MPE Report 263, p. 637
- (32) White D.A., Jones C., Forman W., 1997, MNRAS 292, 419
- (33) Wu X.-P., Xue Y.-J., Fang L.-Z., 1999, astro-ph/9905106