The Stellar Population Histories of Local Early-Type Galaxies. I. Population Parameters
Abstract
This paper commences a series of investigations into the stellar populations of local elliptical galaxies as determined from their integrated spectra. The goal of the series is to determine the star formation and chemical evolution histories of present-day elliptical galaxies. The primary galaxy sample analyzed is that of González (1993, G93), which consists of 39 ellipticals drawn primarily from the local field and nearby groups, plus the bulge of Messier 31. Single-stellar-population (SSP) equivalent ages, metallicities, and abundance ratios are derived from , , and line strengths using an extension of the Worthey (1994) models that incorporates non-solar line-strength “response functions” by Tripicco & Bell (1995). These functions account for changes in the Lick/IDS indices caused by non-solar abundance ratios, allowing us to correct the Worthey (1994) models for the enhancements of Mg and other -like elements relative to the Fe-peak elements.
SSP-equivalent ages of the G93 ellipticals are found to vary widely, Gyr, while metallicities and enhancement ratios, are strongly peaked around and (in an aperture of radius ). The enhancement ratios are milder than previous estimates, owing to the application of non-solar abundance corrections to both and for the first time. While is usually , it is not the “E” elements that are actually enhanced but rather the Fe-peak elements that are depressed; this serves not only to weaken but also to strengthen , accounting for the overall generally mild enhancements. Based on index strengths from the Lick/IDS galaxy library (Trager et al. (1998)), C is not depressed with Fe but rather seems to be on a par with other elements such as Mg in the “E” group. Gradients in stellar populations within galaxies are found to be mild, with SSP-equivalent age decreasing by 25%, metallicity decreasing by dex, and remaining nearly constant out to an aperture of radius for nearly all systems.
Our ages have an overall zeropoint uncertainty of at least due to uncertainties in the stellar evolution prescription, the oxygen abundance, the effect of on the isochrones, and other unknowns. However, the relative age rankings of stellar populations should be largely unaffected by these errors. In particular, the large spread in ages appears to be real and cannot be explained by contamination of by blue stragglers or hot horizontal branch stars, or by fill-in of by emission. Correlations between these derived SSP-equivalent parameters and other galaxy observables will be discussed in future papers.
Subject headings:
galaxies: elliptical and lenticular, cD — galaxies: stellar content — galaxies: abundances — galaxies: evolution1. Introduction
This paper is the first in a series on the stellar populations of local field and group elliptical galaxies based on the high-quality spectral data of González (1993; G93). The present paper concentrates on deriving improved stellar population parameters by correcting existing population models for the effects of non-solar abundance ratios. The major roadblock to population synthesis models of elliptical galaxies is the fact that the effects of age and metallicity are nearly degenerate in the spectra of old stellar populations (Faber (1972), 1973; O’Connell (1980); Rose (1985); Renzini (1986)). However, it was early noted that certain spectral features are more sensitive to age than metallicity (e.g., the Balmer lines [O’Connell (1980); Rabin (1982); Burstein et al. (1984); Rose (1985)], and Sr II 4077 [Rose (1985)]), and hope grew that such features might be able to break the degeneracy if accurately calibrated. (At about the same time, several workers were also using Balmer lines to discover strong bursts of star formation in so-called “E+A” or “post-starburst” galaxies [Dressler and Gunn (1983); Couch & Sharples (1987); Schweizer et al. (1990)], but these applications always implicitly assumed solar metallicity.)
Our ability to decouple age and metallicity in integrated spectra has greatly improved over the last decade, due to three developments. In the late 1980’s, interior models of super-solar-metallicity stellar evolution became available (e.g., VandenBerg (1985), VandenBerg & Bell (1985), VandenBerg & Laskarides (1987); Bertelli et al. (1994)). Next, the Lick/IDS stellar absorption-line survey provided empirical polynomial fitting functions for a set of standardized absorption-line indices as a function of stellar temperature, gravity, and metallicity (Gorgas et al. (1993); Worthey et al. (1994)). Finally, an extensive grid of theoretical model atmospheres and stellar flux distributions was provided by Kurucz (1992) for stars over a wide range of temperatures and metallicities. With these three ingredients, it finally became possible to compute absorption-line strengths from first principles for single-burst stellar populations (SSPs) of a given age and metallicity (Worthey (1992), 1994).
Using such models, Worthey showed that the age-metallicity degeneracy was actually worse than suspected: a factor of two uncertainty in the metallicity of a galaxy mimics a factor of three uncertainty in its age at fixed color or metal-line strength, the so-called “3/2 law”. The law implies that such commonly used “age” indicators as colors and metal-line strengths are by themselves useless (although they still are widely used). At the same time, the Worthey models also provided a quantitative tool to break the degeneracy (see also Worthey & Ottaviani (1997)). A Balmer index plotted versus a metal line (or color) yields a two-dimensional theoretical grid; the equivalent single-burst age and metallicity for a population can be read off from its location in this grid. Tests of the method on composite stellar populations will be demonstrated in Trager et al. (1999; Paper II), where it is shown that these single-stellar-population (SSP) equivalent parameters correspond approximately to the luminosity-weighted vector addition of populations in the index diagrams. A galaxy’s age determined from its integrated spectrum is thus quite sensitive to recent star formation, and hence to the epoch and strength of its last major dissipative merger or accretion event.
While Worthey models validated use of the Balmer lines, they also showed that extremely accurate Balmer data would be needed. To our knowledge, the line-strength data of González (1993) are still the only published data on a diversified sample of local E galaxies that are adequate for this purpose. Applying early Worthey models to his data, González found that blue, weak-lined ellipticals in his sample tended to have young ages, while red, strong-lined ellipticals had older ages. In contrast, the metallicity spread was fairly small, less than a few tenths of a dex. This result seemed to imply (G93, Faber et al. (1995)) that age was the major cause of the well known color/line-strength relation in the G93 sample, not metallicity as in the classic picture (Baum (1959); McClure & van den Bergh (1968); Spinrad & Taylor (1971); Faber (1972), 1973). The large age spread in G93 galaxies was later confirmed by Trager (1997) and by Tantalo, Chiosi & Bressan (1998a; TCB98) using later stellar population models.
Excellent line strengths have also been measured for E and S0 galaxies in the Fornax cluster by Kuntschner & Davies (1998) and Kuntschner (1998). Fornax turns out to be the reverse of the G93 sample in showing a larger spread in metallicity than age; the dense cluster environment of Fornax may be the key difference. A goal of the present series of papers is to explore the relative importance of age versus metallicity in driving the color and line strength relations of ellipticals in different environments (see Paper II).
Although the data of G93 shed hope on solving the age vs. metallicity problem, they brought another simmering problem to the fore, namely, non-solar abundance ratios. Enhancement of Mg relative to Fe had been suggested by O’Connell (1976) and Peletier (1989) and shown to be widespread in the Lick/IDS ellipticals by Worthey, Faber & González (1992). However, the high-quality data of G93 offered a great improvement for hard-to-measure weak Fe lines, and, using them, Trager (1997) showed that metallicities deduced from Mg were indeed considerably higher than those deduced from Fe. Other elements such as Na, C, N, and possibly O are also probably enhanced in giant ellipticals (Worthey (1998)). Because the Worthey models are not designed for non-solar abundance ratios, applying them to different metal line features in elliptical spectra gives inconsistent ages and, especially, abundances. The progress promised by the G93 data thus suddenly came to a full stop.
The present paper addresses the problem of non-solar abundance ratios in a rough but hopefully satisfactory way. On the one hand, the general effects of non-solar ratios on evolutionary isochrones are now beginning to be understood (Salaris, Chieffi & Straniero (1993); Weiss, Peletier & Matteucci (1995); Salaris & Weiss (1998); Bressan, priv. comm.; see Tantalo, Chiosi & Bressan 1998a ). Second, the responses of nearly all the Lick/IDS indices to non-solar element ratios have been modeled by Tripicco and Bell (1995; TB95). The latter prove crucial, and it is really these responses that open the way forward. Using both inputs, reasonable corrections to the W94 indices for non-solar ratios can be estimated for the first time. The corrected models are used here to derive three SSP-equivalent population parameters for each galaxy—age, mean metallicity, and mean element “enhancement ratio.” Future papers will use these parameters to study stellar populations as a function of galaxy type, determine correlations among age, metallicity, enhancement, and other variables, and measure radial population gradients.
Other groups (Weiss, Peletier & Matteucci (1995); Greggio (1997); Trager (1997)) have also attempted to interpret G93 data in terms of non-solar abundance ratios, but their approaches were more ad hoc. Inferred metallicities and enhancements both tend to be larger than what we find here. The most similar analysis so far is by Tantalo, Chiosi & Bressan (1998a; TCB98), building on previous work by that group (Bressan, Chiosi, & Tantalo (1996)). However, these authors use different response functions from ours (and in fact do not correct the Fe index at all for non-solar ratios). Their results consequently differ, and a section is devoted to comparing our results to their work (Sec. 6.1).
We note briefly that Balmer-line equivalent widths might be spuriously contaminated by light from blue horizontal-branch (BHB) stars or blue straggler stars (BSS) (e.g., Burstein et al. (1984); Lee (1994); Faber et al. (1995); Trager (1997)). These possibilities are discussed in Section 5.1. To anticipate the conclusions, we believe that current data do not support the existence of large numbers of BHB and BSS stars in giant elliptical galaxies, and we thus conclude that the SSP-equivalent ages derived here for both young and old ellipticals must be substantially correct. Likewise, reduction of Balmer indices by emission fill-in, though present, cannot change the derived ages very much. Thus, despite efforts, we have been unable to find any explanation for the wide range of Balmer line strengths in the G93 galaxies other than a wide range of SSP-equivalent ages. This is our principal conclusion.
The outline of this paper is as follows: Section 2 presents absorption-line data for the G93 galaxies. Section 3 presents a brief description of the Worthey (1994) models; their extension to non-solar abundance ratios using the results of TB95; the final choice of elements for inclusion in the enhanced element group; the method for determining the stellar population parameters from the models; and the final population parameters for the G93 sample. Section 4 briefly presents the parameters for the G93, both central and global, and their distributions. Section 5 discusses the assumptions, in particular the use of as an age indicator, and examines all known uncertainties in the age, metallicity, and abundance-ratio scales and zeropoints. Section 6 presents evidence from other absorption-line strength studies for the presence of intermediate-age stellar populations in elliptical galaxies; it also compares in detail our results to those of TCB98. Two appendices discuss the effect of changing isochrones in the models and the effect of using different prescriptions for emission and velocity dispersion corrections to .
2. Data
2.1. The galaxy sample
| Type | Type | Other | ||||
|---|---|---|---|---|---|---|
| Name | (RC3) | (CA) | () | names | ||
| NGC 221 | cE2 | cE2 | 00:42:41.9 | 40:51:52 | M32 | |
| NGC 224 | SA(s)b | Sb | 00:42:44.2 | 41:16:08 | M31 | |
| NGC 315 | E: | 00:57:48.9 | 30:21:09 | |||
| NGC 507 | SA(r)0 | 01:23:39.8 | 33:15:23 | |||
| NGC 547 | E1 | 01:26:00.7 | 01:20:44 | |||
| NGC 584 | E4 | S01(3,5) | 01:31:20.7 | 06:52:06 | ||
| NGC 636 | E3 | E1 | 01:39:06.5 | 07:30:46 | ||
| NGC 720 | E5 | E5 | 01:53:00.4 | 13:44:18 | ||
| NGC 821 | E6? | E6 | 02:08:21.0 | 10:59:44 | ||
| NGC 1453 | E2-3 | E0 | 03:46:27.2 | 03:58:09 | ||
| NGC 1600 | E3 | E4 | 04:31:39.9 | 05:05:10 | ||
| NGC 1700 | E4 | E3 | 04:56:56.3 | 04:51:52 | ||
| NGC 2300 | SA0 | E3 | 07:32:22.0 | 85:42:27 | ||
| NGC 2778 | E | 09:12:24.4 | 35:01:38 | |||
| NGC 3377 | E5–6 | E6 | 10:47:41.6 | 13:59:00 | ||
| NGC 3379 | E1 | E0 | 10:47:49.5 | 12:34:57 | M105 | |
| NGC 3608 | E2 | E1 | 11:16:58.7 | 18:08:57 | ||
| NGC 3818 | E5 | E5 | 11:41:57.5 | 06:09:21 | ||
| NGC 4261 | E2-3 | E3 | 12:19:23.2 | 05:49:31 | ||
| NGC 4374 | E1 | E1 | 12:25:03.7 | 12:53:14 | M84 | |
| NGC 4472 | E2 | E1/S01(1) | 12:29:46.5 | 07:59:48 | M49 | |
| NGC 4478 | E2 | E2 | 12:30:17.4 | 12:19:44 | ||
| NGC 4489 | E | 12:30:52.2 | 16:45:31 | |||
| NGC 4552 | E | S01(0) | 12:35:39.9 | 12:33:25 | M89 | |
| NGC 4649 | E2 | S01(2) | 12:43:39.7 | 11:33:09 | M60 | |
| NGC 4697 | E6 | E6 | 12:48:35.8 | 05:48:00 | ||
| NGC 5638 | E1 | E1 | 14:29:40.4 | 03:14:04 | ||
| NGC 5812 | E0 | E0 | 15:00:57.0 | 07:27:19 | ||
| NGC 5813 | E1–2 | E1 | 15:01:11.2 | 01:42:08 | ||
| NGC 5831 | E3 | E1 | 15:04:07.2 | 01:13:15 | ||
| NGC 5846 | E0-1 | E4/S01(4) | 15:06:29.3 | 01:36:21 | ||
| NGC 6127 | E | 16:19:11.9 | 57:59:03 | NGC 6125/6128 | ||
| NGC 6702 | E: | 18:46:57.6 | 45:42:20 | |||
| NGC 6703 | SA0 | 18:47:18.9 | 45:33:02 | |||
| NGC 7052 | E | 21:18:32.9 | 26:26:48 | B2 211626 | ||
| NGC 7454 | E4 | 23:01:06.6 | 16:23:24 | |||
| NGC 7562 | E2–3 | 23:15:57.4 | 06:41:16 | |||
| NGC 7619 | E | E3 | 23:20:14.7 | 08:12:23 | ||
| NGC 7626 | E pec: | E1 | 23:20:42.4 | 08:13:02 | ||
| NGC 7785 | E5-6 | S01(5)/E5 | 23:55:19.1 | 05:54:53 |
Note. — Col. (1): Galaxy name. Col. (2): Morphological type from RC3. Col. (3): Morphological type from Carnegie Atlas (Sandage & Bedke 1994) or RSA (Sandage & Tammann 1987). Cols. (4)–(5): Position (J2000.0) from NED. Col. (6): Heliocentric radial velocity from González (1993). Col. (7): Other galaxy names.
The G93 galaxy sample was not selected according to quantitative criteria but was rather chosen with the aim of covering relatively uniformly the full range of color, line strength, and velocity dispersion shown by local elliptical galaxies. As such, it contains more dim, blue, weak-lined, low-dispersion galaxies than would be found in a magnitude-limited sample. In that sense the G93 sample may more closely resemble a volume-limited sample, but this has not been established quantitatively.
The original sample in G93 consisted of 41 galaxies, of which 40 are included here. NGC 4278 has been discarded because of its strong emission. Table 1 presents morphologies, positions, and heliocentric redshifts. All galaxies are classified as elliptical (or compact elliptical) in the RC3 (de Vaucouleurs et al. (1991)), the RSA (Sandage & Tammann (1987)), or the Carnegie Atlas (Sandage & Bedke (1994)) except for NGC 507 and NGC 6703, both classified as SA0 in the RC3 but not cataloged in the RSA or the Carnegie Atlas. NGC 224 (the bulge of M 31) is also included.
The environmental distribution of the G93 sample bears comment. Group assignments and approximate group richnesses may be found for nearly all galaxies in Faber et al. (1989). Most of the G93 galaxies are in poor groups, a few are quite isolated (there are no other galaxies in the RC3 within 1 Mpc projected distance and of NGC 6702, for example [Colbert, Mulchaey & Zabludoff, in prep.]), and six are members of the Virgo cluster. Only one is in a rich cluster (NGC 547, in Abell 194). We therefore refer to the galaxies in this sample as local “field” ellipticals, given the low-density environments of most of them. Environmental effects are discussed in more detail in Paper II.
2.2. G93 indices: calibrations and corrections
The Lick/IDS indices were introduced by Burstein et al. (1984) to measure prominent absorption features in the spectra of old stellar populations in the 4100–6300 Å region. A large and homogeneous database of stellar and galaxy spectra was assembled (Worthey et al. (1994); Trager et al. (1998), hereafter TWFBG98) with the Image Dissector Scanner at Lick Observatory (IDS; Robinson & Wampler (1972)). A description of the Lick/IDS system and its application to stellar and galaxy spectra is given in those papers.
González (1993) measured Lick/IDS indices with a different spectrograph setup, at higher dispersion, and over a restricted spectral range (4700–5500 Å). The four best indices in his wavelength interval are , , Fe5270, and Fe5335, which we use in this paper. The bandpasses of these four indices are given in Table 2, and the precise index definitions are given in G93, Worthey et al. (1994), and TWFBG98.
| Name | Index Bandpass | Pseudocontinua | Units | MeasuresaaDominant species; species in parentheses control index in a negative sense (index weakens as abundance grows). See Tripicco & Bell (1995) and Worthey (1998). | |
|---|---|---|---|---|---|
| 09 | H | 4847.875–4876.625 | 4827.875–4847.875 | Å | H,(Mg) |
| 4876.625–4891.625 | |||||
| 13 | Mg | 5160.125–5192.625 | 5142.625–5161.375 | Å | Mg,(C),(Cr),(Fe) |
| 5191.375–5206.375 | |||||
| 14 | Fe5270 | 5245.650–5285.650 | 5233.150–5248.150 | Å | Fe,C,(Mg) |
| 5285.650–5318.150 | |||||
| 15 | Fe5335 | 5312.125–5352.125 | 5304.625–5315.875 | Å | Fe,(C),(Mg),Cr |
| 5353.375–5363.375 |
We use a combined “iron” index, , in this work, which has smaller errors than either Fe index separately and is defined as follows:
| (1) |
It has the convenient property of being sensitive primarily to [Fe/H] (see Sec. 3.1.2). Although Mg2 has also become a standard “metallicity” indicator for the integrated spectra of galaxies, we do not use it to determine stellar population parameters. G93 was unable to transform his observations of this broad index (or of Mg1) accurately onto the Lick/IDS system due to chromatic focus variations in his spectrograph, coupled with the steep light gradient in the central regions of most ellipticals (Fisher et al. 1995 avoided Mg2 for the same reason). We prefer to use the narrower index , which is not affected by this problem.
2.2.1 Velocity-dispersion corrections
The observed spectrum of a galaxy is a convolution of the integrated spectrum of its stellar population with the line-of-sight velocity distribution function of its stars. Indices measured for broad-line galaxies are therefore too weak compared to unbroadened standard stars. TWFBG98 statistically corrected the Lick/IDS indices for this effect in the following way: individual stellar spectra of a variety of spectral types (plus M 32) were convolved with Gaussian broadening functions of increasing widths and their indices were remeasured. A smooth multiplicative correction as a function of velocity dispersion was determined separately for each index and applied to the galaxy data.
G93 used a more sophisticated technique, taking advantage of the higher resolution and signal-to-noise of his data. His stellar library was used to synthesize a summed stellar template representing a best fit to the the spectrum of each galaxy. Indices were measured from the unbroadened template and again from the broadened template, generating a velocity dispersion correction for each galaxy that was tuned to its spectral type. For , Fe5270, and Fe5335, the mean multiplicative corrections of G93 are very similar to those of TWFBG98 (compare his Figure 4.1 with Figure 3 of TWFBG98). However, for , the correction of G93 is flat or even negative, whereas the correction of TWFBG98 is always positive and reaches the value 1.07 at . Use of the TWFBG98 correction increases over G93 and leads to slightly younger ages. In what follows, we use the G93 correction to remain consistent with his published data but explore the effects of the TWFBG98 correction in Appendix B. The data marginally appear to favor TWFBG98, but the differences are not large.
2.2.2 Emission corrections
G93 noted that [O III] are clearly detectable in about half of the nuclei in his sample and that most of these galaxies also have detectable emission (see his Figure 4.10). For galaxies in his sample with strong emission, is fairly tightly correlated with [O III] such that EW()/EW([O III]) . A statistical correction of
| (2) |
was therefore added to to correct for this residual emission.
We have examined the accuracy of this correction by studying /[O III] among the G93 galaxies, supplemented by additional early-type galaxies from the emission-line catalog of Ho, Filipenko & Sargent (1997). The sample was restricted to include only normal, non-AGN Hubble types E through S0, and to well measured objects with Å. For 27 galaxies meeting these criteria, /[O III] varies from 0.33 to 1.25, with a median value of 0.60. This suggests that a better correction coefficient in Equation 2 might be 0.6 rather than 0.7, and thus that the average galaxy in G93 is slightly overcorrected. For a median [O III] strength through the G93 aperture of Å, the error would be about Å, or 3% in age. This systematic error for a typical galaxy is negligible compared to other sources of error in the ages (see Table 7). Random errors due to scatter in the ratio are about three times larger but are still small.
Carrasco et al. (1996) report no correlation between and [O III] emission in their sample of early-type galaxies, but give no data. Their claim is explored in Appendix B, which repeats our calculations but with no correction. The ages of a few strong-[O III] galaxies are increased, as expected, but the broad conclusions of this work are unaffected.
No correction for [N II] emission has been made to , although this has been suggested as a sometimes significant contributor to this index (by increasing the flux in the red sideband; Goudfrooij & Emsellem (1996)). Only NGC 315 and NGC 1453 would be affected (see G93).
| Name | [O III] | H | Mg | Fe52 | Fe53 | |||||||
|---|---|---|---|---|---|---|---|---|---|---|---|---|
| NGC 221 | 0.05 | 2.31 | 0.05 | 2.96 | 0.03 | 2.88 | 0.04 | 2.61 | 0.04 | 2.75 | 0.03 | |
| NGC 224 | 0.07 | 1.67 | 0.07 | 4.85 | 0.05 | 2.88 | 0.04 | 2.61 | 0.04 | 3.09 | 0.04 | |
| NGC 315 | 0.06 | 1.74 | 0.06 | 4.84 | 0.05 | 2.92 | 0.06 | 2.85 | 0.07 | 2.88 | 0.05 | |
| NGC 507 | 0.09 | 1.73 | 0.09 | 4.52 | 0.11 | 2.95 | 0.12 | 2.60 | 0.15 | 2.78 | 0.09 | |
| NGC 547 | 0.06 | 1.58 | 0.07 | 5.02 | 0.05 | 2.97 | 0.07 | 2.66 | 0.08 | 2.81 | 0.05 | |
| NGC 584 | 0.05 | 2.08 | 0.05 | 4.33 | 0.04 | 3.03 | 0.04 | 2.77 | 0.04 | 2.90 | 0.03 | |
| NGC 636 | 0.06 | 1.89 | 0.04 | 4.20 | 0.04 | 3.19 | 0.05 | 2.87 | 0.05 | 3.03 | 0.04 | |
| NGC 720 | 0.09 | 1.77 | 0.12 | 5.17 | 0.11 | 2.94 | 0.12 | 2.80 | 0.14 | 2.87 | 0.09 | |
| NGC 821 | 0.05 | 1.66 | 0.04 | 4.53 | 0.04 | 3.08 | 0.05 | 2.81 | 0.05 | 2.94 | 0.04 | |
| NGC 1453 | 0.06 | 1.60 | 0.06 | 4.95 | 0.05 | 2.96 | 0.06 | 2.99 | 0.07 | 2.98 | 0.05 | |
| NGC 1600 | 0.06 | 1.55 | 0.07 | 5.13 | 0.06 | 3.01 | 0.07 | 3.10 | 0.09 | 3.05 | 0.06 | |
| NGC 1700 | 0.05 | 2.11 | 0.05 | 4.15 | 0.04 | 3.17 | 0.05 | 2.83 | 0.05 | 3.00 | 0.04 | |
| NGC 2300 | 0.06 | 1.68 | 0.06 | 4.98 | 0.05 | 3.04 | 0.06 | 2.89 | 0.07 | 2.97 | 0.05 | |
| NGC 2778 | 0.07 | 1.77 | 0.08 | 4.70 | 0.06 | 3.01 | 0.07 | 2.69 | 0.08 | 2.85 | 0.05 | |
| NGC 3377 | 0.05 | 2.09 | 0.05 | 3.99 | 0.03 | 2.77 | 0.04 | 2.44 | 0.04 | 2.61 | 0.03 | |
| NGC 3379 | 0.05 | 1.62 | 0.05 | 4.78 | 0.03 | 2.98 | 0.04 | 2.73 | 0.04 | 2.85 | 0.03 | |
| NGC 3608 | 0.06 | 1.69 | 0.06 | 4.61 | 0.04 | 3.13 | 0.05 | 2.75 | 0.06 | 2.94 | 0.04 | |
| NGC 3818 | 0.08 | 1.71 | 0.08 | 4.88 | 0.07 | 3.09 | 0.08 | 2.85 | 0.08 | 2.97 | 0.06 | |
| NGC 4261 | 0.06 | 1.34 | 0.06 | 5.11 | 0.04 | 3.14 | 0.05 | 2.88 | 0.06 | 3.01 | 0.04 | |
| NGC 4374 | 0.05 | 1.51 | 0.04 | 4.78 | 0.03 | 2.94 | 0.04 | 2.69 | 0.04 | 2.82 | 0.03 | |
| NGC 4472 | 0.08 | 1.62 | 0.06 | 4.85 | 0.06 | 2.97 | 0.07 | 2.84 | 0.08 | 2.90 | 0.05 | |
| NGC 4478 | 0.06 | 1.84 | 0.06 | 4.33 | 0.05 | 3.03 | 0.06 | 2.84 | 0.06 | 2.93 | 0.04 | |
| NGC 4489 | 0.08 | 2.39 | 0.07 | 3.21 | 0.06 | 2.89 | 0.07 | 2.44 | 0.07 | 2.67 | 0.05 | |
| NGC 4552 | 0.05 | 1.47 | 0.05 | 5.15 | 0.03 | 3.02 | 0.04 | 2.95 | 0.04 | 2.98 | 0.03 | |
| NGC 4649 | 0.05 | 1.40 | 0.05 | 5.33 | 0.04 | 3.01 | 0.04 | 3.01 | 0.05 | 3.01 | 0.03 | |
| NGC 4697 | 0.07 | 1.75 | 0.07 | 4.08 | 0.05 | 2.97 | 0.06 | 2.57 | 0.06 | 2.77 | 0.04 | |
| NGC 5638 | 0.06 | 1.65 | 0.04 | 4.64 | 0.04 | 3.02 | 0.05 | 2.66 | 0.05 | 2.84 | 0.04 | |
| NGC 5812 | 0.06 | 1.70 | 0.04 | 4.81 | 0.04 | 3.09 | 0.05 | 3.02 | 0.06 | 3.06 | 0.04 | |
| NGC 5813 | 0.06 | 1.42 | 0.07 | 4.65 | 0.05 | 2.83 | 0.06 | 2.52 | 0.07 | 2.67 | 0.04 | |
| NGC 5831 | 0.05 | 2.00 | 0.05 | 4.38 | 0.04 | 3.17 | 0.04 | 2.92 | 0.04 | 3.05 | 0.03 | |
| NGC 5846 | 0.08 | 1.45 | 0.07 | 4.93 | 0.05 | 2.95 | 0.06 | 2.77 | 0.06 | 2.86 | 0.04 | |
| NGC 6127 | 0.08 | 1.50 | 0.05 | 4.96 | 0.06 | 2.90 | 0.07 | 2.79 | 0.08 | 2.85 | 0.06 | |
| NGC 6702 | 0.06 | 2.46 | 0.06 | 3.80 | 0.04 | 3.02 | 0.05 | 2.97 | 0.06 | 2.99 | 0.04 | |
| NGC 6703 | 0.05 | 1.88 | 0.06 | 4.30 | 0.04 | 3.06 | 0.05 | 2.79 | 0.05 | 2.92 | 0.04 | |
| NGC 7052 | 0.06 | 1.48 | 0.07 | 5.02 | 0.06 | 2.89 | 0.07 | 2.78 | 0.08 | 2.83 | 0.05 | |
| NGC 7454 | 0.06 | 2.15 | 0.06 | 3.27 | 0.05 | 2.68 | 0.06 | 2.27 | 0.06 | 2.47 | 0.04 | |
| NGC 7562 | 0.05 | 1.69 | 0.05 | 4.54 | 0.04 | 3.08 | 0.05 | 2.65 | 0.05 | 2.87 | 0.03 | |
| NGC 7619 | 0.05 | 1.36 | 0.04 | 5.06 | 0.04 | 3.03 | 0.05 | 3.08 | 0.06 | 3.06 | 0.04 | |
| NGC 7626 | 0.05 | 1.46 | 0.05 | 5.05 | 0.04 | 2.85 | 0.05 | 2.80 | 0.05 | 2.83 | 0.03 | |
| NGC 7785 | 0.06 | 1.63 | 0.06 | 4.60 | 0.04 | 2.88 | 0.05 | 2.94 | 0.06 | 2.91 | 0.04 |
| Name | [O III] | H | Mg | Fe52 | Fe53 | |||||||
|---|---|---|---|---|---|---|---|---|---|---|---|---|
| NGC 221 | 0.07 | 2.15 | 0.07 | 2.96 | 0.07 | 2.79 | 0.06 | 2.47 | 0.06 | 2.63 | 0.04 | |
| NGC 315 | 0.07 | 1.80 | 0.08 | 4.52 | 0.09 | 2.62 | 0.09 | 2.72 | 0.11 | 2.67 | 0.07 | |
| NGC 507 | 0.13 | 2.06 | 0.17 | 4.69 | 0.17 | 2.72 | 0.17 | 2.18 | 0.19 | 2.45 | 0.13 | |
| NGC 547 | 0.08 | 1.42 | 0.10 | 4.80 | 0.09 | 2.69 | 0.09 | 2.60 | 0.11 | 2.65 | 0.07 | |
| NGC 584 | 0.07 | 2.06 | 0.07 | 4.13 | 0.07 | 2.77 | 0.06 | 2.55 | 0.06 | 2.66 | 0.04 | |
| NGC 636 | 0.07 | 1.87 | 0.06 | 3.98 | 0.08 | 2.93 | 0.07 | 2.56 | 0.07 | 2.75 | 0.05 | |
| NGC 720 | 0.11 | 2.28 | 0.16 | 4.98 | 0.16 | 2.78 | 0.16 | 2.92 | 0.18 | 2.85 | 0.12 | |
| NGC 821 | 0.07 | 1.82 | 0.06 | 4.11 | 0.08 | 2.83 | 0.08 | 2.68 | 0.08 | 2.75 | 0.06 | |
| NGC 1453 | 0.07 | 1.69 | 0.09 | 4.43 | 0.08 | 2.84 | 0.08 | 2.81 | 0.09 | 2.83 | 0.06 | |
| NGC 1600 | 0.08 | 1.74 | 0.09 | 5.21 | 0.10 | 3.03 | 0.10 | 3.07 | 0.12 | 3.05 | 0.08 | |
| NGC 1700 | 0.07 | 2.11 | 0.07 | 3.90 | 0.08 | 2.94 | 0.07 | 2.71 | 0.07 | 2.83 | 0.05 | |
| NGC 2300 | 0.07 | 1.63 | 0.06 | 4.70 | 0.09 | 2.78 | 0.08 | 2.72 | 0.09 | 2.75 | 0.06 | |
| NGC 2778 | 0.08 | 1.56 | 0.10 | 4.44 | 0.09 | 2.88 | 0.09 | 2.40 | 0.10 | 2.64 | 0.07 | |
| NGC 3377 | 0.07 | 2.13 | 0.07 | 3.46 | 0.07 | 2.51 | 0.06 | 2.06 | 0.06 | 2.29 | 0.04 | |
| NGC 3379 | 0.07 | 1.59 | 0.06 | 4.44 | 0.07 | 2.80 | 0.06 | 2.55 | 0.06 | 2.67 | 0.04 | |
| NGC 3608 | 0.07 | 1.73 | 0.09 | 4.04 | 0.08 | 3.09 | 0.07 | 2.61 | 0.08 | 2.85 | 0.05 | |
| NGC 3818 | 0.10 | 1.81 | 0.11 | 4.19 | 0.12 | 2.73 | 0.11 | 2.54 | 0.11 | 2.63 | 0.08 | |
| NGC 4261 | 0.07 | 1.30 | 0.06 | 4.75 | 0.08 | 3.05 | 0.07 | 2.53 | 0.08 | 2.79 | 0.05 | |
| NGC 4374 | 0.07 | 1.56 | 0.06 | 4.50 | 0.07 | 2.78 | 0.06 | 2.57 | 0.06 | 2.67 | 0.04 | |
| NGC 4472 | 0.10 | 1.67 | 0.09 | 4.60 | 0.11 | 2.83 | 0.10 | 2.80 | 0.11 | 2.81 | 0.07 | |
| NGC 4478 | 0.07 | 1.73 | 0.06 | 4.17 | 0.08 | 2.74 | 0.07 | 2.52 | 0.07 | 2.63 | 0.05 | |
| NGC 4489 | 0.10 | 2.27 | 0.08 | 2.83 | 0.12 | 2.77 | 0.11 | 2.14 | 0.11 | 2.46 | 0.08 | |
| NGC 4552 | 0.07 | 1.52 | 0.06 | 4.80 | 0.07 | 2.83 | 0.06 | 2.70 | 0.06 | 2.77 | 0.04 | |
| NGC 4649 | 0.07 | 1.38 | 0.07 | 5.13 | 0.07 | 2.62 | 0.07 | 2.75 | 0.07 | 2.69 | 0.05 | |
| NGC 4697 | 0.10 | 1.66 | 0.07 | 3.62 | 0.10 | 2.55 | 0.09 | 2.28 | 0.09 | 2.42 | 0.06 | |
| NGC 5638 | 0.07 | 1.68 | 0.06 | 4.12 | 0.08 | 2.79 | 0.07 | 2.50 | 0.07 | 2.65 | 0.05 | |
| NGC 5812 | 0.07 | 1.71 | 0.05 | 4.54 | 0.08 | 2.96 | 0.07 | 2.82 | 0.07 | 2.89 | 0.05 | |
| NGC 5813 | 0.08 | 1.23 | 0.10 | 4.26 | 0.09 | 2.90 | 0.09 | 2.43 | 0.10 | 2.67 | 0.07 | |
| NGC 5831 | 0.07 | 2.03 | 0.07 | 3.88 | 0.07 | 2.89 | 0.06 | 2.55 | 0.06 | 2.72 | 0.04 | |
| NGC 5846 | 0.10 | 1.27 | 0.10 | 4.55 | 0.11 | 2.63 | 0.10 | 2.67 | 0.10 | 2.65 | 0.07 | |
| NGC 6127 | 0.10 | 1.50 | 0.07 | 4.67 | 0.11 | 2.76 | 0.10 | 2.55 | 0.11 | 2.65 | 0.07 | |
| NGC 6702 | 0.07 | 2.49 | 0.09 | 3.71 | 0.08 | 2.91 | 0.08 | 2.84 | 0.09 | 2.88 | 0.06 | |
| NGC 6703 | 0.07 | 1.83 | 0.07 | 4.00 | 0.08 | 2.82 | 0.07 | 2.53 | 0.07 | 2.67 | 0.05 | |
| NGC 7052 | 0.08 | 1.77 | 0.09 | 4.66 | 0.09 | 2.78 | 0.09 | 2.70 | 0.10 | 2.74 | 0.07 | |
| NGC 7454 | 0.07 | 2.08 | 0.06 | 2.88 | 0.09 | 2.39 | 0.08 | 2.10 | 0.08 | 2.25 | 0.06 | |
| NGC 7562 | 0.07 | 1.72 | 0.07 | 4.42 | 0.08 | 2.92 | 0.07 | 2.54 | 0.07 | 2.73 | 0.05 | |
| NGC 7619 | 0.07 | 1.47 | 0.05 | 4.70 | 0.08 | 2.78 | 0.07 | 2.84 | 0.08 | 2.81 | 0.05 | |
| NGC 7626 | 0.07 | 1.44 | 0.06 | 4.64 | 0.08 | 2.70 | 0.07 | 2.53 | 0.08 | 2.62 | 0.05 | |
| NGC 7785 | 0.07 | 1.52 | 0.06 | 4.30 | 0.08 | 2.81 | 0.07 | 2.82 | 0.08 | 2.81 | 0.05 |
Table 3a presents final corrected index strengths, velocity dispersion corrections, and emission corrections for measurements through a central aperture; Table 3b presents similar data for a global aperture. All values are taken directly from G93. The aperture index strengths are weighted averages of the major and minor axis profile data, computed so as to mimic what would be observed through the indicated circular aperture (see G93 for details).
3. SSP-equivalent stellar population parameters
3.1. Method
3.1.1 Solar-abundance ratio models of Worthey (1994)
SSP-equivalent population parameters have been derived by matching observed line strengths of , , and to updated single-burst stellar population (SSP) models of W94 (available at http://astro.sau.edu/worthey/; “Padova” isochrones by Bertelli et al. (1994) are explored in Appendix A). The models of W94 depend on two adjustable parameters—metallicity and single-burst age—and one fixed parameter, the initial mass function exponent (IMF), here chosen to have the Salpeter value. For reasons stated below, we believe that the basic models of W94 have essentially solar abundance ratios; we will presently adjust these models to allow for non-solar ratios and, in the process, derive a third adjustable parameter, the non-solar enhancement ratio, . The W94 models are reviewed briefly here, and the reader is referred to Worthey (1994) for more details.
The models incorporate three ingredients: stellar evolutionary isochrones, a stellar SED library, and absorption-line strengths. From the bottom of the main sequence to the base of the red-giant branch (RGB), the models use the isochrones of VandenBerg and collaborators (VandenBerg (1985); VandenBerg & Bell (1985); VandenBerg & Laskarides (1987)). These are mated to red giant branches from the Revised Yale Isochrones (Green, Demarque & King (1987)) by shifting the latter in and to match at the base of the RGB. Extrapolations are made to cover a wide range of (, , age) assuming that and .
The SED library was constructed using the model atmospheres and SEDs of Kurucz (1992) for stars hotter than 3750 K, and model SEDs of Bessel et al. (1989, 1991) and observed SEDs from Gunn & Stryker (1983) for cooler M giants.111There is a systematic color offset in the Kurucz (1992) models when compared with the empirical colors of Johnson (1966), the Kurucz (1992) models being too red by mag in (but not in other colors; W94). All model colors in this series are corrected for this offset.
Polynomial fitting functions from Worthey et al. (1994) for the Lick/IDS indices are used as the basis of the model absorption-line strengths. Metal-rich stars in the Lick/IDS library are a random sample of metal-rich stars in the solar neighborhood; since evidence suggests that such stars have essentially solar ratios of O, Mg, Na, and other key elements relative to Fe (Edvardsson et al. (1993)), we assume that the line-strengths produced by the metal-rich models of W94 reflect solar-abundance ratios.
To construct a model of a given age and metallicity, the appropriate stellar isochrone is first selected. Each star on the isochrone is assigned an SED from the flux library and a set of absorption-line strengths from the Lick/IDS fitting functions. Final model outputs are the integrated fluxed SED (from which colors and magnitudes can be derived) and absorption-line strengths on the Lick/IDS system.


The ability of the W94 models to break the age-metallicity degeneracy is illustrated in Figures 1 and 2, which plot and versus for the G93 galaxies. Model grids from W94 are overplotted. Both line strength pairs break the degeneracy, but - does so more than - because is less temperature sensitive than . Metallicities inferred from are clearly higher than from , reflecting the probable element enhancement in [Mg/Fe]. Low- galaxies tend to fall off the grid to high ages in the - diagram, especially through the aperture (Figure 2b). Most of this effect is removed when is corrected for depressed [Fe/H] (see below), and any small remainder can be attributed to use of the G93 velocity corrections (instead of TWFBG98) and, in a few galaxies, to possible residual, uncorrected emission (see Appendix B).
3.1.2 Non-solar abundance ratio models
Adjusting the W94 models for non-solar ratios involves two steps. First, one must compute new evolutionary tracks in a fully self-consistent manner using new interior opacities, reaction rates, and atmospheric boundary conditions that faithfully reflect the altered compositions. Second, one must compute new absorption-line indices. Part one is less developed in the literature but also proves to be less important; we discuss it below. Part two, the indices, could in principle be handled by observing populations of stars with known non-solar ratios and deriving empirical fitting functions for them. For example, Borges et al. (1995) derived a fitting function for Mg2 versus [Mg/Fe] using local dwarf and subgiant stars (this was the function adopted by TCB98 for their population models); and Weiss, Peletier & Mateucci (1995) attempted to correct Mg2 and using Galactic Bulge stars studied by Rich (1988).
However, it is hard to identify groups of stars with exactly the same (known) enhancements, and it is even more difficult to vary the pattern of element abundance enhancements in a controlled way using real stars. For these reasons, a theoretical approach is recommended, and we have chosen to utilize the computations of Tripicco & Bell (1995), who re-computed all of the Lick/IDS spectral indices from a grid of theoretical stellar SEDs and atmospheres with varying abundance ratios. For three sample locations on an old stellar isochrone, TB95 tabulate the response of each Lick/IDS index to separate enhancements dex for the elements and . These response functions are the basis for our corrections to the indices for non-solar abundance ratios. Note that, because we use the response functions differentially, we are insensitive to any zeropoint uncertainties that the TB95 indices may have (which are in any case known to be small, as TB95 showed by comparing to real stars).
| Model | ||||||||||
|---|---|---|---|---|---|---|---|---|---|---|
| 1 | CO | 0.914 | 0.323 | 0.023 | 0.173 | 0.509 | 0.041 | 0.267 | 0.061 | |
| 2 | CO | 0.774 | 0.365 | 0.065 | 0.173 | 0.482 | 0.041 | 0.294 | 0.020 | |
| 3 | CO | 0.759 | 0.369 | 0.069 | 0.087 | 0.565 | 0.041 | 0.297 | 0.001 | |
| 4 | CO | 0.929 | 0.319 | 0.019 | 0.181 | 0.504 | 0.041 | 0.265 | 0.067 | |
| Solar | 0.172 | 0.482 | 0.082 | 0.253 | 0.000 |
Note. — Cols. (1)–(2): Enhancement model. All models have enhanced N, Ne, Na, Mg, Si, and S. Ca and the Fe-peak elements (Cr, Mn, Fe, Co, Ni, Cu, Zn) are depressed. All other elements are fixed at their solar abundances except that model 1 has C fixed at its solar abundance and O enhanced (CO); model 2 has both C and O fixed at their solar abundances (CO); model 3 has C depressed like the Fe group and O enhanced (CO; this is the enhancement pattern favored by TCB98 and by Salaris & Weiss 1998); and model 4 has both C and O enhanced (CO). “Solar” is taken from the solar photospheric abundances of Grevesse et al. (1996). Cols. (3)–(4): is the response of the “enhanced” elements to changes in at fixed : . Col. (5): at dex. Col. (6): at dex. Col. (7): Mass fraction of metals in C. Col. (8): Mass fraction of metals in O. Col. (9): Mass fraction of metals in Fe peak elements. Col. (10): Mass fraction of metals in enhanced elements (except for C and O). Note that Cols. (7)–(10) do not add up precisely to 1, as elements fixed at their solar abundances (other than C and O) are not included. Col. (11): The ratio (Salaris, Chieffi & Straniero 1993); see text.
Following previous practice, we adopt the convention that a certain group of elements is “enhanced” in elliptical galaxies (more is said on this below). Precisely which elements are enhanced, and by how much, is poorly known. From an intercomparison of absorption-line strengths in the Lick/IDS galaxy sample (TWFBG98), Worthey (1998) suggested that Mg, Na, and N are enhanced in giant ellipticals but that Ca tracks Fe (cf. O’Connell (1976); Vazdekis et al. (1996)). Comparing to additional galaxy data from TWFBG98 below, we suggest that C also belongs to the enhanced group. Unfortunately, the Lick/IDS system has no indices that are capable of directly probing oxygen in elliptical galaxies (Worthey (1998)). Oxygen is important because it dominates on account of its high masss fraction.
Because O (and perhaps C) are uncertain, we have considered four models for the enhancement pattern in elliptical galaxies, as described in Table 4. In each model there are three groups of elements: enhanced, depressed, and fixed. The assignment of elements to the three groups is always the same except for C and O, whose assignments vary. Elements in the fixed group have their solar (photospheric) abundances (Grevesse, Noels & Sauval (1996)), while elements in each of the enhanced and depressed groups are all scaled up or down by the same factor. After the amount of enhancement is chosen and C and O are assigned to their proper groups, the depression of the depressed elements is calculated so as to preserve constant .
In the present work, we generally take the enhanced group to include the abundant elements that are nucleosynthetically related to Mg, several of which are actually seen to be overabundant in giant elliptical galaxies (Worthey (1998)). Elements placed in the enhanced group include N, Ne, Na, Mg, Si, and S (plus sometimes C and/or O).222In retrospect it would have made more sense to group N with C since they are nucleosynthetically related (Woosley & Weaver (1995)), but making this change would negligibly affect the conclusions. The iron-peak elements Cr, Mn, Fe, Co, Ni, Cu and Zn constitute the depressed group. All other elements (including those heavier than Zn) are in the fixed group, with the exception of Ca (in the depressed group), and C and O (which vary).
As noted, the four models differ in their treatment of C and O: model 1 has C fixed, O up; model 2 has C fixed, O fixed; model 3 has C down, O up; and model 4 has C up, O up. Because O is produced in massive stars like Mg, it is probable that it, too, is routinely enhanced in giant ellipticals; hence model 2 is unlikely on nucleosynthetic grounds. Model 3, with C down and O up, is similar to the models of Weiss, Peletier & Mateucci (1995), TCB98, and Salaris & Weiss (1998). We show below that depression of C does not match the Lick/IDS indices and that this model is also therefore unlikely. Model 4, with C and O both enhanced, is our preferred model based on McWilliam & Rich (1990) and Rich & McWilliam (priv. comm.), who find that O and C are enhanced in lockstep with Mg in stars in the Galactic Bulge. However model 1 (with C fixed) is very hard to distinguish observationally from model 4 (see below).
Because the enhanced elements are not exactly the same as the -elements (e.g., Ca is nominally an -element but apparently tracks Fe in elliptical spectra; Worthey 1998; TWFBG98), we use the notation , where “E” refers to the mass fraction of elements that are specifically enhanced in each model, in preference to the more common notation used by previous authors. Following TCB98, we write
| (3) |
or
| (4) |
at constant , where their very small second-order term in has been ignored. Table 4 gives values of and illustrative heavy-element fractions (C, O, E-group, Fe-peak) for the four models, all at dex and solar ; values of and for other values of can be calculated using Eqs. 3 and 4. For reference, TCB98’s model has .
Table 4 reveals an important fact—because the Fe-peak contribution to is so small (only 8% for solar abundance), reducing it by even 0.3 dex frees up only minimal room for the so-called “enhanced” elements. Hence, what really happens in enhanced models is that the enhanced (and fixed) elements remain nearly at their solar values, whereas Fe (and related elements) are depressed. In short, we should think of giant ellipticals as failing to make Fe-peak elements rather than making too much of certain other elements. Likewise, the quantity is not really an enhancement of the E-elements but rather a depression of Fe.
Other authors, including ourselves (e.g., Worthey, Faber & González (1992); Weiss, Peletier & Matteucci (1995); Greggio (1997); Vazdekis et al. (1997)) have said this, but the contradictory notion nevertheless persists that strong Mg indices are due to an “overabundance” of Mg—this is not mathematically possible if Mg, O, and the -elements track one another closely, as these elements together dominate by mass. We show below that the TB95 response functions provide an alternative means of strengthening and Mg2, namely, via weak Fe-peak elements (see below). This unanticipated anti-correlation between and the Fe-peak elements is one of the major new features of our treatment and the cause of our relatively small derived values of (compared with previous authors; see Sec. 4).
We return next to the problem of the stellar evolutionary isochrones. Since a full library of isochrones is not available for all abundance ratios, we follow the lead of TCB98, who suggest from examining their unpublished isochrones that models with varying are “virtually indistinguishable in the CMD” from models at the same with . Earlier, Salaris et al. (1993) had shown (at sub-solar metallicities) that -enhanced isochrones are identical to scaled-solar abundance isochrones at the same provided that the quantity
| (5) |
remains constant at the solar value (). Here is the mass fraction in element , and brackets indicate the usual logarithm relative to solar. The elements in have high ionization potentials and their opacity governs the mean turnoff temperature; the elements in have low ionization potentials and their opacity governs the temperature of the giant branch. Preserving the ratio [] thus preserves the shape of the track, they say, and the new track is found to fit neatly into the old sequence at the same value of . Values of [] are given in Table 4 for our four models. Models 2 and 3 are nearly solar, while models 1 and 4 are about 15% overabundant in HPE elements. These small deviations prove to be relatively unimportant, as shown in Section 5.4.
| Model | Star | % | |||||||||
|---|---|---|---|---|---|---|---|---|---|---|---|
| 1 | CO | cg | 53 | 0.000 | 0.128 | 0.088 | 0.295 | ||||
| to | 44 | 0.026 | 0.617 | 0.025 | 0.124 | ||||||
| cd | 3 | 0.183 | 0.086 | 0.153 | |||||||
| total | 0.027 | 0.146 | 0.080 | 0.249 | |||||||
| 2 | CO | cg | 53 | 0.000 | 0.179 | 0.129 | 0.366 | ||||
| to | 44 | 0.031 | 0.541 | 0.049 | 0.184 | ||||||
| cd | 3 | 0.238 | 0.118 | 0.192 | |||||||
| total | 0.031 | 0.193 | 0.118 | 0.315 | |||||||
| 3 | CO | cg | 53 | 0.000 | 0.010 | 0.767 | |||||
| to | 44 | 0.027 | 0.296 | ||||||||
| cd | 3 | 0.314 | 0.023 | 0.168 | |||||||
| total | 0.026 | 0.001 | 0.625 | ||||||||
| 4 | CO | cg | 53 | 0.055 | 0.000 | 0.175 | 0.095 | 0.265 | |||
| to | 44 | 0.026 | 0.786 | 0.032 | 0.111 | ||||||
| cd | 3 | 0.200 | 0.091 | 0.152 | |||||||
| total | 0.045 | 0.027 | 0.195 | 0.086 | 0.225 | ||||||
| TCB98 | totalbbFor the TCB98 model with an age of 10 Gyr and . | 0.172 |
Note. — Cols. (1)–(2): Enhancement model from Table 6; “TCB98” is close to the model of Tantalo et al. (1998a; TCB98); model 4 is our preferred model. Col. (3): Stellar component on isochrone, following TB95. “cg” refers to cool giants ( K, ); “to” refers to turn-off stars ( K, ); “cd” refers to cool dwarfs ( K, ); and “total” refers to the composite spectrum. Col. (4): Typical fractional light contribution from each stellar component to total flux, in percent (C2 has a slightly higher contribution from turn-off stars than the other indices). Col. (5)–(12): Fractional index responses for dex, in the sense , where is the index change and is the original value of the index. These are computed by inserting the response functions of Tripicco & Bell (1995) for each element into Eq. 6. (The three stellar entries do not sum to the total value because they are weighted by the unequal stellar indices of each type.) Fractional responses for the TCB98 model are based on element abundances computed from their Eqs. (3)–(5) and their Table 1.
More recently, Salaris & Weiss (1998) have suggested that, at higher metallicities near solar, track constancy may break down and that increasing both shifts the track to the blue and changes its shape. It is not clear whether these effects are due to high , to , or both. However, the motions are small, and we show in Section 5.4 that their impact on the indices is probably slight.
If isochrones do not shift (at fixed metallicity), we can assume that , , , and the SED of each star on the track are also constant. Hence, it is necessary only to calculate the changes in each spectral feature using the index response functions of TB95, by perturbing each element up or down according to the model. TB95 tabulate fractional index changes for three typical stars, one on the lower main sequence, one at the turnoff, and one on the RGB, at solar metallicity. We assume the same fractional changes at all metallicities and combine these responses by weighting by the fractional light contributions of each type of star at each index.333We have ignored the dependence of the line strength indices on Ti, as TB95 make contradictory statements about its inclusion in their model atmospheres. Although their tables include the effects of varying Ti, they clearly state that they have not included TiO lines in their line lists. This will affect the line strengths in the coolest giants. However, , , and are little affected by Ti in their models; see their Tables 4–6. Details are given in the notes to Table 5.
Note that the TB95 response functions are for enhancement values corresponding to dex. Response functions for arbitrary values of are calculated via Eq. 4 to get and and then by exponentially scaling the response functions in Tables 4–6 of TB95 by the appropriate element abundance. The fractional response of index is therefore
| (6) |
where is the TB95 response function for element at dex.444This equation assumes that the percentage index change is constant for each step of 0.3 dex in abundance. This assures that index values approach zero gracefully at low abundances but predicts infinite indices at high abundances, which is impossible. The scaling law should therefore probably not be applied at levels much above .
Table 5 shows changes in the indices corresponding to the four models in Table 4, all of which have 0.3. is virtually unaffected by non-solar abundance ratios, even at substantial ; all changes are less than 3%, which translates to % in age. Changes in are roughly the same in all models and amount to a decrease of about 20%, driven mostly by the decrease in (of 0.3 dex). However, C24668, Mg1, Mg2, and are all different, owing to the presence (or not) of C2 bands in the passband or sidebands of these indices; C2 and Mg1 increase greatly with increasing C, declines with increasing C, while Mg2 stays about the same independent of C. These changes all reflect the different abundance of C in the models since the abundance of Mg (and other elements in the E group) is always about constant (cf. Table 4).
Finally, we note that increases in all models, in apparent contradiction to the near constancy of . This increase is due mostly to the decrease in Fe and Cr (see TB95), which has the effect of increasing . In fact, changes in all the Mg indices are driven more by the Fe-peak deficit than by any actual increase in Mg, proving once again that a more correct way of looking at elliptical galaxies is to regard them as Fe-poor rather than -enhanced.
3.2. Ages, metallicities, and abundance ratios
SSP-equivalent parameters are derived for each G93 galaxy by choosing, for each model 1–4, the best-fitting age , metallicity , and enhancement ratio . Solving for three free parameters requires three indices, for which we use , , and . First, an expanded model grid of line strengths as a function of , , and (now) is generated by applying the TB95 response functions to the base W94 models at each (, ). These new grids (one for each model 1–4) are created by interpolating the W94 models at intervals of Gyr and and then interpolating the TB95 results at intervals of at each . The process is then inverted to derive for each galaxy by searching in the grid to find that point with minimum distance from the observed parameters . It was necessary to linearly extrapolate the W94 models to slightly higher ages and to both lower and higher values to cover the full range of -space populated by the observations. The range of space covered by the final grids is
Tables 6a and 6b give derived values and associated uncertainties in the and apertures, respectively. Errors were derived by searching the grid at , , and and taking the maximum deviations , , and as the associated uncertainties.555These errors faithfully relect the magnitude of the uncertainties but not their correlations. Correlated errors in and can be important, driven jointly by observational errors in (Trager (1997)). Fortunately the G93 errors are so small that observationally driven correlations in the output parameters are not important.
The derived SSP-equivalent parameters should be treated with caution for the extrapolated solutions ( Gyr at all metallicities, at all ages, and Gyr at ). However, in the aperture, which we concentrate on in this and the following paper, only one galaxy (NGC 5813) has Gyr, and only a few more have for any enhancement model. The extrapolations are more significant for the stellar population parameters in the aperture (Table 6b). However, many of these would also lessen or disappear if TWFBG98 velocity corrections to were substituted for those of G93, or if small emission fill-in errors were corrected (see Appendix B).
We have checked our fitting procedure by correcting the observed line strengths back to solar abundance ratios using the TB95 response functions for the solved-for values of and . The resulting corrected line strengths are presented in Figures 3 (for ) and 4 (for ) with the W94 models overplotted. These are the predicted line strengths that would be seen if the populations had the same and but = 0. Metallicities and ages inferred from and now agree, suggesting that our method for finding for the best-fitting parameters by searching in the three-dimensional grid is working correctly. These corrected points show graphically our final values of and .
Derived stellar parameters from the four enhancement models are compared in Figure 5. The most notable difference is between model 3 (C down, O up) versus all other models: galaxies are older, more metal-poor, and less enhanced in model 3 than in the others. These differences are driven entirely by the low C abundance in model 3; reducing C increases but has little effect on . Models with low C (like model 3) therefore result in lower overall metallicities, smaller , and older ages, as may be seen by following through the consequences of a higher response function in Figure 1.
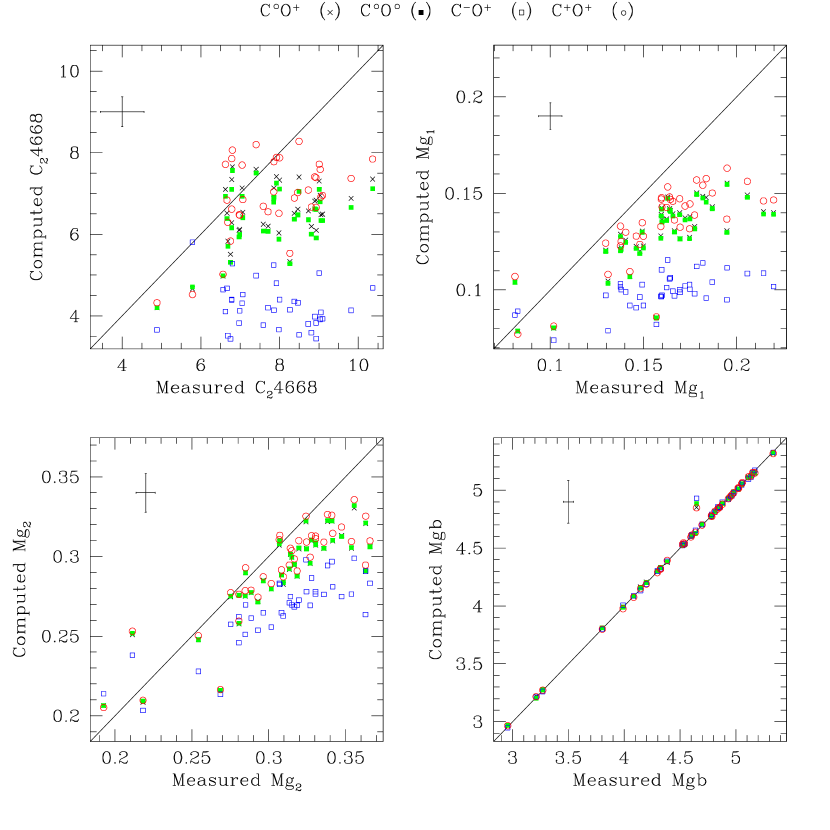
Is model 3 in fact compatible with observed galaxy line strengths? To test this, we augment the G93 indices with data on the C-sensitive feature C24668 from the Lick/IDS sample of TWFBG98. For each population model, we use the response functions of TB95 to compute predicted line strengths for three new features—C24668, Mg1, and Mg2—none of which were used in the original fits. Observed versus predicted indices are shown in Figure 6. Enhancement model 3, in which C is depressed, clearly fails systematically to reproduce the strengths of the new indices, especially C24668. Models 1, 2, and 4 are nearly indistinguishable, as expected since the C abundance hardly varies among them (cf. Table 4). Model 4 is marginally the best () on account of its slightly higher C abundance, a further slight boost for our preferred model. Although model 4 fits best, it still fails systematically to reproduce the highest values of C24668, Mg1 and, especially, Mg2. This may indicate that C (and perhaps Mg) are actually over-enhanced compared to the E-group generally and may signal a breakdown in our assumption that all E-group elements scale in lockstep. Specific element abundance ratios will be explored using the full set of Lick indices in future papers.
| Name | Model | Age (Gyr) | ||||
|---|---|---|---|---|---|---|
| NGC 221 | 1 | |||||
| 2 | ||||||
| 3 | ||||||
| 4 | ||||||
| NGC 224 | 1 | |||||
| 2 | ||||||
| 3 | ||||||
| 4 | ||||||
| NGC 315 | 1 | |||||
| 2 | ||||||
| 3 | ||||||
| 4 | ||||||
| NGC 507 | 1 | |||||
| 2 | ||||||
| 3 | ||||||
| 4 | ||||||
| NGC 547 | 1 | |||||
| 2 | ||||||
| 3 | ||||||
| 4 | ||||||
| NGC 584 | 1 | |||||
| 2 | ||||||
| 3 | ||||||
| 4 | ||||||
| NGC 636 | 1 | |||||
| 2 | ||||||
| 3 | ||||||
| 4 | ||||||
| NGC 720 | 1 | |||||
| 2 | ||||||
| 3 | ||||||
| 4 | ||||||
| NGC 821 | 1 | |||||
| 2 | ||||||
| 3 | ||||||
| 4 | ||||||
| NGC 1453 | 1 | |||||
| 2 | ||||||
| 3 | ||||||
| 4 | ||||||
| NGC 1600 | 1 | |||||
| 2 | ||||||
| 3 | ||||||
| 4 | ||||||
| NGC 1700 | 1 | |||||
| 2 | ||||||
| 3 | ||||||
| 4 | ||||||
| NGC 2300 | 1 | |||||
| 2 | ||||||
| 3 | ||||||
| 4 | ||||||
| NGC 2778 | 1 | |||||
| 2 | ||||||
| 3 | ||||||
| 4 | ||||||
| NGC 3377 | 1 | |||||
| 2 | ||||||
| 3 | ||||||
| 4 | ||||||
| NGC 3379 | 1 | |||||
| 2 | ||||||
| 3 | ||||||
| 4 | ||||||
| NGC 3608 | 1 | |||||
| 2 | ||||||
| 3 | ||||||
| 4 | ||||||
| NGC 3818 | 1 | |||||
| 2 | ||||||
| 3 | ||||||
| 4 | ||||||
| NGC 4261 | 1 | |||||
| 2 | ||||||
| 3 | ||||||
| 4 | ||||||
| NGC 4374 | 1 | |||||
| 2 | ||||||
| 3 | ||||||
| 4 | ||||||
| NGC 4472 | 1 | |||||
| 2 | ||||||
| 3 | ||||||
| 4 | ||||||
| NGC 4478 | 1 | |||||
| 2 | ||||||
| 3 | ||||||
| 4 | ||||||
| NGC 4489 | 1 | |||||
| 2 | ||||||
| 3 | ||||||
| 4 | ||||||
| NGC 4552 | 1 | |||||
| 2 | ||||||
| 3 | ||||||
| 4 | ||||||
| NGC 4649 | 1 | |||||
| 2 | ||||||
| 3 | ||||||
| 4 | ||||||
| NGC 4697 | 1 | |||||
| 2 | ||||||
| 3 | ||||||
| 4 | ||||||
| NGC 5638 | 1 | |||||
| 2 | ||||||
| 3 | ||||||
| 4 | ||||||
| NGC 5812 | 1 | |||||
| 2 | ||||||
| 3 | ||||||
| 4 | ||||||
| NGC 5813 | 1 | |||||
| 2 | ||||||
| 3 | ||||||
| 4 | ||||||
| NGC 5831 | 1 | |||||
| 2 | ||||||
| 3 | ||||||
| 4 | ||||||
| NGC 5846 | 1 | |||||
| 2 | ||||||
| 3 | ||||||
| 4 | ||||||
| NGC 6127 | 1 | |||||
| 2 | ||||||
| 3 | ||||||
| 4 | ||||||
| NGC 6702 | 1 | |||||
| 2 | ||||||
| 3 | ||||||
| 4 | ||||||
| NGC 6703 | 1 | |||||
| 2 | ||||||
| 3 | ||||||
| 4 | ||||||
| NGC 7052 | 1 | |||||
| 2 | ||||||
| 3 | ||||||
| 4 | ||||||
| NGC 7454 | 1 | |||||
| 2 | ||||||
| 3 | ||||||
| 4 | ||||||
| NGC 7562 | 1 | |||||
| 2 | ||||||
| 3 | ||||||
| 4 | ||||||
| NGC 7619 | 1 | |||||
| 2 | ||||||
| 3 | ||||||
| 4 | ||||||
| NGC 7626 | 1 | |||||
| 2 | ||||||
| 3 | ||||||
| 4 | ||||||
| NGC 7785 | 1 | |||||
| 2 | ||||||
| 3 | ||||||
| 4 |
| Name | Model | Age (Gyr) | ||||
|---|---|---|---|---|---|---|
| NGC 221 | 1 | |||||
| 2 | ||||||
| 3 | ||||||
| 4 | ||||||
| NGC 315 | 1 | |||||
| 2 | ||||||
| 3 | ||||||
| 4 | ||||||
| NGC 507 | 1 | |||||
| 2 | ||||||
| 3 | ||||||
| 4 | ||||||
| NGC 547 | 1 | |||||
| 2 | ||||||
| 3 | ||||||
| 4 | ||||||
| NGC 584 | 1 | |||||
| 2 | ||||||
| 3 | ||||||
| 4 | ||||||
| NGC 636 | 1 | |||||
| 2 | ||||||
| 3 | ||||||
| 4 | ||||||
| NGC 720 | 1 | |||||
| 2 | ||||||
| 3 | ||||||
| 4 | ||||||
| NGC 821 | 1 | |||||
| 2 | ||||||
| 3 | ||||||
| 4 | ||||||
| NGC 1453 | 1 | |||||
| 2 | ||||||
| 3 | ||||||
| 4 | ||||||
| NGC 1600 | 1 | |||||
| 2 | ||||||
| 3 | ||||||
| 4 | ||||||
| NGC 1700 | 1 | |||||
| 2 | ||||||
| 3 | ||||||
| 4 | ||||||
| NGC 2300 | 1 | |||||
| 2 | ||||||
| 3 | ||||||
| 4 | ||||||
| NGC 2778 | 1 | |||||
| 2 | ||||||
| 3 | ||||||
| 4 | ||||||
| NGC 3377 | 1 | |||||
| 2 | ||||||
| 3 | ||||||
| 4 | ||||||
| NGC 3379 | 1 | |||||
| 2 | ||||||
| 3 | ||||||
| 4 | ||||||
| NGC 3608 | 1 | |||||
| 2 | ||||||
| 3 | ||||||
| 4 | ||||||
| NGC 3818 | 1 | |||||
| 2 | ||||||
| 3 | ||||||
| 4 | ||||||
| NGC 4261 | 1 | |||||
| 2 | ||||||
| 3 | ||||||
| 4 | ||||||
| NGC 4374 | 1 | |||||
| 2 | ||||||
| 3 | ||||||
| 4 | ||||||
| NGC 4472 | 1 | |||||
| 2 | ||||||
| 3 | ||||||
| 4 | ||||||
| NGC 4478 | 1 | |||||
| 2 | ||||||
| 3 | ||||||
| 4 | ||||||
| NGC 4489 | 1 | |||||
| 2 | ||||||
| 3 | ||||||
| 4 | ||||||
| NGC 4552 | 1 | |||||
| 2 | ||||||
| 3 | ||||||
| 4 | ||||||
| NGC 4649 | 1 | |||||
| 2 | ||||||
| 3 | ||||||
| 4 | ||||||
| NGC 4697 | 1 | |||||
| 2 | ||||||
| 3 | ||||||
| 4 | ||||||
| NGC 5638 | 1 | |||||
| 2 | ||||||
| 3 | ||||||
| 4 | ||||||
| NGC 5812 | 1 | |||||
| 2 | ||||||
| 3 | ||||||
| 4 | ||||||
| NGC 5813 | 1 | |||||
| 2 | ||||||
| 3 | ||||||
| 4 | ||||||
| NGC 5831 | 1 | |||||
| 2 | ||||||
| 3 | ||||||
| 4 | ||||||
| NGC 5846 | 1 | |||||
| 2 | ||||||
| 3 | ||||||
| 4 | ||||||
| NGC 6127 | 1 | |||||
| 2 | ||||||
| 3 | ||||||
| 4 | ||||||
| NGC 6702 | 1 | |||||
| 2 | ||||||
| 3 | ||||||
| 4 | ||||||
| NGC 6703 | 1 | |||||
| 2 | ||||||
| 3 | ||||||
| 4 | ||||||
| NGC 7052 | 1 | |||||
| 2 | ||||||
| 3 | ||||||
| 4 | ||||||
| NGC 7454 | 1 | |||||
| 2 | ||||||
| 3 | ||||||
| 4 | ||||||
| NGC 7562 | 1 | |||||
| 2 | ||||||
| 3 | ||||||
| 4 | ||||||
| NGC 7619 | 1 | |||||
| 2 | ||||||
| 3 | ||||||
| 4 | ||||||
| NGC 7626 | 1 | |||||
| 2 | ||||||
| 3 | ||||||
| 4 | ||||||
| NGC 7785 | 1 | |||||
| 2 | ||||||
| 3 | ||||||
| 4 |


4. SSP-equivalent parameters for the G93 sample
This section presents a brief overview of the resultant SSP-equivalent population parameters for the G93 galaxies; detailed discussion is reserved to Papers II and III. Our focus here is on the preferred model 4 (C and O both up), but results from models 1 and 2 are similar (model 3 being ruled out).

Figure 7 presents histograms of , , and for the G93 sample through the aperture. The original conclusions of G93 are confirmed using this more rigorous analysis: the central stellar populations of galaxies in this sample span a large range of SSP-equivalent ages, from (more than 1 dex), but a relatively narrow range in , , and an even smaller spread in . The metallicity distribution has a peak at and a dispersion of , while the enhancement distribution peaks strongly at with a dispersion () of only 0.05 (these values vary slightly with the model).
A striking fact to emerge from Figure 7 is how mild the mean metallicities and enhancements of ellipticals really are. Matching the high Mg index values of ellipticals has been problematic in the past (e.g., Matteucci (1994); Greggio (1997)), and previous authors have typically invoked rather large enhancements in the range –0.5 (Weiss, Peletier & Matteucci (1995); Trager (1997); Greggio (1997)). With the TB95 response functions, however, the average is only a factor of two higher than solar, and the average is only . The latter is small compared to the maximum value of found in metal-poor Galactic stars (Wheeler, Sneden & Truran (1989); Edvardsson et al. (1993)), which is widely regarded as an empirical upper limit to the amount of depression in Fe that can result from total suppression of SNae Ia. The depression of the Fe-peak in ellipticals appears to be much less than this and should be easier to accommodate with reasonable galacto-nucleosynthesis models.

Figure 8 presents similar histograms of , , and for the aperture. The global stellar populations span a slightly larger range of ages, from 1.5 to 25 Gyr and a slightly wider range of metallicities, (with NGC 720 at ), although some of this larger scatter is surely due to the larger uncertainties in the line strengths. Otherwise, the shapes of the distributions are similar. Comparing with shows that mean is down by 0.18 dex in the outer parts, indicating that the outer regions are slightly more metal-poor than the centers. The outer mean enhancement is lower by only 0.03 dex, however, confirming the conclusion of Worthey et al. (1992), Davies, Sadler & Peletier (1993), and G93 that enhancement gradients within galaxies are weak. Ages increase slightly outwards, the outer parts being on average roughly 25% older. Overall, the differences among galaxies are much more striking than the differences within galaxies, at least in the G93 sample, through these apertures.
5. Uncertainties and systematic errors
This section assesses both zeropoint and scale errors in , , and . We begin by examining our basic assumption that the ages, metallicities, and enhancement ratios we have derived above represent true light-weighted ages and abundances of elliptical galaxies. In particular, we first ask whether the apparent large age spread among the G93 galaxies could be due to spurious effects.
5.1. as an age indicator
The assumption that we are measuring real ages of stellar populations rests on the further assumption that light is coming purely from main-sequence and red giant-branch stars. We now discuss three scenarios whereby might be contaminated by light from other sources.
(1) Fill-in by emission (see Section 2.2.2). The extreme form of this hypothesis says that all ellipticals are actually young and that the apparent large age spread is due entirely to variable amounts of infill by emission. This extreme view is strictly ruled out by numerous observational studies of emission in elliptical galaxies. For example, G93’s plot of precision continuum-subtracted spectra (G93, Figure 4.10) shows that emission is nearly always less than a few tenths of an Å, not nearly large enough to create the observed age spread. In the same vein, Carrasco et al. (1996) went so far as to suggest that no emission corrections should be applied at all to most ellipticals, implying that any emission can at most be small. The final point is that correlates strongly both with Mg2 and (G93; Jørgensen (1997)), inconsistent with emission fill-in, which varies unpredictably from galaxy to galaxy.
A more reasonable hypothesis is that errors in the emission correction contribute noticeably to the age spread. Such errors were investigated in Section 2.2.2, where we noted that scatter in the /[O III] ratio would induce age errors of only % for typical galaxies. An even more drastic test is presented in Appendix B, which shows that neglecting the emission correction altogether affects a few strong-[O III] galaxies but makes at most small changes in the broad age distribution.
(2) Contamination by blue horizontal branch stars (BHBs). BHB stars are not present in the standard Worthey (1994) models, which assume red clumps for old metal-rich populations. BHB stars might come from an anomalous BHB population associated with the metal-rich stars, or from contamination by a normal BHB associated with a subordinate metal-poor population. By “BHB,” we mean blue horizontal branches similar to M 92, which would contribute significantly to the light at 4000–5500 Å, not the extremely hot horizontal branches identified in populations like NGC 6791 (Liebert, Saffer & Green (1994)) which contribute primarily to 1500 Å flux and the “UV upturn” (e.g., Lee (1994), Yi et al. (1999)).
The galaxy M 32 can be used to rule out the hypothesis that BHBs alone are responsible for the large excesses seen in high- ellipticals. It can be shown that nearly the entire red clump in M 32 would have to be moved to a BHB at approximately spectral type mid-F to explain its high index (Burstein et al. (1984)); this is strictly ruled out by blue spectral indices (Rose (1985), 1994). Moreover, the HB has actually been detected in the outer part of M 32 by HST (Grillmair et al. (1996)) and is seen to be mostly red.666To be precise, the Grillmair et al. (1996) data are not deep enough to rule out a small number of BHB stars (Grillmair et al. (1996); C. Gallart, priv. comm.), but the lack of point sources in archival F300W images suggests that any BHB must indeed be weak. Extrapolating the G93 indices outward to this field and matching to W94 models there yields an excellent fit to both the integrated colors and the color of the RGB at this point (Grillmair et al. (1996)), supporting the assumption that the HB is indeed red.
The existence of a dominant BHB population in metal-rich ellipticals is not expected on astrophysical grounds. If ellipticals were very old (i.e., Gyr, as Lee 1994 has suggested), then BHBs could conceivably be significant components, but such large ages violate current constraints on the age of the Universe (see, e.g., Gratton et al. (1997)). No solar metallicity cluster populations in the Milky Way have BHBs (Worthey (1994)), although we note that Rich et al. (1997) have discovered significant M3-like BHB populations in two metal-rich Galactic bulge globular clusters, NGC 6388 and NGC 6441 (). However, these two globulars are the densest known in the Galactic globular cluster system; the fact that BHB stars occur precisely there (Sosin et al. (1997)) suggests that dynamical interactions are the cause. We conclude that the occurrence of BHB stars in low-density systems like giant elliptical galaxies is unlikely, but a deeper understanding of their presence in these globulars is obviously necessary.
Contamination by BHBs from a subordinate metal-poor population also does not seem probable. As noted, such contamination by a trace blue BHB component cannot materially affect the indices of high- galaxies, but perturbations in weak- galaxies should be considered. For example, 5% of the -band light in metal-poor BHB stars would decrease the inferred age of a galaxy from 13 Gyr to 8 Gyr at solar metallicity. However, Rose (1985, 1994), using a set of high-resolution spectral indices in the 4000 Å region, has shown in M 32 and eight strong-lined ellipticals that no more than of the light in the blue region (and less than 2% in the -band) can come from very hot stars (F0 and earlier). This falls short by a factor of two. Moreover 5% of -band light in BHB stars would imply that altogether 25% of the total light would have to come from metal-poor stars. This is twenty-five times more than the amount of metal-poor () -band light actually found in the outer part of M 32 by Grillmair et al. (1996). That a much larger quantity of metal-poor stars could be found near the centers of more metal-rich elliptical galaxies seems implausible.
We conclude that contamination by metal-poor populations is a negligible perturbation to the central ages of the G93 galaxies and could cause at most a 10% reduction near , if that.
(3) Contamination by blue straggler stars (BSSs). A typical BSS has mag, (Bailyn (1995)), and spectral type A8–F0. From Worthey et al. (1994), dwarf A8–F0 stars have – Å. To explain the high strength of M 32 ( Å) as arising from a population of blue stragglers superimposed on an old (15 Gyr), solar-metallicity population ( Å) would require that of the -band light come from BSSs. This implies a BSS specific frequency of per , which is a factor of 8 higher than seen in the most BSS-rich Galactic globular cluster (Palomar 5) and a factor of 28 higher than seen in the average Galactic globular cluster (Ferraro, Fusi Pecci & Bellazzini (1995)). We again conclude that high- galaxies like M 32 are immune to perturbations by spurious hot components such as BSS stars.
Consider next a trace contamination by BSSs in low- galaxies. For example, to decrease the age of an elliptical from 13 Gyr to 8 Gyr at solar metallicity, BSSs would again need to contribute of the -band light. For NGC 3379, this implies a specific frequency of per . This specific frequency is a little more than a factor of 3 higher than that seen in the most BSS-rich Galactic globular cluster (Ferraro, Fusi Pecci & Bellazzini (1995)). In the absence of a complete theory of BSS formation, a factor of three increase might not be impossible. On the other hand, as noted, Rose (1985, 1994) has shown that no more than of -band light can come from hot stars F0 and earlier in M 32 and eight strong-lined ellipticals. This is less than half the light required and would perturb the age from 13 Gyr to only 11 Gyr, a reduction of only 15%.
To summarize, the leading hot-star contaminants, BHBs and BSSs, both peak at temperatures at or hotter than F0, whereas the blue line-strength data of Rose (1985, 1994) imply that the great bulk of Balmer absorption must be coming from cooler F and G stars, at or at most only slightly hotter than the derived turnoff temperatures. Barring some as-yet-undiscovered contaminating population of cooler stars, the Rose limits imply that contamination of by non-main sequence stars can reduce the ages of even the oldest ellipticals by at most 10–15%.
5.2. Errors due to theoretical model uncertainties
The next three sections assess additional sources of systematic errors; results are collected in Table 7. This section discusses theoretical model uncertainties caused by errors in the stellar isochrones and line-strength response functions of TB95. The major uncertainty in the interior models is the age scale, which is continually being refined. With the recent release of parallaxes from the HIPPARCOS satellite, much effort has been spent recalibrating the ages of Galactic globular clusters using both the new parallaxes and up-to-date models of stellar evolution (e.g., Reid (1997), 1998; Gratton et al. (1997); Chaboyer et al. (1998); Grundahl, Vandenberg & Andersen (1998); Pont et al. (1998); Salaris & Weiss (1998)). This effort has brought the ages of the oldest globular clusters down from –15 Gyr to Gyr, a reduction of . At least half of this reduction is due to corrections in the metallicity scale of globular clusters and to the use of more up-to-date stellar evolutionary models (Gratton et al. (1997)).
These age redeterminations have so far been restricted to clusters with metallicities . At the metallicities typical of elliptical galaxies, the effect of the age recalibrations is not yet known but could be as much as , just by using isochrones from the most modern stellar evolutionary models. This agrees with Charlot, Worthey & Bressan (1996), who found that absolute ages are uncertain at the 25% level in stellar populations with ages Gyr, resulting almost entirely from the choice of different stellar models. Below and in Appendix A, we explore the effect of substituting “Padova” isochrones by Bertelli et al. (1994) for those of W94 and find that young ages differ by 35% but that old ages change by only 4%. As a rough rule of thumb, we assume that both the age zeropoint and age scale of the models are uncertain at the - level.

The effect of errors in the theoretical response functions of TB95 is illustrated in Figure 9, which is a schematic repeat of Figure 1(b) showing versus . Figure 9 shows a galaxy plotted two ways, one using raw , the other using the value of inferred from by assuming solar abundance ratios (call this ). lies to the left of , indicating Fe depression. Applying the TB95 corrections for non-solar moves to the right and to the left, as shown by the arrows (the correction to is small and is ignored). When the correct value of is reached, the two points coincide, giving final , , and (right hand panel).
Where the solution lands is evidently governed by the relative lengths of the two correction vectors; for model 4, this ratio is = 1.25. The systematic errors of the final point depend mainly on the error of this ratio. Assuming that the two response functions of TB95 are individually uncertain by as much as 30% and that the errors of their three stellar types add in quadrature, the resultant zeropoint uncertainties are 3% in age, 0.10 dex in , and 0.04 dex in for highly enhanced galaxies. Since this last error drops to zero for galaxies with , we derive an overall scale uncertainty in of 20%.
We note that fundamental uncertainties in stellar models, for example the use of a single-parameter mixing length theory for convection or the detailed effects of rotation and diffusion, may induce additional, unknown systematic errors in our absolute age estimates. Such uncertainties also affect the globular cluster age scale. At present, our estimated uncertainties in the absolute ages of galaxies therefore should be considered to be relative to the globular cluster age scale.
5.3. Errors due to empirical model uncertainties
Errors in this category include errors in the metallicity and temperature scales of the Lick/IDS fitting functions and errors in the fitting accuracy of the functions themselves.
We have checked the metallicity scale of the Lick/IDS system by comparing our assumed stellar values (summarized by Worthey et al. (1994)) with the compilation of published spectroscopically-determined values by Cayrel de Strobel et al. (1997). For stars with (mostly dwarfs), the Lick/IDS metallicity scale is in excellent agreement with the published values at all . For giants with , the Lick/IDS metallicity scale is within – dex of the Cayrel de Strobel scale (systematically slightly high). However, for giants with (“SMR” stars), the Lick/IDS metallicity scale deviates strongly from the Cayrel de Strobel scale, such that the Lick/IDS giants appear to be more metal rich. The Lick/IDS metallicity scale for giants is based on the narrow-band photometric metallicity scales of Hansen & Kjærgaard (1971) and Gottlieb & Bell (1971), and on the high-resolution spectral study of Gustafsson, Kjærgaard & Anderson (1974) (Faber et al. (1985)). In contrast, the Cayrel de Strobel et al. (1997) catalog is populated in the SMR giant regime by older spectroscopic abundance determinations based on stellar atmospheres that typically (1) have a too-low solar iron abundance (McWilliam (1997)) and (2) do not properly account for molecule formation in SMR giants (Castro et al. (1996)). Correcting the abundances of SMR giants for these two effects suggests that the Lick/IDS scale may actually be very close (possibly – dex too high) to the modern spectroscopic metallicity scale, even at (Castro et al. (1996); McWilliam, priv. comm.).
The next question is whether the fitting functions are in fact good fits to the stellar line strengths. By inspecting the residual diagrams in Gorgas et al. (1993) and Worthey et al. (1994), we estimate that any systematic errors in the metal-line fits are less than 3%, which translates to zeropoint uncertainties of 0.05 in and 0.10 in (the former averages Fe and Mg while the latter differences them, accounting for its larger error). The crucial function for age is the fit to versus for main sequence A-F stars. Again, we estimate that the basic line-strength calibration level is accurate to better than 3% in this interval, which translates to about 10% in age. Finally, the temperature scale ( vs. ) of main sequence stars is needed to attach strengths to the theoretical isochrones. An error of 100 K (Worthey et al. (1994)) again translates to about 10% in age. Note that all these errors in the fitting functions affect only the absolute zeropoints of age, metallicity, and but not their differential values.
5.4. Errors due to unknown element enhancements
Our treatment of element enhancements is crude—we simply group all elements into three categories (enhanced, depressed, and fixed) and assume that differences within each group are nil. The group assignment of certain elements is also uncertain. Unknown element abundance ratios introduce errors in the predicted index response functions and, to a smaller extent, in the theoretical stellar evolutionary tracks.
According to TB95, the elements that significantly influence the indices used here are Fe, Cr, C, and Mg. Fe and Cr are produced in both Type Ia and in intermediate-mass progenitor Type II SNae (Woosley & Weaver (1995)). They should vary closely together by virtue of similar nucleosynthesis; i.e., their relative uncertainty should be small. Breaking the link between Fe and Cr, for example by decreasing [Cr/Fe], would have the effect of altering the index strength without significantly affecting other indices (TB95). In our own galaxy, however, [Cr/Fe] is solidly at the solar value until (McWilliam (1997)), much lower than the metallicities of interest in elliptical galaxies. We will discuss possible element-to-element variations in a future paper. Likewise we have tested the sensitivity of the indices to C explicitly in models 1–4 and found that low-C models (like model 3) are ruled out. With this eliminated, remaining uncertainties due to the C abundance variations are limited to 10% in age, 0.05 dex in , and 0.01 dex in (Figure 5).
A larger source of uncertainty arises from uncertain ratios within the Type II SNae group. The metallicity is controlled by O, which has little spectroscopic signature (TB95), while a major spectral impact comes from Mg. Our inferred values of thus depend critically on the assumption that Mg and O track one another. Breaking this link, e.g., by enhancing Mg over O, could reduce our inferred ’s substantially. For example, suppose that [O/H] is always solar regardless of Mg (this would place O in the depressed group in metal-rich galaxies). Since O contributes half the mass in (see Table 4), our values of would be overestimated by a factor of two. Correcting for this would reduce the typical from 0.26 to 0.13, and in so doing would increase ages by about 20%; enhancements would remain unchanged. We are thus relying quite heavily on the notion that decoupling O and Mg is astrophysically unreasonable.
Finally, our analysis assumes that isochrone shape and location are unaffected by the exact value of or by the detailed pattern of element enhancements within . Existing models suggest that this assumption might be tolerable. Salaris & Weiss (1998) have calculated an isochrone for an old population model with , , and non-solar . Log at the turnoff shifts to the blue by 0.0044, while log on the RGB shifts to the blue by 0.011 relative to a scaled solar model. The blueward shifts should scale in proportion to both and , while the shape change may also depend on (Salaris, Chieffi & Straniero (1993); Salaris & Weiss (1998)). A typical G93 galaxy is four times more metal-rich than their model but smaller by a factor of two in . The quantity is also likely to be smaller, being +0.07 in model 4 (Table 4) versus +0.12 in their model. On balance, the net shifts and shape changes in the elliptical isochrones are plausibly no more than twice those in their model.
The effects of such motions would be small. A shift of log at the turnoff causes a change of only 0.016 in log , for a change in age of 6%. A shift of log on the RGB causes a change in metal lines of the same amount, for a change in of about 0.05 and no change in . Even if multiplied by two, as estimated above, these effects would still be small compared to other errors. On tho other hand, it should be stressed that the effect of non-solar ratios on isochrone location is acclerating at high metallicity, and the above models were calculated for metallicities considerably smaller than what we require. A failure of O to track Mg (as mentioned above) could also introduce further shape changes that have not yet been modeled in detail. In sum, our assumption that isochrone shape and location are unaffected by the value of or by the pattern of non-solar enhancements within looks promising but is in need of further validation.
5.5. Error summary
| Source | Amount | Effect |
|---|---|---|
| Age errors: | ||
| Metal-poor BHB contamination | aaOuter regions only. | Weak- objects only |
| Blue straggler contamination | Weak- objects only | |
| Theoretical isochrones | 20–25% | Zeropoint |
| Theoretical isochrones | 20–25% | Scale |
| Theoretical response functions (TB95) | 3% | Zeropoint |
| fitting function vs. | 10% | Mainly zeropoint |
| vs. | 10% | Zeropoint |
| Unknown O/Mg ratio | 20%bbAssumes that [O/H] is always solar regardless of . | Metal-rich objects only |
| Unknown C abundance | 10% | Zeropoint |
| Effect of on isochrones | 6–12% | Zeropoint |
| Overestimation of emission correction | +3% | Zeropoint |
| Undercorrected emission fill-in | % | A few weak- objects only |
| TWFBG98 velocity dispersion correction | +25% | Weak- objects with high only |
| Metallicity errors, [Z/H]: | ||
| Theoretical response functions (TB95) | 0.10 dex | Zeropoint |
| Metal-line fitting functions | 0.05 dex | Zeropoint |
| Unknown O/Mg ratio | 100%bbAssumes that [O/H] is always solar regardless of . | Scale |
| Unknown C abundance | 0.05 dex | Zeropoint |
| Effect of on tracks | 0.05–0.1 dex | Zeropoint |
| Enhancement errors, [E/Fe]: | ||
| Theoretical response functions | 20% | Scale |
| Metal-line fitting functions | 0.10 dex | Zeropoint |
| Unknown C and O abundance | 0.01 dex | Zeropoint |
| Effect of on tracks | 0.0 dex | |
Note. — When signs are given, they are in the sense that the standard models are wrong by that amount. If no sign is given, the error could have either sign.
The results of the preceding sections, plus some additional experiments in Appendices A and B, are summarized in Table 7. Age errors are significant—several terms amount individually to 10–25% and their addition is uncertain. Some age errors are also larger for weak- objects and therefore tend to stretch or compress the age scale. However, most of the errors, including those in age, are simple zeropoint shifts. Future applications will take advantage of the relative robustness and use the data differentially.
The galaxy M 32 offers a final check on the zeropoints of both and . The integrated spectrum of M 32 has been modeled by many authors, and the upper CM diagram of the outer parts has been measured (Grillmair et al. (1996)). All spectrum modelers concur that a mix of moderately young stars of near-solar metallicity matches every known feature of the spectrum. The mean turnoff spectral type within the aperture is accurately known to be F7–8 (Faber (1972); O’Connell (1980); Rose (1994)), while the light-weighted metallicity in the Grillmair field is . The enhancement ratio is also known to be small based on the excellent spectral fits using solar-neighborhood-abundance stars (e.g., Faber (1972)).
These independently measured parameters agree well with the SSP-equivalent parameters. G93 indices for the aperture yield an SSP-equivalent age of 5 Gyr, a mean of , and an of . These parameters imply a turnoff spectral type of exactly F7–8, as the modelers have concluded, and the near-solar and also agree with their results. Extrapolating the G93 indices outward, Grillmair et al. (1996) found an SSP-equivalent age in their field of 8 Gyr, a mean of , and of . This metallicity coincides precisely with the metallicity distribution that they inferred from the color locus of the RGB for that assumed age. Putting this information together, we conclude that the actual absolute uncertainties in both and are , at least for galaxies close to solar composition like M 32.
6. Comparisons with previous studies: Evidence for intermediate-age populations
Many previous studies have examined the line strengths and colors of elliptical galaxies to determine their stellar content. A complete review of all previous models is beyond the scope of this paper (see Charlot, Worthey & Bressan 1996, Vazdekis et al. 1996, and Arimoto 1996 for comparison of some modern stellar population synthesis models, and Worthey 1998 for a historical review of the metallicities and abundance ratios of early-type galaxies). We concentrate here on previous investigations that derived SSP ages and models by using the Balmer lines. We begin with the results of TCB98 and then turn to those of other workers. Consideration of other methods, in particular those using colors, is delayed to future papers.
6.1. Model dependence of derived stellar population parameters: comparison with TCB98
In a recent paper, TCB98 have analyzed line strengths of the G93 galaxies in the context of their own stellar population models. These models are based on isochrones by Bertelli et al. (1994) (which, like ours, neglect the effects of ), the original fitting functions for and by Worthey et al. (1994) (which also neglect ), and a fitting function for Mg2 by Borges et al. (1995), who claim to take into account the effects of . Like us, TCB98 assume that their isochrones depend only on bulk metallicity but not on (which they call ). To determine the stellar population parameters , , and , TCB98 compute averaged derivatives (from their models) of (the logarithms of) Mg2, , and versus population parameters. These derivatives are then inverted to derive a series of linear equations that yield relative values of , , and as functions of Mg2, , and . This solution method is equivalent to assuming that all line strengths depend linearly on all parameters, which is marginally inconsistent with the curved shapes of the actual grids (cf. Figure 1).

Figure 10 (top row) shows the stellar population parameters derived by TCB98 as a function of our derived parameters. For this comparison we have used our enhancement model 3 with C depressed and O enhanced, which is closest to their model. While the two studies roughly agree in the distribution of ages of the G93 galaxies, they are discordant in both and , for which the slopes of their values versus ours deviate strongly from unity. These different inferred and values imply different interpretations of the star formation histories of these galaxies (particularly in the – relation; see below).
To isolate the source of the differences, we constructed new models (“Padova”) by substituting the Bertelli et al. (1994) isochrones for the RYI/VandenBerg isochrones used by W94 (Appendix A). The results are presented in the bottom row of Figure 10. The match between the new Padova models and the standard W94 models is quite good, with only slight slope changes and mild zeropoint offsets; decreases by from 10% to 30%, increases by less than dex, and increases by no more than dex in the Padova models.
The differences between the present results and those of TCB98 in the top row are therefore not caused by differences in the isochrones, but must rather stem from one of the following other differences: (1) use of different response functions for for Mg2, Fe5270, and Fe5335; (2) use of Mg2 instead of ; and/or (3) use of a linearized solution method for deriving ages, metallicities, and enhancement ratios from observed line strengths. Inspection shows that differences (2) and (3) are most likely minor; in particular, the G93 Mg2 strengths are less reliable than the strengths, but broadly the two agree fairly well. Likewise, the linearized method deviates at large distances from the middles of the grids owing to grid curvature, but these differences are not large enough to cause the global slope differences seen in Figure 10.
Difference (1), the use of different response functions, dominates the differences in and . TCB98 use the Borges et al. (1995) fitting function for Mg2, which nominally takes into account but is derived from only a small set of calibration stars.777The stellar metallicites are most likely on a different metallicity scale, as they are drawn directly from Cayrel de Strobel et al. (1997), which may be unreliable at ; see Section 5.4. The Borges et al. sample is also deficient in calibrating stars on the RGB. Furthermore, by using the original Worthey et al. (1994) fitting functions for Fe5270 and Fe5335 without correction for , they implicitly assume that metallicities can be determined from alone. In other words, the ages and metallicities of the G93 galaxies are effectively defined by the – line-strength diagram alone in the TCB98 scheme, and the enhancement ratios are defined by the offset of the galaxies in the Mg2– line-strength diagram (scaled by some factor from the Borges et al. (1995) fitting function for Mg2). By not correcting upwards for Fe-deficiency, TCB98 underestimate the metallicites and overestimate the ages and enhancement ratios . This matches the behavior of residuals seen in Figure 10.
These systematic effects cause TCB98 to find a much narrower spread in in in the centers of the G93 galaxies than we do, and also a much wider spread in . The narrow spread in prevents them from finding any age–metallicity relation, which is a major focus of our Paper II; conversely, the broad spread in causes them to find a strong age–enhancement ratio relation, which we do not find in Paper II. Further discussion of these trends is reserved to future papers. However, it is clear that the adopted response functions can have far-reaching consequences for parameter correlation studies.
6.2. Other authors
Few other authors have fitted stellar population parameters to Balmer line data. Kuntschner (1998; Kuntschner & Davies (1998)) has studied the line strengths of a complete, magnitude-limited () sample of early-type galaxies in the Fornax cluster, split evenly between ellipticals and lenticulars. He derives stellar population parameters but does not correct his line strengths for non-solar abundance ratios. In general, Kuntschner finds old ages for ellipticals but a wide spread in the ages of S0s. His data are of excellent quality, and we lump them together with the G93 sample and analyze them in parallel in Paper II.
Using moderate- () long-slit and fiber spectroscopy, Jørgensen (1999) has studied the line strengths of 115 early-type galaxies in Coma. Of these galaxies, 71 have measured , and (the last with typical errors of Å). However, Trager (1997) has shown that errors in of this magnitude (typical of the Lick/IDS galaxy sample; TWFBG98) seriously compromise the determination of stellar population parameters through correlated errors in age, metallicity, and enhancement ratio; errors of Å in are required to determine ages to 10% or better and to reduce the correlated errors to insignificant levels. Further consideration of Jorgensen’s work is reserved to Paper II.
Vazdekis et al. (1997) fit their own SSP-equivalent models to three early-type galaxies, including NGC 3379 and NGC 4472 studied here. Their derived ages are about 50% larger than ours, for a variety of reasons. Although is included in the suite of data fitted, it is only one among many features used. The resultant models significantly under-predict their own strengths, and matching them would yield ages as young or younger than we find. Their high ages (and low metallicities) seem to be driven by the very red near-IR colors of their models at high , which in turn may stem from the cool giant-branch tips of the Padova isochrones used. Since giant-branch temperatures are still in flux, we prefer the Balmer lines, which are less sensitive to stellar evolution uncertainties.
Fisher, Franx & Illingworth (1995) studied the line strengths of nearby field ellipticals and brightest cluster galaxies (BCG). All of the nearby ellipticals (seven galaxies) were drawn from G93; the data are consistent, and we have therefore not added them to this series of papers. The BCG data are of slightly lower quality as the galaxies are more distant. Fisher et al. compare their line strengths to the W94 models—ignoring variations—and generally find old ( Gyr) mean stellar populations in the centers. However, two of nine BCGs have strengths indicative of intermediate-age populations, NGC 2329 (Abell 569) and NGC 7720 (Abell 2634).
Jones & Worthey (1995) developed a novel H index that has lower sensitivity to metallicity, and therefore in principle better age discrimination. Using W94 models, they applied this index to the center of M 32 and determined an SSP age of –7 Gyr. Our age for this object is only Gyr (with dex; formal errors only). Jones and Worthey also fitted other Balmer indices (including different versions of H), which gave similarly low ages. They were not able to identify a reason for the discrepancy. This disagreement among Balmer indices is an outstanding issue.
Finally, we mention the results of Rose (1985, 1994) for a sample of 10 normal elliptical nuclei, 6 of which overlap with our sample, including M 32. Rose’s spectra were taken around the 4000 Å break, and he developed a large number of stellar population indicators in this wavelength region, including the Balmer index Ca II HH/Ca II K, a sensitive measure of the presence of hot A and B stars, and Sr II/Fe I, a measure of the total dwarf-to-giant light. By balancing these and other indices, Rose found that there must be a substantial intermediate-temperature component of dwarf light in all of these galaxies, but that no more than 2% of 4000 Å light could come from stars hotter than F0. He concluded that all 10 galaxies contained a significant component of intermediate-age main sequence stars. Our SSP ages range from 3 to 10 Gyr for the 6 galaxies in common, consistent with these conclusions.
7. Summary
We have presented central () and global () line strengths for the González (1993) local elliptical galaxy sample. A method for deriving SSP-equivalent stellar population parameters is presented using the models of Worthey (1994), supplemented by model-atmosphere line-strength response functions for non-solar element abundance ratios by Tripicco & Bell (1995). The resultant stellar population parameters broadly confirm the findings of G93 in showing a wide range of ages but a fairly narrow range of metallicities and enhancement ratios. Differences among galaxies in the sample are larger than radial differences within them.
Four different models are considered with different patterns of element enhancement. The best-fitting model (model 4) has all elements enhanced or normal except for the Fe-peak (and Ca), which are depressed. The actual atomic abundance ratios of the so-called “enhanced” elements are in fact virtually solar—it is really the Fe-peak elements that are depressed. Indeed, the TB95 response functions imply that the observed strengthening of is not due to an overabundance of Mg but to an underabundance of Fe (and Cr). It is shown that C must also belong to the enhanced group (i.e., it does not follow Fe, as sometimes assumed). Hence, a more accurate description of elliptical galaxies is that they failed to make Fe-peak elements rather than that they made an overabundance of -elements. The element enhancement pattern of ellipticals will be considered in more detail in a future paper.
Sources of error in the population parameters are considered. Contamination of by hot stars such as horizontal branch stars and blue stragglers can cause small reductions in the measured ages of the oldest galaxies but cannot noticeably affect the strong lines, and thus the deduced low ages, of young ellipticals (as also found by Rose (1985), 1994 and Greggio (1997)). Emission fill-in may increase the measured ages of a few, largely old galaxies, but the broad age distribution is unaffected by whether any emission corrections are made or not. Uncertainties in the theoretical tracks, index response functions, element enhancement patterns, and the Lick/IDS metallicity scale all affect the absolute zero points of age, , and at the level of a few tens of percent or tenths of a dex—but not the relative age rankings among galaxies.
Finally, we have compared our population parameters to those derived by TCB98, who apply a different modeling technique to the G93 sample. Our values of and correlate with theirs, but the slopes differ significantly from unity. This appears to stem from the use of different response functions; in particular, TCB98 do not correct for the underabundance of Fe. When this is allowed for, the two studies are consistent.
Future papers will discuss the central stellar populations of the G93 sample in detail, correlations between stellar populations and structural parameters, scaling relation of these local ellipticals in the context of stellar populations, and stellar population gradients in elliptical galaxies.
References
- Arimoto (1996) Arimoto, N. 1996, in From Stars to Galaxies: The Impact of Stellar Physics on Galaxy Evolution, ed. C. Leitherer, U. Fritze-von Alvensleben, & J. Huchra, A. S. P. Conf. Ser., vol. 98 (San Francisco: ASP), p. 287
- Bailyn (1995) Bailyn, C. D. 1995, ARA&A, 33, 133
- Baum (1959) Baum, W. A. 1959, PASP, 71, 106
- Bertelli et al. (1994) Bertelli, G., Bressan, A., Chiosi, C., Fagotto, F., & Nasi, E. 1994, A&AS, 106, 275
- Bessel et al. (1989) Bessel, M. S., Brett, J. M., Scholz, M., & Wood, P. R. 1989, A&AS, 77, 1
- Bessel et al. (1991) Bessel, M. S., Brett, J. M., Scholz, M., & Wood, P. R. 1991, A&AS, 89, 335
- Borges et al. (1995) Borges, A. C., Idiart, T. P., de Freitas Pacheco, J. A., & Thevenin, F. 1995, AJ, 110, 2408
- Bressan, Chiosi, & Tantalo (1996) Bressan, A., Chiosi, C., & Tantalo, R. 1996, A&A, 311, 425
- Burstein et al. (1984) Burstein, D., Faber, S. M., Gaskell, C. M., & Krumm, N. 1984, ApJ, 287, 586
- Burstein et al. (1988) Burstein, D., Bertola, F., Buson, L. M., Faber, S. M., & Lauer, T. R. 1988, ApJ, 328, 440
- Carrasco et al. (1996) Carrasco, L., Buzzoni, A., Salsa, M., & Recillas-Cruz, E. 1996, in Fresh Views on Elliptical Galaxies, eds. A. Buzzoni, A. Renzini, & A. Serrano, A. S. P. Conf. Ser., vol. 86 (San Francisco: ASP), p. 235
- Castro et al. (1996) Castro, S., Rich, R. M., McWilliam, A., Ho, L. C., Spinrad, H., Filippenko, A. V., & Bell, R. A. 1996, AJ, 111, 2439
- Cayrel de Strobel et al. (1997) Cayrel de Strobel, G., Soubiran, C., Friel, E. D., Ralite, N., & Francois, P. 1997, A&AS, 124, 299
- Chaboyer et al. (1998) Chaboyer, B., Demarque, P., Kernan, P. J., & Krauss, L. M. 1998, ApJ, 494, 96
- Charlot & Bruzual (1991) Charlot, S. & Bruzual, G. 1991, ApJ, 367, 126
- Charlot, Worthey & Bressan (1996) Charlot, S., Worthey, G., & Bressan, A. 1996, ApJ, 457, 625
- Couch & Sharples (1987) Couch, W. J. & Sharples, R. A. 1987, MNRAS, 229, 423
- Davies et al. (1993) Davies, R. L., Sadler, E. M., & Peletier, R. F. 1993, MNRAS, 262, 650
- de Vaucouleurs et al. (1991) de Vaucouleurs, G., de Vaucouleurs, A., Corwin, H. G., Buta, R. J., Paturel, G., & Fouque, P. 1991, Third Reference Catalogue of Bright Galaxies (New York: Springer-Verlag) (RC3)
- Dressler and Gunn (1983) Dressler, A. & Gunn, J. E. 1983, ApJ, 270, 7
- Edvardsson et al. (1993) Edvardsson, B., Andersen, J., Gustafsson, B., Lambert, D. L., Nissen, P. E., & Tomkin, J. 1993, A&A, 275, 101
- Faber (1972) Faber, S. M. 1972, A&A, 20, 361
- Faber (1973) Faber, S. M. 1973, ApJ, 179, 731
- Faber & Jackson (1976) Faber, S. M. & Jackson, R. E. 1976, ApJ, 204, 668
- Faber et al. (1985) Faber, S. M., Friel, E. D., Burstein, D., & Gaskell, C.M 1985, ApJS, 57, 711
- Faber et al. (1989) Faber, S. M., Wegner, G., Burstein, D., Davies, R. L., Dressler, A., Lynden-Bell, D., & Terlevich, R. J. 1989, ApJS, 69, 763
- Faber et al. (1995) Faber, S. M., Trager, S. C., González, J. J., & Worthey, G. 1995, in IAU Symposium 164, Stellar Populations, eds. P. C. van der Kruit & G. Gilmore (Dordrecht: Kluwer), p. 249
- Ferraro, Fusi Pecci & Bellazzini (1995) Ferraro, F. R., Fusi Pecci, F., & Bellazzini, M. 1995, A&A, 294, 80
- Fisher, Franx, & Illingworth (1995) Fisher, D., Franx, M., & Illingworth, G. 1995, ApJ, 448, 119
- Fisher, Franx, & Illingworth (1996) Fisher, D., Franx, M., & Illingworth, G. 1996, ApJ, 459, 110
- González (1993) González, J. J. 1993, Ph.D. thesis, University of California, Santa Cruz (G93)
- Gorgas et al. (1993) Gorgas, J., Faber, S. M., Burstein, D., González, J. J., Courteau, S., & Prosser, C. 1993, ApJS, 86, 153
- Gottlieb & Bell (1971) Gottlieb, D. J. & Bell, R. A. 1971, A&A, 19, 434
- Goudfrooij & Emsellem (1996) Goudfrooij, P. & Emsellem, E. 1996, A&A, 306, L45
- Gratton et al. (1997) Gratton, R. G., Fusi Pecci, F., Carretta, E., Clementini, G., Corsi, C. E., & Lattanzi, M. 1997, ApJ, 491, 749
- Green, Demarque & King (1987) Green, E. M., Demarque, P., & King, C. R. 1987, The Revised Yale Isochrones and Luminosity Functions (New Haven: Yale University Observatory)
- Greggio (1997) Greggio, L. 1997, MNRAS, 285, 151
- Grevesse, Noels & Sauval (1996) Grevesse, N., Noels, A., & Sauval, A. J. 1996, in Cosmic Abundances, eds. S. S. Holt & G. Sonneborn, A.S.P. Conf. Ser., vol. 99 (San Francisco: ASP), p. 117
- Grillmair et al. (1996) Grillmair, C. J., et al. 1996, AJ, 112, 1975
- Grundahl, Vandenberg & Andersen (1998) Grundahl, F., Vandenberg, D. A., & Andersen, M. I. 1998, ApJ, 500, L179
- Gustafsson, Kjærgaard & Anderson (1974) Gustafsson, B., Kjærgaard, P., & Anderson, S. 1974, A&A, 34, 99
- Gunn & Stryker (1983) Gunn, J. E. & Stryker, L. L. 1983, ApJS, 52, 121
- Hansen & Kjærgaard (1971) Hansen, L. & Kjærgaard, P. 1971, A&A, 15, 123
- Ho, Filippenko & Sargent (1997) Ho, L. C., Filippenko, A. V., & Sargent, W. L. W. 1997, ApJS, 112, 315
- Iglesias, Rogers & Wilson (1992) Iglesias, C. A., Rogers, F. J., & Wilson, B. G. 1992, ApJ, 397, 717
- Jensen, Luppino, & Tonry (1996) Jensen, J. B., Luppino, G. A., & Tonry, J. L. 1996, ApJ, 468, 519
- Jensen, Tonry, & Luppino (1998) Jensen, J. B., Tonry, J. L., & Luppino, G. A. 1998, ApJ, 505, 111
- Johnson (1966) Johnson, H. L. 1966, ARA&A, 4, 193
- Jones & Worthey (1995) Jones, L. A. & Worthey, G. 1995, ApJ, 446, L31
- Jørgensen (1997) Jørgensen, I. 1997, MNRAS, 288, 161
- Jørgensen (1999) Jørgensen, I. 1999, MNRAS, 306, 607
- Kuntschner (1999) Kuntschner, H. 1999, Ph.D. thesis, University of Durham
- Kuntschner & Davies (1998) Kuntschner, H. & Davies, R. L. 1998, MN, 295, L29.
- Kurucz (1992) Kurucz, R. L. 1992, unpublished
- Lee (1994) Lee, Y.-W. 1994, ApJ, 430, 113
- Liebert, Saffer & Green (1994) Liebert, J., Saffer, R. A., & Green, E. M. 1994, AJ, 107, 1408
- Matteucci (1994) Matteucci, F. 1994, A&A, 288, 57
- McClure & van den Bergh (1968) McClure, R. D. & van den Bergh, S. 1968, AJ, 73, 313
- McWilliam (1997) McWilliam, A. 1997, ARA&A, 35, 503
- McWilliam & Rich (1994) McWilliam, A. & Rich, R. M. 1994, ApJS, 91, 749
- O’Connell (1976) O’Connell, R. W. 1976, ApJ, 206, 370
- O’Connell (1980) O’Connell, R. W. 1980, ApJ, 236, 430
- Peletier (1989) Peletier, R. 1989, Ph.D. thesis, Rijksuniversiteit Groningen
- Pont et al. (1998) Pont, F., Mayor, M., Turon, C., & Vandenberg, D. A. 1998, A&A, 329, 87
- Rabin (1982) Rabin, D. 1982, ApJ, 261, 85
- Reid (1997) Reid, I. N. 1997, AJ, 114, 161
- Reid (1998) Reid, I. N. 1998, AJ, 115, 204
- Renzini (1986) Renzini., A. 1986, in Spectral Evolution of Galaxies, eds. C. Chiosi & A. Renzini (Dordrecht: Kluwer), p. 151
- Rich (1988) Rich, R. M. 1988, AJ, 95, 828
- Rich et al. (1997) Rich, R. M., et al. 1997, ApJ, 484, L25
- Robinson & Wampler (1972) Robinson, L. B. & Wampler, E. J. 1972, PASP, 84, 161
- Rose (1985) Rose, J. A. 1985, AJ, 90, 1927
- Rose (1994) Rose, J. A. 1994, AJ, 107, 206
- Salaris, Chieffi & Straniero (1993) Salaris, M. , Chieffi, A. & Straniero, O. 1993, ApJ, 414, 580
- Salaris & Weiss (1998) Salaris, M. & Weiss, A. 1998, A&A, 335, 943
- Sandage & Bedke (1994) Sandage, A. & Bedke, J. 1994, The Carnegie Atlas of Galaxies (Washington, D.C.: Carnegie Institution of Washington with the Flintridge Foundation)
- Sandage & Tammann (1987) Sandage, A. & Tammann, G. A. 1987, A Revised Shapley-Ames Catalog of Bright Galaxies, 2nd ed. (Washington, D. C.: Carnegie Institution of Washington) (RSA)
- Schweizer et al. (1990) Schweizer, S., Seitzer, P., Faber, S. M., Burstein, D., Dalle Ore, C. M., & González, J. J. 1990, ApJ, 364, L33
- Schweizer & Seitzer (1992) Schweizer, F. & Seitzer, P. 1992, AJ, 104, 1039
- Spinrad & Taylor (1971) Spinrad, H. & Taylor, B. J. 1971, ApJS, 22, 445
- Sosin et al. (1997) Sosin, C., et al. 1997, in Advances in Stellar Evolution, eds. R. T. Rood & A. Renzini (Cambridge: Cambridge University Press), p. 92
- (82) Tantalo, R., Chiosi, C., & Bressan, A. 1998, A&A, 333, 419 (TCB98)
- (83) Tantalo, R., Chiosi, C., Bressan, A., Marigo, P., & Portinari, L. 1998b, A&A, 335, 823
- Trager (1997) Trager, S. C. 1997, Ph.D. thesis, University of California, Santa Cruz
- Trager et al. (1998) Trager, S. C., Worthey, G., Faber, S. M., Burstein, D., & Gonzàlez, J. J. 1998, ApJS, 116, 1 (TWFBG98)
- Tripicco & Bell (1995) Tripicco, M. & Bell, R. A. 1995, AJ, 110, 3035 (TB95)
- VandenBerg (1985) VandenBerg, D. A. 1985, ApJS, 58, 711
- VandenBerg & Bell (1985) VandenBerg, D. A. & Bell, R. A. 1985, ApJS, 58, 561
- VandenBerg & Laskarides (1987) VandenBerg, D. A. & Laskarides, P. G. 1987, ApJS, 64, 103
- Vazdekis et al. (1996) Vazdekis, A., Casuso, E., Peletier, R. F., & Beckman, J. E. 1996, ApJS, 106, 307
- Vazdekis et al. (1997) Vazdekis, A., Peletier, R. F., Beckman, J. E., & Casuso, E. 1997, ApJS, 111, 203
- Weiss, Peletier & Matteucci (1995) Weiss, A., Peletier, R. F., & Matteucci, F. 1995, A&A, 296, 73
- Wheeler, Sneden & Truran (1989) Wheeler, J. C, Sneden, C. & Truran, J. W. 1989, ARA&A, 27, 279
- Woosley & Weaver (1995) Woosley, S. E. & Weaver, T. A. 1995, ApJS, 101, 181
- Worthey (1992) Worthey, G. 1992, Ph.D. thesis, University of California, Santa Cruz
- Worthey (1993) Worthey, G. 1993, ApJ, 415, L91
- Worthey (1994) Worthey, G. 1994, ApJS, 95, 107 (W94)
- Worthey (1998) Worthey, G. 1998, PASP, 110, 888
- Worthey, Faber & González (1992) Worthey, G., Faber, S. M., & González, J. J. 1992, ApJ, 398, 69
- Worthey et al. (1994) Worthey, G., Faber, S. M., González, J. J., & Burstein, D. 1994, ApJS, 94, 687
- Worthey & Ottaviani (1997) Worthey, G. & Ottaviani, D. L. 1997, ApJS, 111, 377
- Yi et al. (1999) Yi, S., Lee, Y.-W., Woo, J.-H., Park, J.-H., Demarque, P. & Oemler, A., Jr. 1999, ApJ, 513, 128
Appendix A Stellar population parameters using Padova isochrones
This section provides more details on the “Padova” models discussed in Section 6.1. The Padova models are identical to the W94 models except that the isochrones (and opacities) are replaced by the isochrone library of Bertelli et al. (1994). This isochrone library is based on the stellar evolutionary tracks developed by the Padova group (see Bertelli et al. 1994 and Charlot, Worthey, & Bressan 1996 for more details) using the Iglesias, Rogers & Wilson (1992) radiative opacities. These isochrones include all phases of stellar evolution from the ZAMS to the remnant stage for stars of masses in the age range Gyr and metallicity range (). The models include convective overshooting in stars more massive than and an analytic prescription for the TP-AGB regime.
Figure 1 presents the inferred , , and line strengths for the W94 models using the Padova isochrones. Comparing this with Figure 1 shows small differences: the Padova models have a higher metallicity at a given or strength and a younger age at a given strength.

Figure 10 (bottom row) shows the results of applying these new models to the G93 central () line strengths. The derived ages, metallicities, and enhancement ratios agree quite well with the W94 models, apart from slight slope changes and zeropoint offsets:
| (A1) | |||||
| (A2) | |||||
| (A3) |
The above are linear least-square fits using enhancement model 4 and rejecting 3- outliers. The fit for is in accordance with the results of Charlot, Worthey & Bressan (1996): changing isochrones can alter the inferred ages from line strengths at young ages by as much as ; agreement at old ages is within 10%. On average, the inferred metallicities are increased by in the Padova models, as expected at fixed line strengths from the 3/2 rule ( between the two sets of models).
Appendix B Corrections to
B.1. Emission corrections
This section presents stellar population parameters derived by omitting the emission fill-in correction to discussed in Section 2.2.2. This follows the suggestion by Carrasco et al. (1996) that no correction to should be made for residual emission based on [O III], as they find no such correlation in their own sample of early-type galaxies.


Figure 1 presents the Balmer–metal–line diagrams for the G93 galaxies through the aperture with the correction omitted. As expected from the additive nature of the correction, galaxies now appear lower in the grid, and therefore older and more metal-poor than in Figure 1. Neglecting emission corrections forces some galaxies to have unreasonably old ages: for example, without corrections, NGC 1453, NGC 2778, NGC 4261, NGC 4374, NGC 5813, NGC 5846, NGC 7052 have ages 20 Gyr. Since all of these galaxies have clear emission (see Figs. 3.11 and 4.10 of G93), omitting the corrections makes no sense. Furthermore, careful checking reveals that a few galaxies (e.g., NGC 4552, NGC 4649, NGC 5813, NGC 5846, NGC 7052) actually appear to have a little stronger than the standard ratio and are therefore probably undercorrected in our standard treatment. Fixing them would move them up by a few hundredths in log and decrease their ages by 20%. Since some of these are also objects that lie low in the grid, this correction would improve their positions.
Figure 1 without corrections looks essentially like the original one—the large age spread and relative parameter rankings of the galaxies are essentially the same. This point is reinforced in the histograms of Figure 2, which are nearly identical to those in Figure 7. We conclude that emission corrections are needed to derive the best age estimates for early-type galaxies, but that their exact magnitude does not affect our broad conclusions.
B.2. Velocity dispersion corrections


This section derives a third set of population parameters using the Lick/IDS velocity dispersion corrections of TWFBG98 for rather than the template-based corrections of G93. As G93 does not provide raw strengths, we use his Figure 4.1 to estimate his velocity corrections and use them to “uncorrect” the fully corrected line strengths back to raw strengths (after removing the emission correction discussed in Section 2.2.2). For most galaxies, G93’s velocity corrections are insignificant, but for high- galaxies they tend to be negative. After the G93 corrections are removed, we apply the positive corrections presented in TWFBG98 (their Figure 3) and then reapply the emission corrections discussed in Section 2.2.2. The newly corrected line strengths are plotted in Figure 3, and the resulting stellar population parameter histograms are presented in Figure 4.
The new corrections move only a few high- galaxies, and therefore the relative age ranking of the sample is unaffected. The affected galaxies again tend to lie at the bottom of the grid and are again moved up by the new corrections (by 0.04 in log ) so that galaxies that formerly lay below the grid at high ages now tend to lie on it. This correction, like the refined emission corrections of the previous section, thus improves the ages of the oldest objects.
The G93 velocity corrections were based on a very high-S/N stellar template fit to each galaxy, whereas the TWFBG98 corrections are based on a statistical average over stellar spectral types whose correction curves scattered widely. Nevertheless, it is possible that the TWFBG98 corrections are actually more acurate. The G93 stellar templates are a superb match to most of the spectrum except at , where emission corrupted the data. Hence the template match (and correction) at in particular may be poor. The TWFBG98 corrections were selected to match a large number of stars with about the same strength as typical galaxies and could therefore be better on average.