2-D Radiation Transfer Model of Non-Spherically Symmetric Dust Shell in Proto-Planetary Nebulae
Abstract
We have fitted the HST images and the spectral energy distributions (SEDs) of three proto-planetary nebulae (PPN) with a 2-D radiation transfer model. The geometric and mass loss properties of these PPN are also derived.
Department of Physics & Astronomy, University of Calgary, Calgary, Canada T2N 1N4
1. Introduction
The detection of bipolar reflection nebulosities in PPN suggests that the dust envelopes in PPN are highly asymmetric. (see Hrivnak, these proceedings). In order to model these objects, a 2-D radiation transfer model is necessary. However, a fully self-consistent determination of the source function in 2-D is impractical not only because of the large computing time required, but also in the lack of knowledge of the physical details of the scattering process. Since the morophology of the nebulae will be primarily determined by the geometry and orientation of the envelope, we have developed an approximate solution to simultaneously fit the SED and images of a centrally-heated dust envelope. In this paper, we report the models for 3 PPN, IRAS 17105-3224, IRAS 18095+2704 and IRAS 17441-2411, where HST images are available.

2. The Model
The dust envelope is assumed to be axial symmetric where the density distribution is assumed to have radial cutoffs at and . The plane perpendicular to () is referred to as the “equatorial plane” and the directions along the axis ( and ) are referred to as the two “poles”. The density is assumed to decrease from the equator to the poles in the form of a power law (). In order to produce the searchlight beams observed in the PPN, IRAS 17150-3224 (Kwok et al. 1998), cavities can be put in the density distribution simply assuming a open-cone structure, where drops by a factor of inside the cone. A disk can also be put in the density distribution in order to reprduce the dark lane observed in IRAS 17441-2411 (Su et al. 1998). The viewing angle is defined as if the object is viewed along the pole (pole-on), and if it is viewed along the equator (edge-on).
We first solve the dust temperature distribution at the “polar” and “equatorial” directions from 1-D radiation transfer models. The values at other angles are then obtained by interpolation using a power law:
The three power indices () are adjusted until best fits are obtained for both the SED and the images. Specifically, can be constrained by the infrared color ([60]-[100] m) because the total amount of dust is fixed. determines the degree of asymmetry and is constrained by the observed width of the reflection nebula. is basically the same as , but can be adjusted in order to get the total energy conserved. The viewing angle i can be determined by comparing the flux ratio of the two reflection lobes in the simulated image to the one in the observed image.
IRAS 17150-3224 and IRAS 18095+2704 are both O-rich objects, as evidenced by the presence of the 9.7m silicate feature in the IRAS Low Resolution Spectra (LRS); therefore, we use silicate dust grains in the fitting. The strength of the silicate feature is also used to constrain the dust opticall depth along the line of sight. IRAS 17441-2411 shows no feature in IRAS LRS, we adopted amorphous carbon dust grains in the fitting.
3. Results
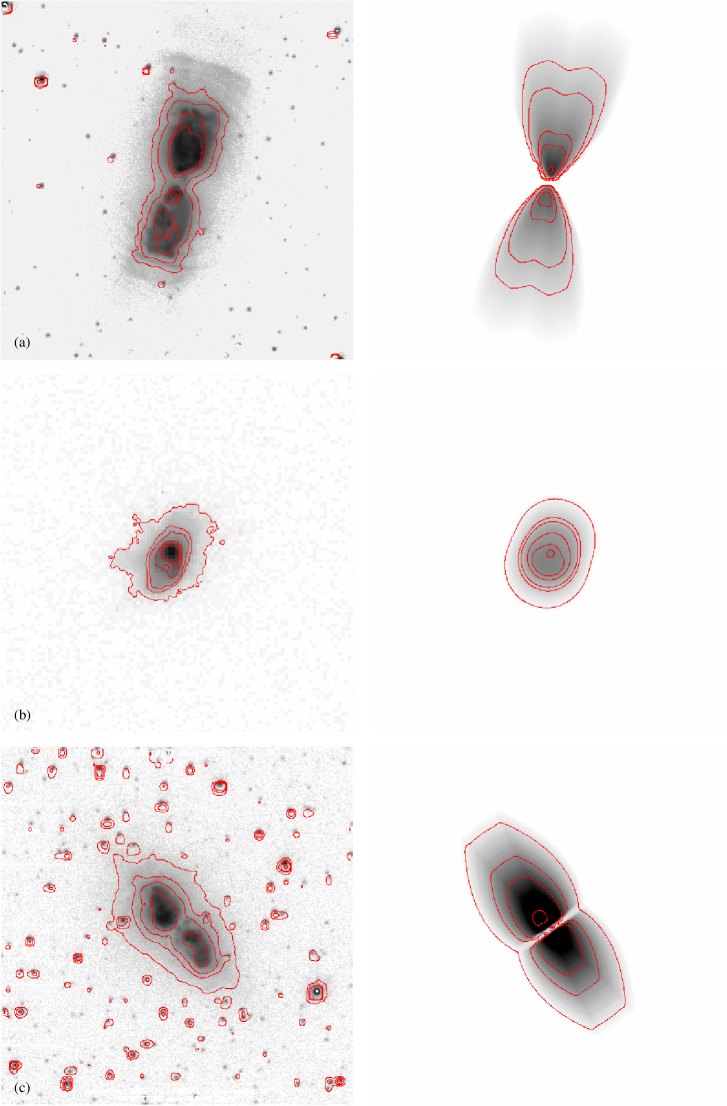
Table 1 lists all the fitting parameters we used. Figure 1 shows model fits to the SED for these three objects. Figure 2 shows the comparision between the observed model images. The model images not only reproduce the approximate shapes of the PPN, but also the absolute flux levels (as evidenced by the sizes of the outermost contour). In addition, searchlight beams in IRAS 17150-3224 and dark lane in IRAS 17441-2441 are successfully reproduced as well.
| IRAS | 17150-3224 | 18095+2704 | 17441-2411 |
|---|---|---|---|
| 82 | 60 | 85 | |
| () | (2.0, 1.5, 1.0) | (3.5,1.5,1.5) | (2.0,0.5,0.5) |
| 0.3, 4.5 | 0.0736, 0.9 | 0.005, 0.05 | |
| openning angle of cone | 12∘ | – | – |
| 0.005 | – | – | |
| openning angle of disk | – | – | 5∘ |
| density enhancement | – | – | 20 |
References
Kwok, S., Su, K.Y.L., and Hrivnak, B.J. 1998, ApJ, 501, L117
Su, K.Y.L., Volk, K., Kwok, S. and Hrivnak, B.J. 1998, ApJ, 508, 744