A Hard Medium Survey with ASCA.III.: a Type 2 AGN revealed from X-ray spectroscopy ††thanks: Based on observations performed at the European Southern Observatory, Paranal, Chile
Abstract
In this paper we report the discovery of an hard X-ray selected Type 2 Seyfert galaxy and we present and discuss its X-ray and optical spectrum together with the radio to X-ray energy distribution. The X-ray source - AXJ2254+1146 - is part of the ASCA Hard Serendipitous Survey (HSS). What makes this discovery particularly noteworthy is the fact that the Type 2 classification of this Seyfert galaxy has resulted directly from the X-ray data and has been confirmed by optical spectroscopy only subsequently.
The X-ray spectrum of AXJ2254+1146 is best described by a model consisting of an unresolved Gaussian line at keV plus the so called “leaky-absorber” continua having an intrinsic power law photon index of = (1 confidence interval). The best fit values of the absorbing column density ( = cm-2), of the line equivalent width ( keV) and of the scattering fraction (), lead us to classify it as a Type 2 AGN from an X-ray point of view.
Inspection of the POSS II image reveals the presence, within the ASCA X-ray error circle, of the nearby Sbc spiral galaxy UGC 12237 () that, even on positional ground considerations alone, is the most likely optical counterpart of AXJ2254+1146. Subsequent optical spectroscopy of UGC 12237 has confirmed its Seyfert 2 optical nature.
1 Introduction
Absorbed (Type 2) AGN have been proposed as the major contributors to the Cosmic X-ray Background (CXB) above 2 keV (see among others Setti and Woltjer, 1989; Madau, Ghisellini and Fabian, 1994; Comastri et al., 1995). Indeed, recent results from ASCA and Beppo-SAX observations (Akiyama et al., 1998a; Bassani et al.,1999; Risaliti, Maiolino and Salvati, 1999; Fiore et al., 1999) seem to favor this hypothesis but deeper investigations are still needed to confirm and refine this scenario and to test competing models. For example it is not clear if high luminosity Type 2 AGN exist or not (see e.g. Halpern, Turner and George, 1999; Akiyama et al., 1998a) or if a significant fraction of the hard CXB deriving from star-burst and star-forming galaxies at moderate redshift can be excluded or not (see e.g. Moran, Lehnert and Helfand, 1999).
At the Osservatorio Astronomico di Brera, with the specific aim of extending to faint fluxes the census of the X-ray sources shining in the hard X-ray sky, we have initiated a few years ago the ASCA Hard Serendipitous Survey (HSS: see Della Ceca at al., 1999a for a progress update): a systematic search for sources in the keV band, using data from the GIS2 instrument on board the ASCA satellite (Tanaka, Inoue and Holt, 1994). This effort has lead to a “pilot” sample of 60 sources (Cagnoni, Della Ceca and Maccacaro, 1998) whose spectral properties have been presented and discussed by Della Ceca at al., (1999b). The ASCA HSS has been extended and it now covers deg2 of sky. The resulting source sample consists of 189 sources detected with a signal-to-noise ratio (Della Ceca at al., 1999a, 2000), a more restrictive criterion than that used in Cagnoni, Della Ceca and Maccacaro, 1998 where a signal-to-noise ratio was used.
In this paper we report the serendipitous discovery of a low luminosity Type 2 AGN: AXJ2254+1146. Its absorbed Type 2 nature has been revealed by the X-ray data alone, thanks to the good spectral resolution of the ASCA GIS ( at keV). We are convinced that the new generation of X-ray telescopes (e.g. Chandra, XMM) will make AXJ2254+1146 only the first one of several objects whose nature will be discovered by means of the X-ray data alone.
The paper is organized as follows. In section 2 we present the X-ray data and discuss the X-ray spectral properties of AXJ2254+1146. In section 3 we present its optical identification (UGC 12237), while in section 4 we discuss the overall Spectral Energy Distribution (SED) of the source and compare it with the SED of Seyfert 2 and non-AGN spiral galaxies. An optical spectrum of UGC 12237 is shown and discussed in section 5. Finally, summary and conclusions are presented in section 6. We adopt km s-1 Mpc-1 and throughout.
2 X-ray Data and Analysis
2.1 X-ray Imaging
AXJ2254+1146 was discovered in the ASCA GIS field 74076000 111The ASCA satellite also has two solid-state imaging spectrometer (SIS) on the focal plane. Unfortunately this observation was operated in the “2 CCD mode” configuration and AXJ2254+1146 is out of the investigated sky region. So we do not have SIS data on this source. pointed at the radio loud quasar PKS2251+113 ( and ; z=0.323). The field is one of the many used to extend the survey of Cagnoni, Della Ceca and Maccacaro 1998; data preparation and analysis have been discussed in detail therein and in Della Ceca et al., 1999b. This source attracted our attention because its hardness ratios (HR1 = ; HR2 = ) 222 HR1 and HR2 are defined in the following way: where S, M and H are the corrected net counts in the 0.7-2.0, 2.0-4.0 and 4.0-10.0 keV energy band respectively (cf. Della Ceca et al., 1999b). can not be explained by a single absorbed power law model, implying a more complex and structured X-ray spectrum (cf. Della Ceca et al., 1999b).
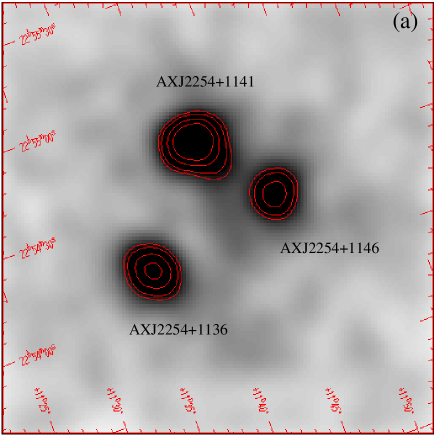
Panel (a) of Figure 1 shows the central () smoothed 333The smoothing function is a two-dimensional Gaussian filter with , which is comparable to the “core” of the (XRT+GIS2) point-spread function (PSF). GIS2 hard (2-10 keV) image with overlaid a contour plot indicating the X-ray emission intensity. Three sources are clearly visible in the 2-10 keV band image: the target of the observation, (AXJ2254+1136 PKS2251+113), plus two serendipitous sources, AXJ2254+1141 and AXJ2254+1146. AXJ2254+1141 is identified with MS2252.2+1126, a Type 1 AGN at z=0.0281 (Stocke et al., 1991, Maccacaro et al, 1994).
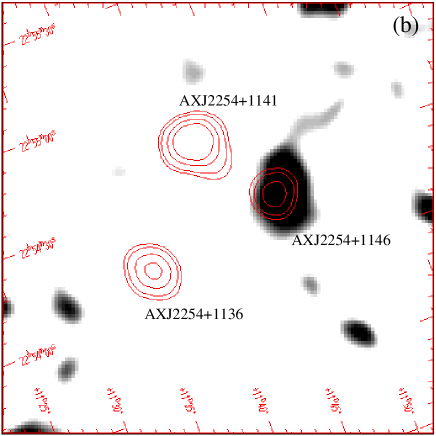
Panel (b) shows a “hard-over-soft” image obtained dividing the smoothed “hard” (2-10 keV) image by the smoothed “soft” (0.7 - 2.0 keV) image. The same contours of panel (a) have been overlaid on the image for ease of comparison. AXJ2254+1146 stands out as a very hard source compared to the other ones.
In Table 1 the X-ray position, the optical position and the offset between the two (X-ray - optical) are listed for the three sources previously mentioned. The measured offsets are consistent with the positional uncertainties of the ASCA GIS images 444The positional uncertainty of the ASCA detected sources has been investigated by Gotthelf (1996) using 48 point-like sources. He reached the conclusion that, in the case of the combination XRT+SIS, the 90% confidence level error circle is of the order of radius, while in the case of the XRT+GIS additional instrumental and calibration uncertainties can produce larger errors. From the analysis of a sample of 168 point-like ASCA targets within the data set used for the ASCA HSS we have estimated a 90% confidence level error circle of arcmin radius. .
| Name | Ra; Dec | Ra; Dec | Offset | ID | Note |
|---|---|---|---|---|---|
| (J2000) | (J2000) | RA; Dec | |||
| X | Optical | (arcsec) | |||
| AXJ2254+1136 | 22 54 11.3; +11 35 51.5 | 22 54 10.5; +11 36 38 | 11.8; +46.5 | PKS2251+113 | RL Type 1 AGN; target |
| AXJ2254+1146 | 22 54 20.5; +11 46 05.7 | 22 54 19.7; +11 46 57 | 11.8; +51.3 | UGC 12237 | Type 2 AGN; this paper |
| AXJ2254+1141 | 22 54 43.4; +11 41 51.2 | 22 54 43.7; +11 42 49 | +4.4; +57.9 | MS2252.2+1126 | Type 1 AGN |
2.2 X-ray Spectrum
To maximize statistics and signal-to-noise ratio, total counts (source + background) were extracted from a circular region of 2 arcmin radius around the source centroid in the GIS2 and GIS3 images. Background counts were taken from two circular uncontaminated regions of 4.75 arcmin radius close to the source. Source and background data were extracted in the “Pulse Invariant” (PI) energy channels, which have been corrected for spatial and temporal variations of the detector gain. The Ancillary Response File (ARF) was created with version 2.72 of the FTOOLS task ASCAARF at the location of the source in the detector. In order to improve the statistics, we have produced a combined GIS spectrum (adding the GIS2 and GIS3 data) and the corresponding background and response matrix files, following the recipe given in the ASCA Data Reduction Guide (rev 2.0; see section 8.9.2 and 8.9.3 and reference therein) and using the FTOOLS 4.2 software package (supplied by HEASARC at the Goddard Space Flight Center). The total ( GIS2 + GIS3) net counts in the source extraction region and in the energy interval used (0.7 – 10 keV) are , overimposed over a total background counts. In order to use the statistics in the spectral fitting procedure the combined GIS spectrum was rebinned to give at least 15 total counts per energy bin. Spectral analysis has been performed using XSPEC 10.0. All the models discussed below have been filtered by the Galactic absorption column density along the line of sight ( cm-2; Dickey and Lockman, 1990). All the errors reported in the spectral analysis are at the 68% confidence level for 1 interesting parameter (), unless explicitly quoted.
Single-component models do not provide an adequate description of the spectrum of AXJ2254+1146. A single temperature Raymond-Smith model or a single power-law model are both rejected at a high confidence level ().
We have first tried a single absorbed power law model. The best fit values for the power law photon index () and for the absorbing column density () are and cm-2, respectively. Although this fit is formally acceptable ( for 23 degree of freedom) the residuals (reported in figure 2) show an excess below 2 keV and also around 6.5 keV; a more complex spectrum is thus needed to describe the overall spectral properties of AXJ2254+1146.

We have then tried a spectral model consisting of a narrow (unresolved) Gaussian line at 6.4 keV, plus the so called “leaky-absorber” continua; the latter being composed by an absorbed plus a non-absorbed power law model having the same photon index. The absorbed power law model represents the “first order” AGN spectrum transmitted through an absorbing cold medium (torus ?) while the non-absorbed power law model represents the primary AGN spectrum scattered into our line of sight by a warm, highly ionized gas located outside the absorbing medium. The scattered fraction is given by the ratio between the normalization of the non-absorbed and absorbed power law components.
The results are reported in Table 2, while in Figure 3 we show the unfolded and folded spectrum and the residuals to the best fit model. The best fit values are = and = cm-2. The scattering fraction implied from the fit is ; the position and the observed equivalent width (EWobs. hereafter) of the line are keV and keV, respectively. Note that EWobs. has been computed against the observed total (i.e. absorbed plus non-absorbed) source continuum. As evident from the residuals shown in figure 2 and from the in Table 2 this model represent a good description of the spectrum of AXJ2254+1146. We have also tried a fit with the width of the line as a free parameter; the other best fit values are unaffected from this new fit, while, at the spectral resolution of the GIS2 instrument, the line is unresolved with a upper limit on the width of 0.6 keV. The best fit intrinsic photon index ( = ) is steeper than the mean observed photon index in Seyfert 1 galaxies (, Nandra et al., 1997). We have then tried to fit the data using the “leaky absorber” continua plus the narrow Gaussian line model but fixing ; the absorbing column density, the scattered fraction, the EWobs. and the position of the line are consistent, within the errors, with that reported in table 2.
| Normabs. | Normnon-abs. | ELine | NormLine | EWobs. | /dof | ||
| (1) | (2) | (3) | (4) | (5) | (6) | (7) | (8) |
| 0.94/20 |
NOTE – Allowed ranges are at 68% confidence level for one interesting parameter (). Columns are as follows: (1) Power-law photon index; (2) Normalization of the absorbed component in units of photons s-1 cm-2 keV-1 at 1 keV; (3) Normalization of the non-absorbed component in units of photons s-1 cm-2 keV-1 at 1 keV; (4) Intrinsic absorbing column density in units of cm-2; (5) Line energy in keV; (6) Line normalization. This number represents the total photons cm-2 s-1 in the line; (7) Observed equivalent width, i.e. the EW computed against the observed total (i.e. absorbed plus non-absorbed) source continuum; (8) Reduced and degree of freedom.

Seyfert 1 and Seyfert 2 galaxies are usually characterized by an emission line at 6.4 keV produced by the Kα emission of Iron species less ionized than Fe XVI, while in some Seyfert 2 object emission lines from He-like (6.7 keV) and H-like Iron (6.96 keV) have also been observed (see Turner et al., 1997a,b and reference therein). The last two are emitted from highly ionized gas and are supposed to derive from the warm scattering medium located outside the absorbing material, i.e. the same medium which is supposed to scatter the primary AGN spectrum into our line of sight. As shown in Matt et al., 1996 the EW of the He-like and H-like Iron lines, if computed with respect to the scattered component (EWscatt. hereafter), can be as high as a few keV; these lines should emerge in Compton thick system ( cm-2) while they should be strongly diluted if the primary radiation is directly visible (as in the case discussed here above 4 keV). If we take an implausible upper limit of EWscatt. = 10 keV for the He-like or the H-like Iron line, we should observe, in the case of AXJ2254+1146, a line with EWobs 0.07 keV; this is about a factor 9 less than that observed. We can then rule out an origin of the observed line from He-like and H-like iron species, leaving the fluorescent line at 6.4 keV produced by low ionization Iron the more plausible possibility. The measured position of the line ( keV) is consistent, within its 95% confidence range of ( keV), with the low ionization Iron line emitted at the redshift of the object (z = 0.029, see section 5).
The EWobs. is significantly larger than that observed in Seyfert 1 galaxies (EW = eV, Nandra et al., 1997) and is similar to that measured in others Seyfert 2 galaxies (Bassani et al., 1999). The measured EW ( keV) is about a factor 4.5 greater than that expected from transmission through a spherical uniform shell of neutral material (solar abundances) having the measured intrinsic cm-2 (Leahy and Creighton, 1993) and about a factor 7.5 greater than that expected to be produced from transmission through an absorbing torus with a geometrical configuration like that assumed by Ghisellini, Hardt and Matt, 1994 and having cm-2. This could suggest a combined origin either from the accretion disk and from the absorbing torus. The scattering fraction () is consistent with that observed in other well studied Seyfert 2 galaxies (see Turner et al., 1997a,b and reference therein).
The Iron line equivalent width along with the scattering fraction and the measured absorbing column density clearly allow us to classify AXJ2254+1146 as a Type 2 object directly from X-ray spectroscopy.
We note that two data points at about 3 and 3.5 keV (see figure 3) seem to be in excess with respect to the best fit model; these line energies are in very good agreement with the neutral emission lines of Ar (2.96 keV) and Ca (3.7 keV) respectively. Both lines are expected to be present in a Compton reflected spectrum (see e.g the theoretical reflected X-ray spectrum presented in Reynolds et al., 1994).
The observed (de-absorbed from the Galactic value) flux implied from the best fit model (see Table 2) in the 0.52.0 keV, 0.54.5 keV and 210 keV energy band are erg cm-2 s-1, erg cm-2 s-1 and erg cm-2 s-1, respectively. The intrinsic luminosity (i.e. the luminosity emitted from the nucleus) in the 0.52.0 keV and in the 210 keV energy band are erg s-1 and erg s-1, respectively.
3 Source Identification
Figure 4 shows the Palomar Observatory Sky Survey II (POSS II) image centered on the X-ray position of AXJ2254+1146 with its 90% error circle of 2.0 arcmin radius (see footnote 4). We have also marked with a cross the X-ray position of AXJ2254+1146 if we apply the offset we are measuring for the target of the ASCA observation (see table 1).
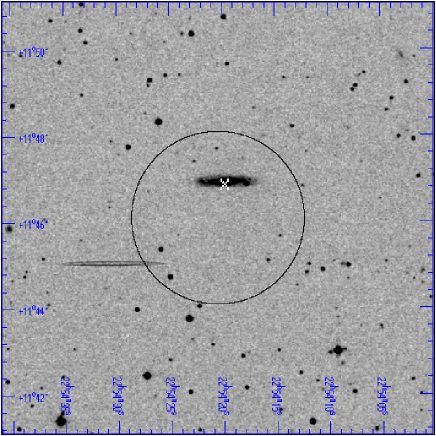
The fairly bright () spiral (Sbc) galaxy present in the error circle is UGC 12237. Using the surface density of similarly bright galaxies of deg-2 (Maddox et al., 1990) we estimated that the probability for a galaxy brighter than m = 15 to fall by chance in an X-ray error circle of 2 arcmin radius is . This, combined with the other data discussed in this paper (i.e. SED and the optical spectral properties), clearly shows that UGC 12237 is the most probable optical counterpart of AXJ2254+1146.
4 Spectral Energy Distribution
UGC 12237 has been detected in the NVSS (Condon et al., 1998) as a 1.4 GHz compact radio source and also in the IRAS survey at 25, 60 and 100 (but not at 12 ). There are no pointed ROSAT observations containing UGC 12237 nor is the galaxy detected in the ROSAT All Sky Survey. The only available X-ray measurement is an upper limit of erg cm-2 s-1 in the 0.5-4.5 keV energy band from the Einstein satellite (Burstein et al., 1997). This value is consistent with the 0.5 - 4.5 keV flux measured here. Photometric data on this galaxy are reported in Table 3.
| Band | Frequency | Observed Flux Density | |||
|---|---|---|---|---|---|
| Hz | erg cm-2 s-1 | erg s-1 | |||
| Radio (NVSS) | 1.4 GHz | 4.5 mJy | |||
| Infrared (IRAS) | 100 m | Jy | |||
| Infrared (IRAS) | 60 m | Jy | |||
| Infrared (IRAS) | 25 m | Jy | |||
| Infrared (IRAS) | 12 m | Jy | |||
| Optical | Bo | 14.26 mag | |||
| X-ray (ASCA) | 1 keV | erg cm-2 s-1 keV-1 | |||
| X-ray (ASCA) | 5 keV | erg cm-2 s-1 keV-1 | |||
| X-ray (ASCA) | 10 keV | erg cm-2 s-1 keV-1 |
In Figure 4 we show the Spectral Energy Distribution (SED) of UGC12237: the filled dots represent the photometric data from radio to optical wavelengths while the tick solid line represents the keV best fit spectral model reported in Table 2. Also shown in Figure 5 is the mean SED of a sample of Seyfert 2 and a sample of non-AGN Spiral galaxies as determined by Schmitt et al., 1997. The SEDs have been normalized at 2 keV.
It is clear from Figure 4 that the mean SED of non-AGN Spiral galaxies is at variance with the SED of AXJ2254+1146, while the SED of Seyfert 2 galaxies seem to be more consistent with the data. The largest discrepancy between the Seyfert 2 SED and the SED of AXJ2254+1146 is in the optical domain, where only the total magnitude (nucleus + host galaxy) is available; this discrepancy is expected since the SEDs reported in Schmitt et al., 1997 were based on the optical nuclear flux. In the far infrared regime Schmitt et al., 1997 use the IRAS fluxes as we have done for AXJ2254+1146.

5 Optical Spectroscopy
While the paper was in the refereeing process an optical spectrum was obtained with VLT/FORS in long slit mode as a backup program during a period of poor seeing. The exposure time was 5 minutes long and the slit ( wide) was set perpendicular to the galaxy major axis. The Grism 150I was used providing a resolution with little sensitivity below . The extracted spectrum (Fig.6) shows Hβ, [OIII], [OI], Hα, [NII] and [SII] narrow emission lines as well as absorption lines originating in the host galaxy, at redshift . The weak Hβ line is likely partially obscured by blending with the stellar Hβ absorption line. We estimate a flux ratio. At the above stated spectral resolution, we also estimate a FWHM for all the observed emission lines less than km/s. Together with the presence of a weak [OI] line, these line features and ratios lend support to the identification of AXJ2254+1146 as a Seyfert 2, as opposed to a LINER or starburst galaxy.

6 Summary and Conclusion
In this paper we have reported the X-ray discovery of a Type 2 AGN - AXJ2254+1146 - which is part of the ASCA Hard Serendipitous Survey (Della Ceca et al., 1999a, 2000); this object must be added to the scanty number of hard X-ray selected type 2 AGN reported in literature (see e.g. Akiyama et al., 1998b and reference therein).
The X-ray spectrum is best described by a model consisting of an unresolved Gaussian line at keV plus the so called “leaky-absorber” continua. The best fit values of the absorbing column density ( = cm-2), of the line equivalent width ( keV) and of the scattering fraction () clearly reveal its Type 2 nature.
A fairly bright () spiral galaxy (UGC 12237) is present inside the ASCA error circle: this is the most probable optical counterpart of AXJ2254+1146. Subsequent optical spectroscopy has confirmed that UGC 12237 is a Seyfert 2 at z=0.029.
Which are the most important implications of this finding? As with many discovery of this kind we are probably seeing the “tip of the iceberg”. As soon as the new generation of X-ray telescopes (e.g. Chandra, XMM) is fully operative, we predict that it will become common to investigate and classify X-ray selected objects by using X-ray data alone (see also Rosati et al., 1995 for a classification based on the source extent). AXJ2254+1146 could be indeed one of the brightest examples of a population of very hard X-ray sources that is showing up at faint fluxes (cf. Della Ceca et al., 1999a,b). The current optical identification status of the ASCA HSS prevents us from speculating any further and discussing constraints on the synthesis models for the CXB. We only note here that in the ASCA HSS sample there are about 8 more sources with broad band spectral properties (as derived from the hardness ratios) similar to those of AXJ2254+1146. One of these 8 sources is NGC 6552, a well known and studied Seyfert 2 galaxy (Reynolds et al., 1994). Finally, we recall that Fabian and Iwasawa (1999) have recently pointed out that if absorbed AGNs are the major contributors to the CXB above 2 keV then about 85% of the accretion power in the Universe is absorbed. In AXJ2254+1146 about 99% (65%) of the intrinsic flux in the 0.5-2.0 (2 -10) keV energy range is absorbed !
Acknowledgements.
We are grateful to the referee, M. Cappi, and to A. Wolter for the careful reading of the manuscript and for useful comments. V.B. acknowledges financial support from the Osservatorio Astronomico di Brera. This work received partial financial support from the Italian Ministry for University and Research (MURST) under grant Cofin98-02-32. This research has made use of the NASA/IPAC extragalactic database (NED), which is operated by the Jet Propulsion Laboratory, Caltech, under contract with the National Aeronautics and Space Administration. We thank all the members of the ASCA team who operate the satellite and maintain the software data analysis and the archive.References
- (1) Akiyama, M., et al., 1998a, astro-ph/9811012
- (2) Akiyama, M., Ohta, K., Yamada, T., et al., 1998b, Ap.J., 500, 173.
- (3) Bassani, L., Dadina, M., Maiolino, R., Salvati, M., Risaliti, G., Della Ceca, R., Matt, G., & Zamorani, G., 1999, Ap.J.Supp., 121, 473.
- (4) Burstein, D., Jones, C., Forman, W., Marston, A.P., & Marzke, O. R., 1997, Ap.J.Supp., 111, 163.
- (5) Cagnoni, I., Della Ceca, R., & Maccacaro, T., 1998, Ap.J., 493, 54 (Paper I).
- (6) Condon, J.J., Cotton, W.D., Greisen, E.W., Yin, Q.F., Perley, R.A., Taylor, G.B., & Broderick, J.J., 1998, A.J., 115, 1693.
- (7) Comastri, A., Setti, G., Zamorani, G. & Hasinger, G., 1995, A&A, 296, 1.
- (8) Della Ceca, R., Braito, V., Cagnoni, I., & Maccacaro, 1999a, proceeding of the Conference “X-Ray Astronomy 99”, held in Bologna, September 6-10 1999, to be published in Astrophysical Letters and Communications, astro-ph/9912016.
- (9) Della Ceca, R., Castelli, G., Braito, V. Cagnoni, I., & Maccacaro, T., 1999b, Ap.J., 524, 674 (Paper II).
- (10) Della Ceca, R., et al., 2000, in preparation.
- (11) Dickey, J.M., and Lockman, F.J., 1990, ARAA, 28, 215.
- (12) Fabian, A.C., & Iwasawa, K., 1999, MNRAS, 303, L34.
- (13) Fiore, F., La Franca, F., Giommi, P., Elvis, M., Matt, G., Comastri, A., Molendi, S., & Gioia, I., 1999, MNRAS, 306, L55.
- (14) Ghisellini, G., Haardt, F., & Matt, G., 1994, MNRAS, 267, 743.
- (15) Ghotthelf, E., 1996, ASCANews n.4, Goddard Space Flight Center, 31.
- (16) Halpern, J.P., Turner, T.J., and George, I.M., 1999, MNRAS, 307, L47.
- (17) Leahy, D.A., & Creighton, J., 1993, MNRAS, 263, 314.
- (18) Maccacaro, T., Wolter, A., McLean, B., Gioia, I.M., Stocke, J.T., Della Ceca, R., Burg, R., & Faccini, R., 1994, Astr. Lett and Communications, 29, 267.
- (19) Madau, P., Ghisellini, G. & Fabian, A.C., 1994, MNRAS, 270, L17.
- (20) Maddox, S.J., Sutherland, W.J., Efstathiou, G., Loveday, J., & Peterson, B.A., 1990, MNRAS Short Communication, 247, 1p.
- (21) Matt, G., Brandt, W.N., & Fabian, A.C., 1996, MNRAS, 280, 823.
- (22) Moran, E. C., Lehnert, M.D., and Helfand, D.J., 1999, Ap.J., 526, 649.
- (23) Nandra, K., George, I.M., Mushotzky, R.F., Turner, T.J., & Yaqoob, T., 1997, Ap.J., 477, 602.
- (24) Reynolds, C.S., Fabian, A.C., Makishima, K., Fukazawa, Y., & Tamura, T., 1994, MNRAS, 268, L55.
- (25) Risaliti, G., Maiolino, R., & Salvati, M., 1999, Ap.J., 522, 157.
- (26) Rosati, P., Della Ceca, R., Burg, R., Norman, C. & Giacconi, R., 1995, Ap.J., 445, L11.
- (27) Schmitt, H.R., Kinney, A.L., Calzetti, D. & Bergmann, T.S., 1997, A.J., 114, 592.
- (28) Setti, G. & Woltjer, L., 1989, A&A, 224, L21.
- (29) Stocke, J. T. et al., 1991, ApJS, 76, 813.
- (30) Tanaka, Y., Inoue, H. & Holt, S. S., 1994, PASJ, 46, L37.
- (31) Turner, T.J., George, I.M., Nandra, K., & Mushotzky, R.F., 1997a, Ap.J.Supp., 113, 23.
- (32) Turner, T.J., George, I.M., Nandra, K., & Mushotzky, R.F., 1997b, Ap.J., 488, 164.