The Central X-Ray Point Source in Cassiopeia A
Abstract
The spectacular “first light” observation by the Chandra X-Ray Observatory revealed an X-ray point source near the center of the 300 yr old Cas A supernova remnant. We present an analysis of the public X-ray spectral and timing data. No coherent pulsations were detected in the Chandra/HRC data. The 3 upper limit on the pulsed fraction is 35% for ms. The Chandra/ACIS spectrum of the point source may be fit with an ideal blackbody (=0.5 keV), or with blackbody models modified by the presence of a neutron star atmosphere (=0.25–0.35 keV), but the temperature is higher and the inferred emitting area lower than expected for a 300 yr old neutron star according to standard cooling models. The spectrum may also be fit with a power law model (photon index –3.6). Both the spectral properties and the timing limits of the point source are inconsistent with a young Crab-like pulsar, but are quite similar to the properties of the anomalous X-ray pulsars. The spectral parameters are also very similar to those of the other radio-quiet X-ray point sources in the supernova remnants Pup A, RCW 103, and PKS 1209–52. Current limits on an optical counterpart for the Cas A point source rule out models that invoke fallback accretion onto a compact object if fallback disk properties are similar to those in quiescent low-mass X-ray binaries. However, the optical limits are marginally consistent with plausible alternative assumptions for a fallback disk. In this case, accreting neutron star models can explain the X-ray data, but an accreting black hole model is not promising.
1 INTRODUCTION
For over three decades, it has been well established that (some) supernova explosions give rise to strongly magnetized ( G), rapidly rotating (–30 ms) neutron stars (NSs), as in the young radio pulsars found in the Crab Nebula and nearly a dozen other supernova remnants (SNRs). In some cases, a synchrotron nebula (or “plerion”) has been detected around the pulsar, powered by non-thermal emission from the NS. Emission (in some cases pulsed) has been detected at other wavelengths (optical, X-ray, gamma-ray) arising from thermal and non-thermal processes. However, several clues have recently emerged suggesting that this paradigm is incomplete (see Kaspi 2000 and Gotthelf & Vasisht 2000 for recent reviews). First, there are the six slowly-rotating ( s) “anomalous X-ray pulsars” (AXPs), which seem to be young isolated NSs and may have extremely strong (– G) surface magnetic fields (Mereghetti 2000). Half of the AXPs are associated with SNRs. Possibly related are the four known soft gamma-ray repeaters (SGRs), which in quiescence share many properties with AXPs and may also be associated with SNRs (Hurley 2000).
Also intriguing has been the identification of at least three radio-quiet non-plerionic X-ray point sources near the centers of SNRs (Pup A, RCW 103, and PKS 1209–52; see Brazier & Johnston 1999 and references therein). These objects have X-ray spectra roughly consistent with young, cooling NSs, but show no evidence for either X-ray pulsations or emission at other wavelengths (in contrast to “normal” young NSs). Finally, the ongoing failure to detect clear evidence for a young NS in the remnant of SN 1987A in the Large Magellanic Cloud (LMC) has renewed theoretical interest in alternative models for the aftermath of a SN explosion, especially with respect to fallback of ejected material onto a newborn NS. Several groups have concluded that, under some circumstances, a newborn NS might collapse into a black hole (BH) shortly after birth (Brown & Bethe 1994; Woosley & Timmes 1996; Zampieri et al. 1998; Fryer, Colgate, & Pinto 1999).
Nearby SNRs without known stellar remnants are thus obvious targets for further study. After SN 1987A, the youngest known SNR in our Galaxy or the satellite Magellanic Clouds is Cassiopeia A. Its parent supernova was evidently noticed (though misunderstood) by Flamsteed in 1680 (Ashworth 1980). This yr historical age for Cas A is consistent with its optical expansion time scale (van den Bergh & Kamper 1983), though somewhat shorter than its X-ray ( yr; Koralesky et al. 1998, Vink et al. 1998) and radio (750–870 yr; Anderson & Rudnick 1995) expansion time scales. The progenitor of this oxygen-rich SNR was probably a very massive (zero-age main sequence mass ) late WN-type Wolf-Rayet star which underwent prodigious mass loss via a stellar wind and eventually exploded as a type II supernova (Fesen, Becker, & Blair 1987). The inferred distance to Cas A is kpc (Reed et al. 1995). The remnant subtends 4 arcmin in the sky, is one of the brightest non-thermal radio sources, and has been extensively studied in the radio, optical, and X-ray bands.
The Chandra X-Ray Observatory “first light” observation on 1999 August 20 revealed the presence of a compact X-ray source near the geometric center of Cas A (Tananbaum 1999). The source morphology is point-like, with no obvious evidence for extension or a surrounding nebula (e.g., a plerion). The discovery announcement notes that no obvious counterparts were detected within a 5 arcsec radius of the point source position on 20 cm radio maps or optical images. Previous X-ray missions lacked sufficient spatial resolution to separate the point source from the diffuse SNR emisison. However, armed with the Chandra position, Aschenbach (1999) detected the point source in archival 0.1–2.4 keV X-ray images taken with the ROSAT/HRI in 1995-1996, and Pavlov & Zavlin (1999) recovered the point source in archival 0.5–4 keV X-ray images taken with the Einstein/HRI in 1979 and 1981. The Einstein, ROSAT, and Chandra count rates were consistent with a constant X-ray source flux over all the observations (Pavlov & Zavlin 1999; Pavlov et al. 2000). They also noted that the observed spectrum appeared to be inconsistent with pure blackbody radiation from the entire surface of a cooling NS. Umeda et al. (2000) speculated on some possible scenarios for the nature of the point source, based on these early results.
In this paper, we present a detailed analysis of the X-ray spectral and timing features of the central point source in Cas A, based on the available public Chandra data. In §2, we give a detailed description of the observation and our data analysis, including our efforts to verify the instrumental calibration. In §3, we discuss our results in the context of various models for the nature of the point source. We summarize our finding in §4. While completing our manuscript, we learned of another paper presenting an independent analysis of the spectral data by Pavlov et al. (2000). They used a subset of the data that we discuss in our paper, and their spectral results are consistent with ours within the uncertainties. We include a brief discussion of their preferred interpretation in §3.
2 OBSERVATIONS AND ANALYSIS
Chandra (formerly AXAF; Weisskopf et al. 2000) was launched on 1999 July 23. Its High Resolution Mirror Assembly (HRMA), which consists of four pairs of nested grazing-incidence Wolter type I mirrors with a 10 m focal length, focuses X-rays in the 0.1–10 keV range. The on-axis point-spread function of the HRMA has a 50% energy width of 0.25 arcsec at 0.3 keV and 0.6 arcsec at 9.7 keV. Numerous imaging observations of Cas A have been made by Chandra as part of the mission’s Orbital Activation and Checkout (OAC) calibration program. All OAC data are immediately in the public domain. Most of the Cas A observations were made using the Advanced CCD Imaging Spectrometer (ACIS; Burke et al. 1997), which records both the sky position (0.49 arcsec/pixel) and the energy ( 50–200 eV) of each detected photon in the 0.1–10 keV range, with a time resolution of 3.2 s. A few of the observations were made with the High Resolution Camera (HRC; Zombeck et al. 1995; Murray et al. 1997), which precisely records the sky position (0.13 arcsec/pix) and arrival time111A recently identified wiring problem in the HRC onboard electronics has caused the event timing accuracy to be degraded to 4 ms for the data presented in this paper (S. S. Murray 2000, private communication; Seward 2000). See §2.3 for further discussion. (=16 s) of each detected photon, but with modest () energy resolution. No diffraction gratings were in place for any of the ACIS or HRC observations. A summary of the observations used in our analysis is given in Table 1.
| aaCounts in extracted aperture (including background). | RatebbPoint source count rate (background subtracted). | |||||||
|---|---|---|---|---|---|---|---|---|
| ObsID | Start time (UT) | Instrument | (arcmin) | (arcsec) | (s) | (s) | (ct) | (ct ks-1) |
| 214 | 1999 Aug 20, 00:07 | ACIS/S3 | 2.3 | 3.3 | 6107 | 2803 | 420 | |
| 220 | 1999 Aug 22, 23:27 | ACIS/S3 | 2.8 | 2.0 | 4279 | 1212 | 150 | |
| 221 | 1999 Aug 23, 00:52 | ACIS/S3 | 3.9 | 4.5 | 2103 | 1060 | 199 | |
| 222 | 1999 Aug 23, 01:38 | ACIS/S3 | 2.8 | 3.8 | 2080 | 1044 | 179 | |
| 172 | 1999 Sep 05, 18:45 | HRC-S | 1.3 | 3.0 | 9485 | 9485 | 411 | |
| 1409 | 1999 Oct 23, 18:31 | HRC-I | 1.4 | 3.0 | 12770 | 12770 | 479 |
2.1 ACIS Data Reduction
As the analysis tools and calibration for Chandra are still under development at this early stage of the mission, we will describe our data reduction, analysis, and verification steps in detail. In using the ACIS data to derive a spectrum for the point source in Cas A, we have restricted our analysis to the four exposures obtained during 1999 August 20–23 with Cas A placed on the back-illuminated (BI) ACIS S3 chip, for three reasons. First, preliminary analysis showed that the point source spectrum was relatively soft, and the two BI chips (S1 and S3) have superior low energy response compared to the front-illuminated (FI) chips. Second, we wished to optimize the Chandra point spread function by minimizing the off-axis angle of the point source, and the Chandra aim points for ACIS lie on either the S3 or I3 chips. Inspection of the Cas A images obtained on the other ACIS chips shows that the point source is spread out over many more pixels, making it more difficult to separate from the background; the effective area of the mirror and detector combination at these angles is also reduced. Finally, the BI chips have not suffered the radiation damage that degraded the energy resolution of the FI chips soon after launch, and so are better calibrated at this early stage in the mission. A summary of the observations we used is given in Table 1.
We obtained the fully processed (level 2) ACIS event data for these observations from the Chandra Data Archive. The data were acquired in Timed-Exposure/Faint mode, with a frame read out every 3.2 s. A substantial number of frames was lost to telemetry saturation due to the high total count rate from Cas A, resulting in an overall observation duty cycle of 42%. We filtered the events from the surviving frames, accepting only those which fell within the “standard” event grade set (grades 0+2+3+4+6) in order to maximize the ratio of X-ray to non–X-ray events, and additionally discarding events with very large pulse heights as due to cosmic rays. For all the observations, the ACIS focal plane temperature was C.
We did not attempt to improve upon the spacecraft aspect solutions from the standard processing, but instead proceeded from the assumption that the central source in Cas A is indeed point-like in morphology, as determined by Tananbaum (1999). For each observation, we extracted all events located within a given radius of the centroid position of the point source. Ideally, we would use the calibrated angular response of the HRMA to choose an extraction radius which encircled some fixed fraction (e.g., 95%) of the flux from a point source for a given off-axis angle. However, both the focus position of the detector and the quality of the spacecraft aspect solution were not necessarily optimal in these early observations. Instead, we measured the radial distribution of source photons for each observation from the data and estimated a 95% extraction radius. Table 1 lists the aperture sizes.
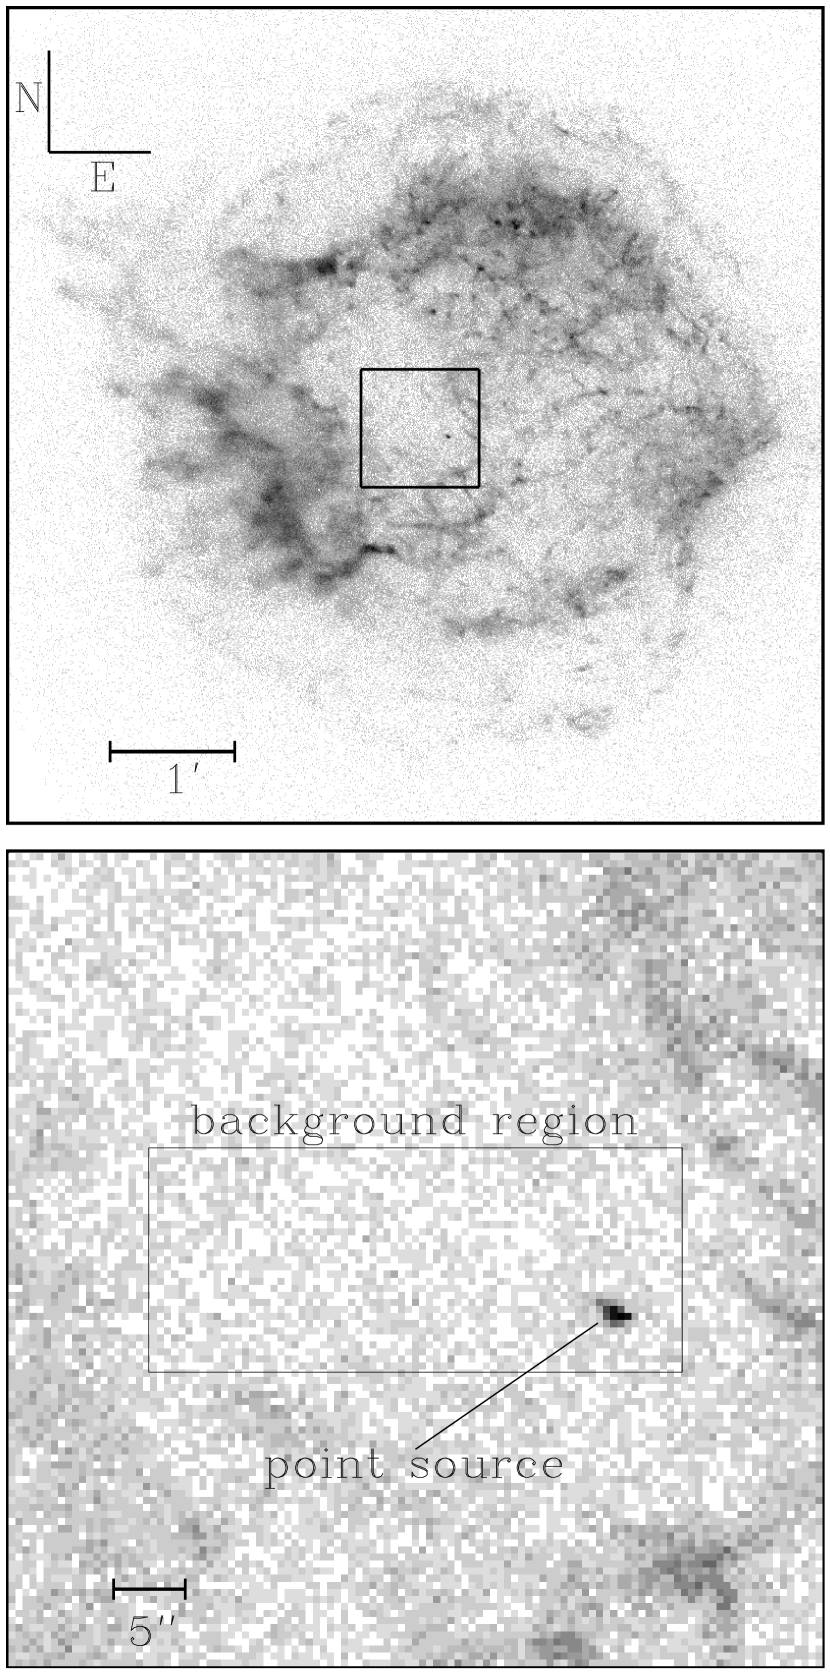
The background in the point source region is dominated by the diffuse emission of the supernova remnant and has strong contributions from both continuum and line emission (e.g., Holt et al. 1994). The point source is located within a relatively low surface brightness region of the remnant. Still, the background must be estimated with care, as there are significant compositional gradients in this part of the remnant (and perhaps variations in the underlying plasma conditions), resulting in varying line strengths with position (see also Hughes et al. 2000). After investigating the line strengths in a number of nearby regions, we selected an off-centered arcsec2 rectangular region around the point source (with the point source itself and a small surrounding buffer region excluded) to estimate the background surface brightness near the point source. The point source and the background region are shown in Figure 1.
The ACIS instrumental response may be parameterized by a photon energy redistribution matrix (hereafter RMF), which maps incident photon energy to detected pulse height amplitudes (PHAs). Every ACIS chip () is divided into four parallel () quadrants, each read out separately by four individual amplifiers. Each quadrant requires a unique RMF, as each readout amplifier has a different gain. Additionally, the parallel and serial charge transfer inefficiency in the BI chips leads to differences in energy resolution and detection efficiency versus position within a quadrant as well. Consequently, the ACIS instrument team has supplied multiple position-dependent RMFs for each quadrant. We used the 1999 October 28 version of RMFs developed for observations taken at a focal plane temperature of C.
Fortuitously, the Cas A point source (and nearly all of the selected background region) lies entirely in quadrant 2 for all four of the S3 observations. Furthermore, the four observations were located within 250 pixels of each other within the chip quadrant, minimizing the differences in CCD response. Thus, the four RMFs appropriate for each observation may be combined without any serious loss of accuracy. This allows us to sum the four individual S3 count spectra into a single “grand total” S3 count spectrum with improved statistics. In addition to the RMFs, an ancillary response function (hereafter ARF) is needed to characterize the effective area of the HRMA and the quantum efficiency of the ACIS detector as a function of incident photon energy and off-axis angle. We computed the appropriate ARF for each observation using software created by members of the ACIS and High Energy Transmission Grating instrument teams at MIT. The overall instrumental response is given by the product of the RMF and the ARF. We computed this product for each observation, and then combined these products by an exposure-weighted average for use with our summed count spectrum.
2.2 X-Ray Spectral Fitting
The summed, background-subtracted ACIS count spectrum was analyzed using the XSPEC v10.00 software package (Arnaud 1996). We rebinned the data at 0.15 keV resolution (32 ADU/channel) and restricted our analysis to 21 bins in the 0.7–4.0 keV range, resulting in at least 10 count bin-1 in all but 3 bins at high energy (with a minimum of 5 count bin-1 and a maximum of 71 count bin-1), and a total of 630 counts. The rebinned count spectrum is shown in Figure 2.

In light of the relatively low count rate, our model fitting weighted each bin by rather than (where is the number of counts in bin ). This is a superior weighting scheme when is small and asymptotes to the usual weighting when is large (Gehrels 1986).
We fit several different spectral models to these data: a simple power law, thermal bremsstrahlung, an ideal blackbody (BB), and two modified BB models222For the BB and modified BB models, the quoted spectral parameters are those that would be measured by an observer at infinity, assuming the gravitational redshift correction factor for a 10 km NS.. The modified BB models assume that the emitting object is a NS and account for the effect of a light-element stellar atmosphere on the emergent spectrum. The strong NS surface gravity essentially guarantees that the photosphere will be dominated by the lightest element present (Alcock & Illarionov 1980; Romani 1987). For such atmospheres with K, the dependence of free-free absorption will shift the peak of the emission blueward from that of an ideal BB (Romani 1987; Zampieri et al. 1995). Previous authors have shown that neglecting this effect and fitting the Wien tails of such spectra with an ideal BB model significantly overestimates the effective temperature and underestimates the emitting area (Rajagopal & Romani 1996; Zavlin, Pavlov, & Shibanov 1996; Rutledge et al. 1999). To consider this possibility, we employed two models: the simple analytic spectrum emerging from the power-law atmosphere of Heyl & Hernquist (1998a; hereafter HH98a), with as appropriate for a light-element atmosphere; and the more detailed H atmosphere model of Zavlin, Pavlov, & Shibanov (1996; hereafter ZPS96), developed for a weakly magnetized NS.
For all these models, we included the effect of photoelectric absorption by neutral gas along the line of sight (Morrison & McCammon 1983), which is a significant effect at low ( keV) energies. With the relatively small number of low-energy X-ray photons detected from the Cas A point source, it is difficult to constrain precisely. Moreover, its value in this situation is highly spectral-model–dependent and strongly covariant with the overall flux normalization. However, may also be determined from radio measurements of the atomic and molecular hydrogen column densities using the 21 cm H I and 18 cm OH absorption lines, respectively. Keohane, Rudnick, & Anderson (1996) have used such data to derive a spatially-resolved column density map of the Cas A SNR at 30 arcsec resolution. Using this map, we estimate that the column density towards the Cas A point source is cm-2. However, this estimate must be used with caution, as the radio maps give no information on small–angular-scale variations in the column. For each spectral model we employed, we fit the data both with held fixed at this value and with as a free parameter.
Our spectral fitting results are summarized in Table 2, and a typical model fit is shown in Figure 2. All of the models gave formally acceptable fits333The fact that the reduced values are less than unity in some cases does not imply that the measurement uncertainties (given by Poisson statistics) are underestimated. The probability of obtaining a reduced as small as 0.7 with only 19 degrees of freedom (assuming the true model is being fit) is 18%, which is thus within the 1 range for an acceptable fit.; we are unable to reject any of them on the basis of these data. However, the BB and NS atmosphere models fit slightly better to the data than the other models, although with inferred radii considerably smaller than the 10 km typically assumed for a NS radius.
| Photon | ccFor BB and NS atmosphere models, as measured by an observer at infinity assuming a 10 km NS radius. | ddImplied blackbody radius assuming a source distance of 3.4 kpc, as measured by an observer at infinity. | |||||
|---|---|---|---|---|---|---|---|
| Model | ( cm2) | indexaaPhoton index, defined such that the unabsorbed photon number flux . | bbUnabsorbed flux density at 1 keV, in units of photon cm-2 s-1 keV-1. | (keV) | (km) | ee0.1–10 keV luminosity in units of erg s-1 assuming a source distance of 3.4 kpc or bolometric luminosity at infinity for blackbody models. | /dof |
| Power law | 1.12/18 | ||||||
| 1.1 (fixed) | 1.44/19 | ||||||
| Thermal brems. | 0.92/18 | ||||||
| 1.1 (fixed) | 1.00/19 | ||||||
| Ideal blackbody | 0.69/18 | ||||||
| 1.1 (fixed) | 0.77/19 | ||||||
| NS atm. (HH98affAnalytic NS power-law atmosphere of Heyl & Hernquist (1998a), with . ) | 0.70/18 | ||||||
| 1.1 (fixed) | 0.76/19 | ||||||
| NS atm. (ZPS96ggH atmosphere for a non-magnetic NS (Zavlin et al. 1996). ) | 0.74/18 | ||||||
| 1.1 (fixed) | 0.73/19 |
Interpretation of our results depends critically upon the reliability of the energy and effective area calibrations of Chandra, which are still being evaluated by the instrument teams. To verify the robustness of our conclusions, we made a rough check of these calibrations by fitting the X-ray spectral data from the 1999 Aug 23 ACIS/S3 observation of SNR E010272 (ObsId 1231), the brightest supernova remnant in the Small Magellanic Cloud (SMC; Hayashi et al. 1994). For comparison, we also analyzed archival spectral data for the same source as observed by ASCA on 1993 May 12–13. For both data sets, we restricted our analysis to 0.6–2.6 keV (an energy band that both contains the majority of the SNR flux and spans a range similar to that of the Cas A point source) and fit the same plasma model, with fixed column density and non-solar abundances. The derived plasma temperatures agree to better than 2%, and the overall normalizations to within 13%, using the preliminary calibrations.
2.3 X-Ray Timing
We examined two on-axis observations of Cas A made with the HRC as part of the OAC program, using the HRC-S and HRC-I detectors respectively. These observations are summarized in Table 1. We obtained the processed level 2 event data from the Chandra Data Archive. In both cases, the overall count rate ( count s-1) from Cas A was below the telemetry threshold ( 184 count s-1) where deadtime effects become significant. For each observation, we extracted all events within 3 arcsec of the point source centroid to conservatively ensure that all source photons were included. The photon arrival times, provided in terrestrial time (TT) at the spacecraft, were corrected to barycentric dynamical time (TDB) at the solar system barycenter using the JPL DE200 solar system ephemeris (Standish et al. 1992) and a geocentric spacecraft ephemeris.
We binned the events into 0.5 ms time bins and computed a Fourier power spectrum of the resulting time series. No significant pulsations were detected; the highest peak in the power spectrum had a significance of only 2 when the number of trials is accounted for. To improve our statistics, we also computed an incoherent power spectral sum of 9 ks segments of each observation. Again, no significant pulsations were found, with the highest peak having a significance of only 0.8 including the number of trials. A large pulse frequency derivative might spread a coherent pulsation over multiple power spectral bins, reducing our sensitivity. However, for the ks observations used here, a pulse frequency derivative of Hz s-1 would be required. This is 25 times larger than for the Crab pulsar, and larger than the typical value for an AXP or SGR. To enhance our sensitivity to non-sinusoidal pulse shapes, we also performed harmonic folds of the power spectrum (see, e.g., de Jager, Swanepoel, & Raubenheimer 1989). No significant pulsations were detected.
After our initial analysis was completed, we learned of a wiring problem in the HRC on-board electronics that causes HRC events to be time-tagged incorrectly (S. S. Murray 2000, private communication; Seward 2000). The net effect of the problem is that the timing accuracy of the HRC is degraded from 16 s to 4 ms. Consequently, we conservatively conclude that the HRC analysis presented here has no sensitivity to pulsations with frequency above 50 Hz. We used our incoherent power spectral sum to estimate an upper limit for the sinusoidal pulsed fraction of the Cas A point source, accounting for the suppression of power spectral sensitivity at higher frequencies due to binning of the data (e.g., van der Klis 1989). We find that the 3 upper limit on the sinusoidal pulsed fraction is 35% for Hz.
Our sensitivity to rapid pulsations depends upon an accurate correction for the motion of the spacecraft with respect to the barycenter. As a check of our barycenter corrections and of the spacecraft ephemeris, we analyzed a 1999 August 31 HRC-I observation (ObsID 132) of PSR B0540–69, a young 50 ms pulsar associated with the supernova remnant N158A in the Large Magellanic Cloud, using the same data analysis procedure as for Cas A. (Detailed independent analyses of this observation are presented by Gotthelf & Wang 2000 and Kaaret et al. 2000.) We compared this measurement with a 1999 September 1 observation of an overlapping field with the Rossi X-Ray Timing Explorer (these data were generously made available by F. E. Marshall of NASA Goddard Space Flight Center). The frequencies measured in the two data sets were consistent within the uncertainties, and also agreed with the value extrapolated from a timing model based on a 1996 BeppoSAX observation (Mineo et al. 1999).
3 DISCUSSION
We have shown that the X-ray point source in Cas A has a spectrum well-described by either an absorbed power law with photon index 2.8–3.6 and unabsorbed 0.1–10 keV luminosity (7–160) erg s-1, or an absorbed BB or modified BB with –0.5 keV and bolometric luminosity –5) erg s-1. Our Chandra spectral and timing measurements, combined with pre-existing limits at other wavelengths, severely constrain plausible models for the nature of the X-ray point source in Cas A.
We begin by pointing out, for completeness, that our steep power law spectral fit essentially rules out the possibility that the point source is a background galaxy, as active galactic nuclei (AGN) typically lie within a range of photon indices –2.2 (Turner & Pounds 1986). The AGN scenario is also extremely implausible given that the point source is located within a few arcsec of the expansion center of the SNR (Tananbaum 1999). Moreover, given the surface density of AGNs on the sky at this flux level (Boyle et al. 1993), the probability of a chance coincidence is negligible. There is thus extremely strong inferential evidence that the point source is indeed associated with the supernova remnant.
We now summarize the implications of our results for several other interpretations.
3.1 Classical young pulsar
If the Cas A point source is a classical young pulsar (the conventional product expected for a type II SN explosion), then the X-ray radiation should be predominantly non-thermal power-law emission from relativistic acceleration of pairs in the corotating NS magnetosphere (see Romani 1996). In Table 3, the properties of the point source are compared with the six young ( yr) classical pulsars whose X-ray spectra are well measured. All six of these pulsars have power law X-ray spectra with –1.7. The clearest distinction is that the spectral shape of the Cas A point source is considerably steeper than that of the young pulsars, although its X-ray luminosity is marginally consistent with the lower end of the young pulsar range. The upper limit on the point source’s X-ray pulse fraction (%) is lower than at least three of the measured pulsed fractions in the young pulsars. In the other three pulsars, the lower limit on the pulsed fraction is consistent with the point source’s upper limit, but it is likely that these pulsar lower limits are a drastic underestimate due to the presence of plerionic emission. Radio pulsations have not been detected from Cas A, with an upper limit of mJy kpc2 for the 600 MHz radio luminosity (Lorimer, Lyne & Camilo 1998), in contrast to five of the six young pulsars444One of these pulsars, PSR J1846–0258, was only recently discovered in the X-ray band (Gotthelf et al. 2000). A radio search has not been reported since the X-ray pulsations were detected.. This non-detection in Cas A could be explained by beaming, judging from the observed radio luminosities in young pulsars ( mJy kpc2 for the Crab and PSR B0540–69, but only mJy kpc2 for PSR B1509–58, PSR J1119–6127, and PSR J1617–5055; Taylor, Manchester, & Lyne 1993; Kaspi et al. 1998, 2000). The Chandra images also show no obvious evidence for a plerion surrounding the point source. Plerions, powered by synchrotron emission, have been detected around five of the six classical young pulsars in Table 3 (the exception is PSR J1617–5055; Kaspi et al. 1998), and even around some X-ray point sources in SNRs which are not known pulsars. Based principally on the X-ray spectral shape, with some support from the other properties, we conclude that the point source in Cas A is not a classical young pulsar.
| Power law spectrum | Blackbody spectrum | |||||||||||
|---|---|---|---|---|---|---|---|---|---|---|---|---|
| / | Photon | Pulse | ||||||||||
| Source | SNR | (s) | (yr) | (kpc) | index | (erg/s) | (keV) | (km) | (erg/s) | frac.(%) | Ref | |
| Cassiopeia A | ||||||||||||
| Point sourceaaFor the Cas A point source and AX J18450258, the powerlaw (PL) and (blackbody) BB models are alternative fits to the same data. For all the other sources, the PL and BB models are each components of a combined model. | Cas A | 0.0 | /2.5 | 3.4 | 2.2–3.6 | 33.8–34.6 | 0.5 | 0.5 | 33.3 | |||
| Other non-plerionic X-ray point sources in SNRsbbHere, we only include those sources that are well-established and have constrained spectral properties. | ||||||||||||
| 1E 08204247 | Pup A | 0.1 | 0.075? | 3.9/3.6 | 2.0 | 0.28 | 2 | 33.6 | 20? | 1–3 | ||
| 1E 16145055 | RCW 103 | 0.0 | /3.1 | 3.1 | 0.56 | 0.81 | 33.9 | 4,5 | ||||
| 1E 12075209 | PKS 120952 | 0.2 | 0.424 | /3.8 | 1.5 | 0.25 | 1.1 | 33.1 | 6–8 | |||
| Young classical pulsars | ||||||||||||
| PSR J18460258 | Kes 75 | 0.325 | 2.9/3.0 | 19 | 1.1 | 9 | ||||||
| PSR B053521 | Crab | 0.0 | 0.033 | 3.1/3.0 | 2.0 | 1.74 | 36.2 | 10 | ||||
| PSR B150958 | MSH 1552 | 0.2 | 0.150 | 3.2/3.2 | 5.2 | 1.36 | 35.3 | 65 | 11,12 | |||
| PSR B054069 | N158A | 0.2 | 0.050 | 3.2/3.1 | 47 | 1.3 | 36.6 | 13,14 | ||||
| PSR J05376910 | N157B | 0.5 | 0.016 | 3.7/3.7 | 47 | 1.6 | 35.5 | 15–17 | ||||
| PSR J1617–5055 | 0.069 | 3.9/ | 6.5 | 1.6 | 50 | 18,19 | ||||||
| Anomalous X-ray pulsars | ||||||||||||
| 1E 1841045 | Kes 73 | 0.2 | 11.8 | 3.6/3.3 | 7.0 | 3.4 | 36.9 | 15ccWe note that this value is half that reported in the literature, due to a different definition of pulsed fraction by these authors. | 20,21 | |||
| 1E 1048.15937 | 6.45 | 3.7?/ | 3.0 | 2.5 | 34.4 | 0.64 | 0.6 | 33.9 | 70 | 22,23 | ||
| AX J18450258aaFor the Cas A point source and AX J18450258, the powerlaw (PL) and (blackbody) BB models are alternative fits to the same data. For all the other sources, the PL and BB models are each components of a combined model. | G29.6+0.1 | 0.2 | 6.97 | ?/3.9 | 8.5 | 4.6 | 38.6 | 0.72 | 1.6 | 34.9 | 50 | 24,25 |
| RXS J170840 | 11.0 | 4.0/ | 10.0 | 2.9 | 36.9 | 0.41 | 8.9 | 35.5 | 50 | 26–28 | ||
| 4U 014261 | 8.69 | 4.8?/ | 1 | 3.7 | 35.9 | 0.39 | 2.4 | 33.5 | 10 | 29,30 | ||
| 1E 2259586 | CTB 109 | 0.3 | 6.98 | 5.3/4.0 | 4.0 | 4.0 | 36.9 | 0.43 | 2.2 | 34.3 | 30 | 28,31 |
| Soft gamma repeatersddThe spectral properties and pulse fractions listed for the SGRs are for quiescent emission. | ||||||||||||
| SGR 190014 | G42.8+0.6? | 1.2 | 5.16 | 2.8?/4.0 | 5.0 | 1.1 | 34.5 | 0.51 | 1.4 | 34.2 | 11 | 32,33 |
| SGR 180620 | eeThe extended radio nebula G10.00.3, once identified as a SNR, is now thought to be powered by a massive companion or the SGR itself (Gaensler 2000; Eikenberry & Matthews 2000; Frail, Vasisht & Kulkarni 1997). | 0.0 | 7.47 | 3.1?/ | 14.5 | 2.2 | 36.0 | 23 | 34–36 | |||
| SGR 052666 | N49 | 0.6 | 8 | ?/3.7 | 47 | 66 | 37,38 | |||||
| SGR 162741 | G337.00.1? | 2 | 6.41? | ?/3.7 | 11.0 | 2.5 | 35.8 | 10 | 39–41 | |||
References. — (1) Petre et al. 1982; (2) Petre, Becker & Winkler 1996; (3) Pavlov, Zavlin & Trümper 1999; (4) Helfand & Becker 1984; (5) Mereghetti, Bignami & Caraveo 1996; (6) Tuohy & Garmire 1980; (7) Gotthelf, Petre & Hwang 1997; (8) Zavlin et al. 2000; (9) Gotthelf et al. 2000; (10) Harnden & Seward 1984; (11) Marsden et al. 1997; (12) Gaensler et al. 1999a; (13) Finley et al. 1993; (14) Seward & Harnden 1994; (15) Wang & Gotthelf 1998a; (16) Wang & Gotthelf 1998b; (17) Marshall et al. 1998; (18) Torii et al. 1998b; (19) Kaspi et al. 1998; (20) Gotthelf & Vasisht 1997; (21) Gotthelf, Vasisht & Dotani 1999b; (22) Corbet & Mihara 1997; (23) Oosterbroek et al. 1998; (24) Torii et al. 1998a; (25) Gaensler et al. 1999b; (26) Sugizaki et al. 1997; (27) Israel et al. 1999a; (28) Kaspi, Chakrabarty & Steinberger 1999; (29) White et al. 1996; (30) Israel et al. 1999b; (31) Rho & Petre 1997; (32) Vasisht et al. 1994; (33) Woods et al. 1999a (34) Sonobe et al. 1994; (35) Corbel et al. 1997; (36) Kouveliotou et al. 1998 ; (37) Vancura et al. 1992; (38) Marsden et al. 1996; (39) Woods et al. 1999b; (40) Corbel et al. 1999; (41) Hurley et al. 2000.
Note. — is defined as the ratio between the source distance from the center of the SNR to the radius of the SNR; the characteristic age is defined as ; luminosities are either bolometric (BB) or for the keV band (PL).
If the Cas A point source is a NS, the absence of both detectable radio pulsations and a synchrotron nebula may indicate that it lies beyond the so-called pulsar “death line”, an empirical boundary on the spin-period–magnetic-field plane beyond which radio pulsars have generally not been detected, presumably because the NS does not generate enough pairs to power significant non-thermal emission555The recent identification of a radio pulsar well beyond the death line, PSR J2144–3933 ( s, G) indicates that this argument must be used cautiously (Young, Manchester, & Johnston 1999). (Chen & Ruderman 1993). In this case, we would expect a strongly magnetized ( G) NS to have a spin period of order at least a few seconds. Conversely, a rapidly spinning NS ( ms) would have a very weak magnetic field ( G), perhaps consistent with delayed field growth (Blandford, Applegate & Hernquist 1983).
3.2 Cooling neutron star
An alternative interpretation is that the X-rays from the Cas A point source arise from thermal emission from a cooling NS. A 300 yr old NS cools primarily via neutrino emission; standard cooling models predict thermal photon emission from the surface with –0.25 keV (Page & Sarmiento 1996; Page 1998). All of our BB and modified BB fits for the Cas A point source yield somewhat higher temperatures (–0.5 keV), as well as much smaller BB radii (–2.6 km) than expected for a 10 km NS, even when accounting for a light-element atmosphere. The NS atmosphere models (HH98a, ZPS96) that we fit to the data were computed assuming a weak ( G) magnetic field, which may be a poor assumption for a young NS. Qualitatively, however, the presence of a magnetic field of order G will shift the peak of the emission in a light-element atmosphere redward towards the ideal BB case (Pavlov et al. 1995), thus exacerbating the discrepancy between the data and standard NS cooling curves. We note, however, that the behavior of spectral shifts in ultrastrong magnetic fields (– G) has not yet been calculated.
While our inferred temperature is marginally consistent with standard NS cooling curves, the small emitting area remains problematic, especially given our limits on the X-ray pulsed fraction. Strong (– G) magnetic fields will produce a non-uniform temperature distribution on the surface of a NS, owing to anisotropic electron conduction through the star’s outer envelope (e.g. Greenstein & Hartke 1983; Heyl & Hernquist 1998b, 2000). However, the resulting temperature variation across the surface does not produce small hot spots, but is instead smoothly varying with a local flux roughly , where is the polar angle from the magnetic axis. This would reduce the effective area of the emitting surface by a factor , far less than the factor of 30–100 required by our spectral fits.
Similar conclusions motivated Pavlov et al. (2000) to consider a model in which the magnetic polar caps are intrinsically hotter than the bulk of the stellar surface, as a result of horizontal chemical abundance gradients through the conductive envelope. Light element envelopes transmit heat more readily than ones made of heavy elements (Chabrier, Potekhin & Yakovlev 1997; Heyl & Hernquist 1997a), so hot polar caps consisting of hydrogen embedded in a cooler iron crust can, in principle, yield an emitting area consistent with the spectral fits (Pavlov et al. 2000). However, such a model predicts that the emission should be pulsed at the rotation period of the star, unless either the magnetic and rotation axes are nearly aligned, or the line of sight nearly coincides with the rotation axis. Pulsed fractions at the level of 10–70% required to account for the putative thermal emission from middle aged radio pulsars (e.g. Becker & Trumper 1997) and AXPs (e.g., Mereghetti 2000) can be produced from smoothly varying properties of NS envelopes, such as anisotropic heat conduction (Heyl & Hernquist 1998b) or directionally dependent opacities (e.g. Pavlov et al. 1994, Zavlin et al. 1995, Shibanov et al. 1995), even when gravitational bending of light is included (e.g. Page 1995, Heyl & Hernquist 1998b). An even larger pulsed fraction will result, in general, from the hot spot model. For example, in the case of the orthogonal rotator model of Pavlov et al. (2000), we estimate typical maximum to minimum flux variations for NSs with radii km. This is in severe disagreement with the upper limits we obtain for the pulsed fraction.666For special choices of the NS radius, however, gravitational bending of light will make the entire stellar surface singly visible, eliminating any pulsed component; see, e.g. figure 7 of Heyl & Hernquist (1998b). Observationally, we cannot yet exclude the case of a nearly aligned rotator, but it is not clear that the horizontal abundance gradients required by the Pavlov et al. model will be stable for long times in the liquid crust.
3.3 Accretion onto a neutron star or black hole
We now consider the possibility that the point source in Cas A is powered by accretion onto a NS or a BH. This possibility was also raised by Umeda et al. (2000) and Pavlov et al. (2000). We assume that the accretion is fed by fallback material left over after the original supernova explosion (e.g. Chevalier 1989). We prefer such a model to a binary accretion model since there is no optical/IR evidence for a such binary companion star (van den Bergh & Pritchet 1986). A very low-mass dwarf companion might have evaded detection, but such a companion would be unlikely to remain bound in the binary following the supernova explosion, given the high mass of the Cas A progenitor (Brandt & Podsiadlowski 1995; Kalogera 1996).
We begin with the possibility of accretion onto a NS. If the accretion occurs via a thin disk extending down to the marginally stable orbit at , or the NS surface (whichever is larger), then we expect significant emission from an equatorial boundary layer where the accreting material meets the star. The emitting zone is expected to have a radial extent roughly equal to the local scale height of the disk (Narayan & Popham 1993; see also Inogamov & Sunyaev 1999 for a recent discussion of boundary layer models). If the boundary layer is optically thick, then it will emit BB radiation. For an accretion luminosity , the scale height is km, and the effective area of the radiating zone is few km2. This is in reasonable agreement with the effective area km2 determined from fitting the Chandra data (Table 2). We consider this a viable model, although we note that the optical thickness of such boundary layers is not well understood.
This boundary layer model requires that the NS have a very weak magnetic field. Specifically, the magnetospheric radius has to be smaller than the stellar radius, which implies that G for the estimated X-ray luminosity. If the magnetic field is somewhat stronger, then the disk would be terminated at . Even in this case, we might expect a boundary layer to develop at , and the model would be consistent with the observations for fields G. We note that for sufficiently large , accreting material is centrifugally expelled from the system at (Illarionov & Sunyaev 1975). In this case, very little material would reach the neutron star and there would be negligible X-ray emission (e.g., Chatterjee, Hernquist, & Narayan 2000; Alpar 1999, 2000).
If the NS instead has a magnetic field G typical of young radio pulsars, then boundary layer emission is unlikely to explain the observed X-rays. In this case, we would have to assume that the accreting material is able to reach the surface of the neutron star, which would require that the neutron star be spinning quite slowly (in order to avoid centrifugal expulsion of matter). The effective area of the radiating zone would again be small, and could thus be consistent with the observations. However, we would predict strong coherent pulsations in the X-ray signal . Our upper limit of 25% on the pulsed fraction from the Cas A point source does not rule out pulsations at the level observed in many known G accreting pulsars. More sensitive searches for pulsation would be very worthwhile.
A third kind of accreting NS model is one in which the accretion disk is truncated at a large transition radius, and the flow farther in occurs via an ADAF (as in the Narayan et al. 1997 model for low-luminosity BH binaries). Boundary layer emission in such a model is not well understood, so we are not in a position to predict the emission spectrum. However, if the ADAF is terminated at and the material then flows onto the magnetic poles, the spectrum would be similar to the case with a thin disk which was discussed above.
Accreting BH models face considerably greater difficulty in fitting the observations. This is because neither a boundary layer nor channeled accretion onto magnetic poles is expected. Therefore, any blackbody emission should be primarily from the inner accretion disk, with an effective area of several times , where is the Schwarzschild radius of the black hole. For a BH, the area is km2, which is clearly inconsistent with the X-ray data. This means that the X-ray emission from a BH point source in Cas A would have to originate either via Compton scattering in an optically thin corona over a thin disk, or via optically thin bremsstrahlung emission from a hot ADAF. We have explored models of this kind, using the modeling techniques described in Narayan et al. (1997) and Quataert & Narayan (1999), but we find that we need to fine-tune the models to an uncomfortable degree to fit the observations.
It is important to note that accretion models are severely constrained by the observed flux ratio between X-ray and optical bands. The optical limits on a stellar remnant in Cas A are and (van den Bergh & Pritchet 1986). Applying the extinction corrections estimated by these authors, the X-ray–to–optical flux ratio is . Although this is typical for bright X-ray binaries, it is considerably larger than the ratios observed in quiescent accreting BHs and NSs with luminosities comparable to the Cas A point source, e.g. for the BH system A0620–00 and for the NS system Cen X-4 (McClintock & Remillard 2000). Both sources have an X-ray luminosity lower than the point source in Cas A, and both have optical luminosities significantly higher than the upper limit for the Cas A source. If the spectra of these sources are characteristic of accreting BHs and NSs at low luminosities, then accretion models for Cas A are ruled out with high confidence.
It is possible, however, to evade this conclusion by arguing that these low-mass X-ray binaries (LMXBs) are a poor comparison to the Cas A point source. First of all, the quiescent optical emission in some BH binaries has been modeled as synchrotron emission from a hot advection-dominated accretion flow (ADAF) close to the BH (Narayan, McClintock & Yi 1996; Narayan, Barret & McClintock 1997). However, if the emission instead comes from a “hot spot” (e.g., where the accretion stream from the mass donor hits the thin accretion disk), then it is specific to binary systems and should be absent in systems with a fallback disk. This possibility has not been modeled in any detail. Also, X-ray reprocessing in the accretion disk is a significant source of optical emission in LMXBs (van Paradijs & McClintock 1995), especially since the outer disks evidently subtend a large semi-angle () at the central object (de Jong, van Paradijs, & Augusteijn 1996). The reason for such large angles may be warping of the outer disk (see Dubus et al. 1999; Esin et al. 2000). But if such warps are induced primarily by binary effects, then a fallback disk in Cas A might not be similarly warped (although it has been argued that irradiation alone can lead to significant warping; see Petterson 1977; Pringle 1996; Maloney et al. 1996). For an unwarped disk, the subtended semi-angle would be set by the disk’s scale height at the relevant radius ( cm). By employing an analysis similar to that in Perna, Hernquist & Narayan (1999), we estimate that the re-emitted optical flux in such a model would be (just) below the optical flux limits for the Cas A source.
Thus, the optical limits strongly constrain accretion models, but do not yet conclusively eliminate them. By comparing the predictions of the models with the X-ray observations, specifically the small effective area of the emission, we conclude that models with accreting NSs are more promising than those with BHs.
3.4 Comparison with AXPs, SGRs, and radio-quiet point sources
It is interesting to compare the properties of the Cas A point source with three classes of objects whose nature remains puzzling: AXPs, SGRs, and the radio-quiet non-plerionic X-ray point sources in SNRs. Both AXPs and SGRs pulse with slow spin periods despite being young objects (based on their association with SNRs). We summarize the X-ray properties of these objects in Table 3.
The X-ray spectrum of most AXPs is best characterized by a two-component spectrum consisting of a keV BB and a steep (–4) power law extending out to 10 keV, with comparable luminosity in both components. The BB components have –4 km and – erg s-1, quite similar to the BB fit for the Cas A point source. (We note that, due to poor photon statistics in the present data, we would be unable to detect the presence of an additional power-law component with this BB fit if the Cas A point source has an AXP-like two-component spectrum.) While four of the AXPs have large pulsed fractions (30–70%), two have much lower pulsed fractions (10–15%) which are consistent with the non-detection of pulsations in Cas A. However, the X-ray luminosity of the Cas A source is at least a factor of three to ten lower than that of the AXPs, in spite of its relative youth. Overall, the properties of the Cas A point source are roughly consistent with being an underluminous AXP. This possibility can be tested by a deeper search for long-period X-ray pulsations.
The quiescent emission of SGRs may be fit with a power law with –2.5 and a 2–10 keV luminosity of (3–100) erg s-1. These spectral parameters are also consistent with those measured for Cas A. However, we note that the proposed associations between SGRs and SNRs are somewhat tenuous, in contrast to those proposed for AXPs (Gaensler 2000). Moreover, no soft gamma-ray bursts have ever been detected from the direction of Cas A.
Finally, there are the three radio-quiet X-ray point sources that each lie near the center of an SNR and have no evidence for a plerion. The X-ray properties of these sources are summarized in Table 3. The X-ray emission from these objects is well characterized by a BB spectrum with –0.6 keV and –3 km, comparable to what we measure in Cas A. From a spectral point of view, these four sources form a remarkably homogeneous group. Pulsations ( ms) have recently been detected from the source in PKS 1209–52 (Zavlin et al. 2000), and possibly from the source in Pup A (Pavlov, Zavlin, & Trümper 1999); in both cases, the measured pulsed fraction is below the limit placed in Cas A. However, the point source in RCW 103 has shown order of magnitude variability in its flux (Gotthelf, Petre, & Vasisht 1999a), with a possible 6 hr periodicity recently reported (Garmire et al. 2000). This is in stark contrast to the Cas A point source, which shows no evidence for strong variability on either short (hours–weeks; see Table 1) or long (years; see Pavlov & Zavlin 1999; Pavlov et al. 2000) time scales.
4 CONCLUSIONS
At present, we do not have a unique model to account for the observed properties of the X-ray point source in Cas A. Thermal emission from an isolated, cooling NS can account for the data, but only if unconventional modifications are incorporated into spectral models in order to satisfy the requirement that the emitting area be small. Localized hot spots can, in principle, be produced on the surface of a NS by horizontal chemical abundance gradients in the liquid envelope (Pavlov et al. 2000). However, such hot spots should give rise to a significant pulsed component to the emission, in general, and such models will likewise be constrained by future limits or detections of X-ray modulation. Accretion onto a BH does not appear promising, but NS accretion provides a viable mechanism for explaining the characteristics of the X-ray emission. If the NS is very weakly magnetized, the observed emission could arise from a boundary layer. Otherwise, the X-rays could be produced by magnetically-channeled accretion onto the NS. In the latter case, we expect pulsed emission, so again, future timing limits test this interpretation.
The point source in Cas A is similar in many respects to the AXPs and quiescent SGRs, which have been interpreted as ultramagnetized neutron stars (“magnetars”; Duncan & Thompson 1992; Thompson & Duncan 1996; Heyl & Hernquist 1997a, 1997b) or as neutron stars with normal magnetic fields of order – G accreting from fallback disks (Chatterjee et al. 2000; Alpar 1999, 2000). It is important to note the detailed thermal emission from neutron stars with magnetic fields – has yet to be calculated. Conceivably, X-ray spectra in this regime could account for the small emitting areas of the Cas A point source and the AXPs without requiring small polar hot spots.
Regardless of the eventual resolution to the puzzling aspects of the point source in Cas A, it is already clear that the mere existence of this and similar objects demands a dramatic revision of our generally accepted notions of the nature of compact objects found in supernova remnants. The discovery of radio pulsars in the 1960s led to a paradigm in which supernovae generally leave behind strongly magnetized, rapidly rotating neutron stars. The subsequent failure to locate radio pulsars in the majority of SNRs has been a long-standing problem for this point of view (Kaspi 2000, Gotthelf & Vasisht 2000). The unanticipated properties of the Cas A point source and the relative youth of the Cas A SNR imply that the birthrate of “unusual” compact objects is likely to be at least roughly comparable to that of radio pulsars, potentially resolving the difficulties posed by SNR/pulsar associations. In this sense, the identification of the point source in Cas A may be as significant to our understanding of neutron stars as was the original discovery of radio pulsars.
References
- Alcock & Illarionov (1980) Alcock, C. & Illarionov 1980, ApJ, 235, 534
- Alpar (1999) Alpar, A. 1999, preprint (astro-ph/9912228)
- Alpar (2000) Alpar, A. 2000, ApJ, submitted (astro-ph/0005211)
- Anderson & Rudnick (1995) Anderson, M. C. & Rudnick, L. 1995, ApJ, 441, 307
- Arnaud (1996) Arnaud, K. A. 1996, in Astronomical Data Analysis Software and Systems V, ed. G. Jacoby & J. Barnes (San Francisco: ASP Conf. Ser. 101), 17
- Aschenbach (1999) Aschenbach, B. 1999, IAU Circ., No. 7249
- Ashworth (1980) Ashworth, W. B. 1980, J. Hist. Astr., 11, 1
- Becker & Trumper (1997) Becker, W. & Trumper, J. 1997, A&A, 326, 682
- Blandford, Applegate & Hernquist (1983) Blandford, R. D., Applegate, J. H. & Hernquist, L. 1983, MNRAS, 204, 1025
- Boyle et al. (1993) Boyle, B. J., Griffiths, R. E., Shanks, T., Stewart, G. C., & Georgantopoulos, I. 1993, MNRAS, 260, 49
- Brandt & Podsiadlowski (1995) Brandt, N. & Podsidalowski, P. 1995, MNRAS, 274, 461
- Brazier & Johnston (1999) Brazier, K. T. S. & Johnston, S. 1999, MNRAS, 305, 671
- Brown & Bethe (1994) Brown, G. E. & Bethe, H. A. 1994, ApJ, 423, 659
- Burke et al. (1997) Burke, B. E. et al., 1997, IEEE Trans. Elec. Devices, 44, 1633
- (15) Chabrier, G., Potekhin, A. Y., & Yakovlev, D. G. 1997, ApJ, 477, L99
- Chatterjee, Hernquist & Narayan (2000) Chatterjee, P., Hernquist, L., & Narayan, R. 2000, ApJ, 534, 373
- Chevalier (1989) Chevalier, R. A. 1989, ApJ, 346, 847
- Chen & Ruderman (1993) Chen, K. & Ruderman, M. 1993, ApJ, 402, 264
- Corbel et al. (1999) Corbel, S., Chapuis, C., Dame, T. M., & Durouchoux, P. 1999, ApJ, 526, L29
- Corbel et al. (1997) Corbel, S., Wallyn, P., Dame, T. M., Durouchoux, P., Mahoney, W. A., Vilhu, O., & Grindlay, J. E. 1997, ApJ, 478, 624
- Corbet & Mihara (1997) Corbet, R. H. D. & Mihara, T. 1997, ApJ, 475, L127
- de Jager, Swanepoel, & Raubenheimer (1989) de Jager, O. C., Swanepoel, J. W. H., & Raubenheimer, B. C. 1989, A&A, 221, 180
- de Jong, van Paradijs, & Augusteijn (1996) de Jong, J. A., van Paradijs, J., & Augusteijn, T. 1996, A&A, 314, 484
- Dubus et al. (1999) Dubus, G., Lasota, J.-P., Hameury, J.-M., & Charles, P. A. 1999, MNRAS, 303, 139
- Duncan & Thompson (1992) Duncan, R. C. & Thompson, C. 1992, ApJ, 392, L9
- (26) Eikenberry, S. S. & Matthews, K. 2000, ApJ, submitted
- Esin et al. (2000) Esin, A. A., Kuulkers, E., McClintock. J. E., & Narayan, R. 2000, ApJ, 532, 1069
- Fesen, Becker, & Blair (1987) Fesen, R. A., Becker, R. H., & Blair, W. P. 1987, ApJ, 313, 378
- Finley et al. (1993) Finley, J. P., Oegelman, H., Hasinger, G., & Trümper, J. 1993, ApJ, 410, 323
- Frail, Vasisht, & Kulkarni (1997) Frail, D. A., Vasisht, G., & Kulkarni, S. R. 1997, ApJ, 480, L129
- Fryer, Colgate, & Pinto (1999) Fryer, C. L., Colgate, S. A., & Pinto, P. A. 1999, ApJ, 511, 885
- Gaensler (2000) Gaensler, B. M. 2000, in Pulsar Astronomy — 2000 and Beyond, ed. M. Kramer, N. Wex, & R. Wielebinski (San Francisco: ASP), 703
- (33) Gaensler, B. M., Brazier, K. T. S., Manchester, R. N., Johnston, S., & Green, A. J. 1999a, MNRAS, 305, 724
- (34) Gaensler, B. M., Gotthelf, E. V., & Vasisht, G. 1999b, ApJ, 526, L37
- Gehrels (1986) Gehrels, N. 1986, ApJ, 303, 336
- Gotthelf, Petre, & Hwang (1997) Gotthelf, E. V., Petre, R., & Hwang, U. 1997, ApJ, 487, L175
- (37) Gotthelf, E. V., Petre, R., & Vasisht, G. 1999a, ApJ, 514, L107
- Gotthelf & Vasisht (1997) Gotthelf, E. V. & Vasisht, G. 1997, ApJ, 486, 133
- Gotthelf & Vasisht (2000) ———. 2000, in Pulsar Astronomy — 2000 and Beyond, ed. M. Kramer, N. Wex, & R. Wielebinski (San Francisco: ASP), 699
- Gotthelf et al. (2000) Gotthelf, E. V., Vasisht, G., Boylan-Kolchin, M., & Torii, K. 2000, ApJ, submitted (astro-ph/0008097)
- (41) Gotthelf, E. V., Vasisht, G., & Dotani, T. 1999b, ApJ, 522, L49
- Gotthelf & Wang (2000) Gotthelf, E. V. & Wang, Q. D. 2000, ApJ, 532, L117
- Greenstein & Hartke (1983) Greenstein, G. & Hartke, G.J. 1983, ApJ, 271, 283
- Harnden & Seward (1984) Harnden, F. R. & Seward, F. D. 1984, ApJ, 283, 279
- Hayashi et al. (1994) Hayashi, I. Koyama, K., Ozaki, M., Miyata, E., Tsunemi, H., Hughes, J. P., & Petre, R. 1994, PASJ, 46, L121
- Helfand & Becker (1984) Helfand, D. J. & Becker, R. H. 1984, Nature, 307, 215
- (47) Heyl, J. S. & Hernquist, L. 1997a, ApJ, 489, L67
- (48) ———. 1997b, ApJ, 491, L95
- (49) ———. 1998a, MNRAS, 298, L17 (HH98a)
- (50) ———. 1998b, MNRAS, 300, 599
- Heyl & Hernquist (2000) ———. 2000, MNRAS, in press (astro-ph/9808126)
- Holt et al. (1994) Holt, S. S., Gotthelf, E. V., Tsunemi, H., & Negoro, H. 1994, PASJ, 46, L151
- Hughes et al. (2000) Hughes, J. P., Rakowski, C. E., Burrows, D. N., & Slane, P. O. 2000, ApJ, 528, L109
- Hurley (2000) Hurley, K. 2000, in Proc. 5th Compton Symp., ed. M. McConnell (New York: AIP Press), in press (astro-ph/9912061)
- Hurley et al. (2000) Hurley, K. et al. 2000, ApJ, 528, L21
- Illarionov & Sunyaev (1975) Illarionov, A. F. & Sunyaev, R. A. 1975, A&A, 39, 185
- Inogamov & Sunyaev (1998) Inogamov, N. A. & Sunyaev, R. A. 1999, Astron. Lett., 25, 269
- (58) Israel, G. L., Covino, S., Stella, L., Campana, S., Haberl, F., & Mereghetti, S. 1999a, ApJ, 518, L107
- (59) Israel, G. L. et al. 1999b, A&A, 346, 929
- Kaaret et al. (2000) Kaaret, P. et al. 2000, ApJ, in press (astro-ph/0008388)
- Kalogera (1996) Kalogera, V. 1996, ApJ, 471, 352
- Kaspi (2000) Kaspi, V. M. 2000, in Pulsar Astronomy — 2000 and Beyond, ed. M. Kramer, N. Wex, & R. Wielebinski (San Francisco: ASP), 485
- Kaspi et al. (2000) Kaspi, V. M., Camilo, F., Lyne, A. G., Manchester, R. N., Bell, J. F., D’Amico, N., McKay, N. P. F., & Crawford, F. 2000, Astrophys. Lett. Comm., in press (astro-ph/9912281)
- Kaspi, Chakrabarty, & Steinberger (1999) Kaspi, V. M., Chakrabarty, D., & Steinberger, J. 1999, ApJ, 525, L33
- Kaspi et al. (1998) Kaspi, V. M., Crawford, F., Manchester, R. N., Lyne, A. G., Camilo, F., D’Amico, N., & Gaensler, B. M. 1998, ApJ, 503, L161
- Keohane, Rudnick, & Anderson (1996) Keohane, J. W., Rudnick, L., & Anderson, M. C. 1996, ApJ, 466, 309
- Koraleksy et al. (1998) Koralesky, B., Rudnick, L., Gotthelf, E. V., & Keohane, J. W. 1998, ApJ, 505, L127
- Kouveliotou et al. (1998) Kouveliotou, C. et al. 1998, Nature, 393, 235
- Lorimer, Lyne, & Camilo (1998) Lorimer, D. R., Lyne, A. G., & Camilo, F. 1998, A&A, 331, 1002
- Maloney, Begelman, & Pringle (1996) Maloney, P. R., Begelman, M. C., & Pringle, J. E. 1996, ApJ, 472, 582
- Marsden et al. (1997) Marsden, D. et al. 1997, ApJ, 491, L39
- Marsden et al. (1996) Marsden, D., Rothschild, R. E., Lingenfelter, R. E., & Puetter, R. C. 1996, ApJ, 470, 513
- Marshall et al. (1998) Marshall, F. E., Gotthelf, E. V., Zhang, W., Middleditch, J., Wang, Q. D. 1998, ApJ, 499, L179
- McClintock & Remillard (1999) McClintock, J. E. & Remillard, R. A. 2000, ApJ, 531, 956
- Mereghetti (2000) Mereghetti, S. 2000, in The Neutron Star–Black Hole Connection, ed. C. Kouveliotou, J. van Paradijs, & J. Ventura (Dordrecht: Kluwer), in press (astro-ph/9911252)
- Mereghetti, Bignami, & Caraveo (1996) Mereghetti, S., Bignami, G. F., & Caraveo, P. A. 1996, ApJ, 464, 842
- Mineo et al. (1999) Mineo, T., Cusumano, G., Massaro, E., Nicastro, L., Parmar, A. N., & Sacco, B. 1999, A&A, 348, 519
- Morrison & McCammon (1983) Morrison, R. & McCammon, D. 1983, ApJ, 270, 119
- Murray et al. (1997) Murray, S. S. et al. 1997, Proc. SPIE, 3114, 11
- (80) Narayan, R., Barret D., & McClintock, J. E. 1997, ApJ, 482, 448
- Narayan, McClintock & Yi (1996) Narayan, R., McClintock, J. E., & Yi, I. 1996, ApJ, 457, 821
- Narayan & Popham (1993) Narayan, R. & Popham R. 1993, Nature, 362, 820
- Oosterbroek et al. (1998) Oosterbroek, T., Parmar, A. N., Mereghetti, S., & Israel, G. L. 1998, A&A, 334, 925
- Page (1995) Page, D. 1995, ApJ, 442, 273
- Page (1998) ———. 1998, in The Many Faces of Neutron Stars, ed. R. Buccheri, J. van Paradijs, & M. A. Alpar (Dordrecht: Kluwer), 539
- Page & Sarmiento (1996) Page, D. & Sarmiento, A. 1996, ApJ, 473, 1067
- Pavlov & Zavlin (1999) Pavlov, G. G. & Zavlin, V. E. 1999, IAU Circ., No. 7270
- Pavlov, Zavlin, & Trümper (1999) Pavlov, G. G., Zavlin, V. E., & Trümper, J. 1999, ApJ, 511, L45
- Pavlov et al. (1994) Pavlov, G. G., Shibanov, Y. A., Ventura, J. & Zavlin, V. E. 1994, A&A, 289, 837
- Pavlov et al. (1995) Pavlov, G. G., Shibanov, Y. A., Zavlin, V. E., & Meyer, R. D. 1995, in The Lives of the Neutron Stars, ed. M. A. Alpar, U. Kiziloglu, & J. van Paradijs (Dordrecht: Kluwer), 71
- Pavlov et al. (2000) Pavlov, G. G., Zavlin, V. E., Aschenbach, B., Trümper, J., & Sanwal, D. 1999b, ApJ, 531, L53
- Perna, Hernquist & Narayan (1999) Perna, R., Hernquist, L. & Narayan, R. 1999, ApJ, submitted (astro-ph/9912297)
- Petre, Becker, & Winkler (1996) Petre, R., Becker, C. M., & Winkler, P. F. 1996, ApJ, 465, L43
- Petre et al. (1982) Petre, R., Kriss, G. A., Winkler, P. F., & Canizares, C. R. 1982, ApJ, 258, 22
- Petterson (1977) Petterson, J. A. 1977, ApJ, 216, 827
- Pringle (1996) Pringle, J. E. 1996, MNRAS, 281, 357
- Quataert & Narayan (1999) Quataert, E. & Narayan, R. 1999, ApJ, 520, 298
- Rajagopal & Romani (1996) Rajagopal, M. & Romani, R. W. 1996, ApJ, 461, 327
- Reed et al. (1995) Reed, J. E., Hester, J. J., Fabian, A. C., & Winkler, P. F. 1995, ApJ, 440, 706
- Rho & Petre (1997) Rho, J. & Petre, R. 1997, ApJ, 484, 828
- Romani (1987) Romani, R. W. 1987, ApJ, 313, 718
- Romani (1996) Romani, R. W. 1996, in Pulsars: Problems and Progress, IAU Colloq. 160, ed. S. Johnston, M. A. Walker, & M. Bailes (San Franciso: ASP), 331
- Rutledge et al. (1999) Rutledge, R. E., Bildsten, L., Brown, E .F., Pavlov, G. G., & Zavlin, V. E. 1999, ApJ, 514, 945
- Seward (2000) Seward, F. D. 2000, HRC Timing Problem, Chandra X-Ray Observatory Center announcement, http://asc.harvard.edu/udocs/hrc/timing.html
- Seward & Harnden (1994) Seward, F. D. & Harnden, F. R., J. 1994, ApJ, 421, 581
- Shibanov et al. (1995) Shibanov, Y. A., Pavlov, G. G., Zavlin, V. E. & Tsuruta, S. 1995, in 17th Texas Symposium on Relativistic Astrophysics and Cosmology, ed. H. Böhringer, G. E. Morfill & J. E. Trümper (New York: NY Acad. of Sci.), 291
- Sonobe et al. (1994) Sonobe, T., Murakami, T., Kulkarni, S. R., Aoki, T., & Yoshida, A. 1994, ApJ, 436, L23
- Standish et al. (1992) Standish, E. M., Newhall, X. X., Williams, J. G., & Yeomans, D. K. 1992, in Explanatory Supplement to the Astronomical Almana, ed. P. K. Seidelmann (Mill Valley: University Science), 279
- Sugizaki et al. (1997) Sugizaki, M., Nagase, F., Torii, K. I., Kinugasa, K., Asanuma, T., Matsuzaki, K., Koyama, K., & Yamauchi, S. 1997, PASJ, 49, L25
- Tananbaum (1999) Tananbaum, H. 1999, IAU Circ., No. 7246
- Taylor, Manchester, & Lyne (1993) Taylor, J. H., Manchester, R. N., & Lyne, A. G. 1993, ApJS, 88, 529
- Thompson & Duncan (1996) Thompson, C. & Duncan, R.C. 1996, ApJ, 473, 322
- (113) Torii, K. I., Kinugasa, K., Katayama, K., Tsunemi, H., & Yamauchi, S. 1998a, ApJ, 503, 843
- (114) Torii, K. I. et al. 1998b, ApJ, 494, L207 Katayama, K., Tsunemi, H., & Yamauchi, S. 1998, ApJ, 503, 843
- Tuohy & Garmire (1980) Tuohy, I. & Garmire, G. 1980, ApJ, 239, 107
- Turner & Pounds (1986) Turner, T. J. & Pounds, K. A. 1986, MNRAS, 240, 833
- Umeda et al. (2000) Umeda, H., Nomoto, K., Tsuruta, S., & Mineshige, S. 2000, ApJ, 534, L193
- van den Bergh & Kamper (1983) van den Bergh, S. & Kamper, K. W. 1983, ApJ, 268, 129
- van den Bergh & Pritchet (1986) van den Bergh, S. & Pritchet, C. J. 1986, ApJ, 307, 723
- van der Klis (1989) van der Klis, M. 1989, in Timing Neutron Stars, ed. H. Ogelman & E. P. J. van den Heuvel (Dordrecht: Kluwer), 27
- van Paradijs & McClintock (1995) van Paradijs, J. & McClintock, J. E. 1995, in X-Ray Binaries, ed. W. H. G. Lewin, J. van Paradijs, & E. P. J. van den Heuvel (Cambridge: Cambridge Univ. Press), 58
- Vancura et al. (1992) Vancura, O., Blair, W. P., Long, K. S., & Raymond, J. C. 1992, ApJ, 394, 158
- Vasisht et al. (1994) Vasisht, G., Kulkarni, S. R., Frail, D. A., & Greiner, J. 1994, ApJ, 431, L35
- Vink et al. (1998) Vink, J., Bloemen, H., Kaastra, J. S., & Bleeker, J. A. M. 1998, A&A, 339, 201
- (125) Wang, Q. D. & Gotthelf, E. V. 1998a, ApJ, 494, 623
- (126) Wang, Q. D. & Gotthelf, E. V. 1998b, ApJ, 509, L109
- Weisskopf et al. (2000) Weisskopf, M. C., Tananbaum, H. D., van Speybroeck, L. P., & O’Dell, S. L. 2000, Proc. SPIE, in press (astro-ph/0004127)
- White et al. (1996) White, N. E., Angelini, L., Ebisawa, K., Tanaka, Y., & Ghosh, P. 1996, ApJ, 463, L83
- (129) Woods, P. M., Kouveliotou, C., van Paradijs, J., Finger, M. H., & Thompson, C. 1999a, ApJ, 518, L103
- (130) Woods, P. M. et al. 1999b, ApJ, 519, L139
- Woosley & Timmes (1996) Woosley, S. E. & Timmes, F. X. 1996, Nucl. Phys. A, 606, 137
- Young, Manchester, & Johnston (1999) Young, M. D., Manchester, R. N., & Johnston, S. 1999, Nature, 400, 848
- Zampieri et al. (1998) Zampieri, L., Colpi, M., Shapiro, S. L., & Wasserman, I. 1998, ApJ, 505, 876
- Zampieri et al. (1995) Zampieri, L., Turolla, R., Zane, S., & Treves, A. 1995, ApJ, 439, 849
- Zavlin, Pavlov, & Shibanov (1996) Zavlin, V. E., Pavlov, G. G., & Shibanov, Y. A. 1996, A&A, 315, 141 (ZPS96)
- Zavlin et al. (1995) Zavlin, V. E., Pavlov, G. G., Shibanov, Y. A. & Ventura, J. 1995, A&A, 297 441
- Zombeck et al. (1995) Zombeck, M. V. et al. 1995, Proc. SPIE, 2518, 96