The Space Density of Primordial Gas Clouds near Galaxies and Groups and their Relation to Galactic HVCs
Abstract
The Arecibo H i Strip Survey probed the halos of 300 cataloged galaxies and the environments of 14 groups with sensitivity to neutral hydrogen masses . The survey detected no objects with properties resembling the High Velocity Clouds (HVCs) associated with the Milky Way or Local Group. If the HVCs were typically objects distributed throughout groups and galaxy halos at distances of 1 Mpc, the survey should have made 70 HVC detections in groups and 250 detections around galaxies. The null detection implies that HVCs are deployed at typical distances of 200 kpc from the galaxies or group barycenters. If the clouds are in virial equilibrium, their average dark matter fraction must be 98% or higher.
1 Introduction
After an extensive review of the High Velocity Cloud (HVC) literature, Wakker & van Woerden (1997) concluded that no single origin can account for the properties of the HVC population of neutral hydrogen clouds that surround the Milky Way Galaxy. Instead, several mechanisms, including infalling extragalactic clouds, cloud circulation within the Galactic halo driven by a galactic fountain, and a warped outer arm extension to the Galaxy must be invoked. The Magellanic Stream and associated HVC complexes require an explanation due to tidal interactions within the Local Group (LG) (cf. Putman et al., 1998).
A defining property for the HVCs has been the lack of associated stellar emission. This also means that spectroscopic parallax methods cannot be used to measure distances to the clouds, and the lack of known distances, in turn, hinders the calculation of the clouds’ physical properties. Recently, absorption lines (cf. van Woerden et al., 1999) and Balmer recombination line emission driven by reprocessing of the ionizing radiation originating in the Galactic star forming regions (Bland-Hawthorn et al., 1998; Bland-Hawthorn & Maloney, 1999) have been used to specify distances to a few of the clouds, indicating a range of distances from within the Galactic halo to greater than 50 kpc.
Recent interest has returned to the idea that HVCs could be primordial objects raining on the Galaxy, as either remnants from the formation of the LG or as representatives from an intergalactic population of dark matter dominated mini-halos in which hydrogen has collected and remained stable on cosmological time scales (Blitz et al. 1999, BSTHB; Braun & Burton 1999, BB). The requirement of gravitational stability without star formation places lower limits on the distances of the clouds from the Sun – a sort of independent distance indicator that can be applied to each cloud individually, depending on its H i flux, angular extent and velocity profile width. Typical derived distances are of order 1 Mpc, implying that this segment of the HVC population (1) inhabits the LG rather than the Galactic halo, (2) has typical H i mass per cloud greater than , and (3) increases the LG H i mass budget by contributing in the case of the BSTHB sample. For the BB sample, which is restricted to 65 confirmed “compact HVCs”, the integral H i content adds to the LG.
Further impetus to search for a primordial population of low mass objects comes from simulations of galaxy and group formation (cf. Klypin et al., 1999), which predict of order 10 times more mini-halos in the LG than can be counted in the dwarf galaxy population. The association of HVCs with this missing population, as well as arguments based on the kinematics of the cloud population (BSTHB and BB), makes an appealing picture for the extragalactic/LG explanation.
Similar concerns motivated the extragalactic 21cm line survey by Weinberg et al. (1991), whose study of several representative environments (clusters and voids) found only gas-rich galaxies containing stars. Several extragalactic H i surveys of substantially larger volumes to more sensitive H i mass limits have also found no objects with HVC properties (i.e. H i detections without associated starlight) (Zwaan et al., 1997; Spitzak & Schneider, 1999; Kilborn et al., 1999).
Clearly, if the HVC phenomenon is a common feature of galaxy formation and evolution, then extragalactic surveys of the halos and group environments of nearby galaxies should show evidence for this population. We take two approaches to the problem of placing the local HVC population in an extragalactic context. The first (in sections 3 and 4) is to compute the H i mass function for the local group, both for optically selected group members and for group members plus HVC populations as modeled by BSTHB and BB. The second, separate approach (section 4) is to calculate the probability that the narrow strip that the Arecibo111The Arecibo Observatory is part of the National Astronomy and Ionosphere Center, which is operated by Cornell University under a cooperative agreement with the National Science Foundation H i Strip Survey (AHiSS) (Sorar, 1994; Zwaan et al., 1997) makes through the halos of 200 galaxy halos and 14 groups would detect members of HVC populations in those systems.
2 The Local Group H i Mass Function
The H i mass function (HiMF) is used in extragalactic astronomy to quantify the space density of gas-rich galaxies and possible intergalactic clouds as a function of H i mass. For the field galaxy population, the HiMF has been determined accurately for and can be fit satisfactorily with a faint end slope (Briggs & Rao, 1993; Zwaan et al., 1997; Kilborn et al., 1999). At lower , where there is considerable uncertainty due to the small number of detections, Schneider et al. (1998) have found evidence for a steep upturn in the tail of the HiMF. Although this steep tail has a tantalizing similarity to the signature of massive HVCs, it appears that at least one of the two H i signals responsible for the rise comes from a normal galaxy, and the other is too close to a bright star to exclude faint optical emission (Spitzak & Schneider, 1999).
We construct the HiMF for the LG from H i measurements of all known LG members as compiled recently by Mateo (1998). Within the LG volume, a total of 22 galaxies are known in which H i has been detected. The statistics are therefore poor, and consequently the HiMF is noisy. The LG HiMF is in one sense the best measured HiMF, with data over six orders of magnitude, compared to three or four orders of magnitude for determination for the field galaxy population. On the other hand, the LG HiMF may suffer from severe selection effects due to obscuration by dust in the disk of the Milky Way galaxy. In order to estimate how many galaxies might have escaped detection so far, Mateo (1998) plotted the cumulative number of galaxies as a function of , for the total sample of LG galaxies. If LG galaxies were distributed equally over the sky, the resulting histogram should be a straight line. We applied the same method to the sample of galaxies with H i detections and found that 4 to 7 galaxies with H i masses are likely to be missing at low Galactic latitude. The missing galaxies would be predominantly the ones with low optical surface brightness, but since there is no clear correlation between surface brightness and H i mass, it is not possible to make a more refined correction to the HiMF than just adding one galaxy to each half decade mass bin below . For larger galaxies with , we assume that the census of the LG galaxy population is complete (cf. Henning et al., 1998).
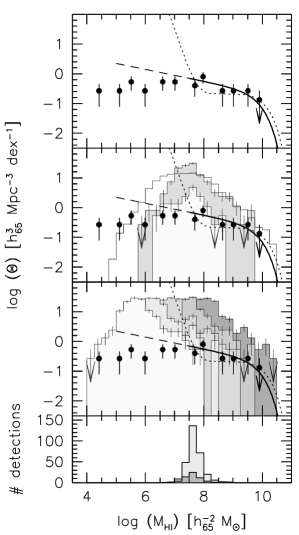
The result is presented in the top panel of Fig. 1, where the points represent the LG HiMF and the line is the field HiMF derived by Zwaan et al. (1997) scaled vertically so as to fit the points in the region around where the curve has been measured accurately. This scaling is justified given the fact that the HiMF for optically selected and H i selected galaxies is identical (cf. Briggs & Rao, 1993; Zwaan et al., 1997). The scaling accounts for the overdensity of the LG, which amounts to a factor of 25, assuming that the LG volume is 15 Mpc3. Also shown is a HiMF with a steep upturn proposed by Schneider et al. (1998). The large divergence between the extrapolated curves from Zwaan et al. (1997) and Schneider et al. (1998) illustrates the uncertainty in HiMF below . The LG HiMF for optically selected galaxies is remarkably flat, with the faint-end slope of a Schechter function fit of .
Studies of the H i content of galaxies in different environments (including voids [Szomoru et al. 1996], clusters [McMahon 1993] and groups [Kraan-Korteweg et al. 1999]) have shown that the shape of the HiMF for is independent of cosmic density. The fact that we find here that the HiMF of optically selected LG members is flat down to H i masses of a few does not, however, insure that the field HiMF is also flat to these low masses. Although the crossing time of the LG is approximately equal to a Hubble time, there are clear indications of interactions (Mateo, 1998, and references therein). The H i distributions in the lowest luminosity LG dwarfs are often highly asymmetric, perhaps indicative of tidal distortions. It is quite possible that low mass systems are destroyed or merged, which could cause the LG HiMF to be flatter than that of the field.
3 H i Mass Functions for Extragalactic HVCs
We now derive HiMFs for the population of extragalactic HVCs as proposed by BSTHB and BB. For the compact, isolated HVCs identified by BB, we estimate H i masses by using their measurements of the integrated fluxes and the assumption that all clouds are at the same 1 Mpc distance, suggested by BB. Typical H i masses are then a few times and the sizes are approximately 15 kpc. The resulting HiMF is indicated by the light shaded histogram in the second panel of Fig. 1. For the BSTHB sample we use the compilation of HVCs by Wakker & van Woerden (1991, WW), which forms the main source for the BSTHB analysis. For each cloud the distance at which the cloud is gravitationally stable is calculated. Adopting BHTHB’s value of for the ratio of baryonic mass to total mass leads to typical distances of self-gravitating HVCs of Mpc.
The dark shaded histogram represents the HiMF for the BSTHB clouds, assuming that all clouds are at their distance . The resulting HiMF shows a clear peak at approximately , equal to the typical H i mass estimated by BSTHB. The largest uncertainty in the determination of is , which might vary from cloud to cloud. We tested the effect of a varying on the HiMF by applying to each individual cloud a random value of in the range to . The resulting HiMF (shown by the unshaded histogram) is not significantly different from the HiMF based on a fixed in the region of interest .
The space density of the BB HVC population is comparable to the HiMF for optically selected LG galaxies, but it is obvious that the BSTHB HVCs outnumber normal galaxies by a factor 5 to 10 in the range . This implies that if the BSTHB cloud population is typical for galaxy groups, H i surveys in groups should have encountered 5 to 10 dark H i clouds for every detected galaxy. This is clearly at variance with the observations.
At what distances from the Milky Way must the HVCs be located so that their HiMF is not in conflict with the observed field HiMF? Since the virial distance is directly proportional to , we can test this by varying from 0.2 to 0.025 and calculate the resulting HiMF. The results are shown in the third panel of Fig. 1. The space density of HVCs in the LG can only be brought into agreement with the observed field HiMF if the median value of is lowered to , a value much lower than what is normally observed in galaxies. The median distance of such clouds must be smaller than kpc.
4 Expected number of extragalactic HVC detections
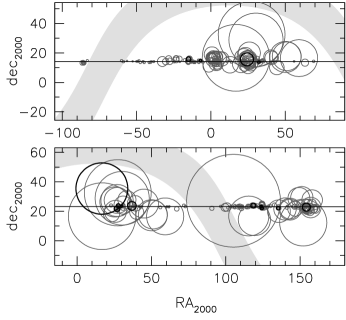
The Arecibo H i Strip Survey (AHiSS), which is discussed in detail in Sorar (1994) and Zwaan et al. (1997), puts limits on the space density of primordial gas clouds in external galaxy groups and around galaxies. The survey was taken in drift-scan mode and consists of two strips at constant declinations, together covering of RA over a redshift range from to . The limiting column density was , which is lower than that of most of the HVCs in the WW compilation and those presented in BB. The sky coverage is small (15 deg2 excluding the side lobes) but the survey strip passes through the halo regions of many groups and galaxies as shown in Fig. 2. The unique character of this survey makes it therefore more suitable to assess the HVC problem than other surveys of equal size. From the Lyon-Meudon Extragalactic Database (LEDA222We have made use of the Lyon-Meudon Extragalactic Database (LEDA) supplied by the LEDA team at the CRAL-Observatoire de Lyon (France). ) we selected all known galaxies with projected distances Mpc from the two AHiSS strips. The circles in Fig. 2 indicate shells with 1 Mpc radii around the galaxies. Since the discussion in BSTHB is primarily focussed on galaxy groups, we also selected all cataloged groups within 1 Mpc of the strips. Galaxy groups were drawn from Willick et al. (1997), who used the the Mark III catalog, and Garcia (1993) who selected groups from the LEDA galaxy sample.
We fill the volumes around the selected groups and galaxies with a synthetic population of HVCs similar to the one proposed in BSTHB. To construct such an ensemble we make use of the compilation of HVCs by WW as discussed in section 3. Although BSTHB put particular emphasis on galaxy groups, we choose to consider clouds around individual galaxies as well. Hierarchical formation scenarios do not distinguish between galaxies and groups in the relative number of satellites (Klypin et al., 1999). Further motivation comes from the fact that in the LG, subclustering of dwarfs is observed around the Milky Way and M31 (Mateo, 1998).
The beam of the Arecibo telescope subtends at a distance Mpc. The typical sizes of the HVCs discussed in BSTHB are 28 kpc and the lowest column density clouds could therefore be detected out to distances of 32 Mpc, beyond which the average HVC would no longer fill the beam. HVCs with column densities in excess of the limiting value of could be detected to larger distances. The limiting column density for clouds at large distances where is . For each group and galaxy, a fraction of the volume of the surrounding sphere is scanned by the Arecibo beam. The number of clouds within that volume is calculated, taking into account the column densities and sizes of the individual clouds.
Table 1 lists the number of clouds that would have been detected in the Arecibo H i strip survey if a population of extragalactic HVCs existed with the BSTHB properties. We calculate the numbers of clouds differently for groups and for galaxies. Since BSTHB do not specify the exact radial distribution of clouds, we tested three different radial distribution functions to fill the volumes with clouds: 1) a spherical volume of radius , 2) a thin spherical shell of radius , and 3) a thick spherical shell with clouds distributed according to a Gaussian about the radius with dispersion . The latter distribution most closely resembles the derived distribution of given in BSTHB. The numbers in the table are based on , the value preferred by both BSTHB and BB. The group halos are filled with 450 clouds, the number of HVCs identified by WW, excluding complexes A, C, M, the Outer Arm and the Magellanic Stream. To calculate the expected number of clouds around galaxies, the number of clouds associated with each galaxy is scaled in direct proportion to the ratio of the galaxy luminosity compared to the integral luminosity of the LG. This leads to a median number of clouds per galaxy of 40.
Table 1 shows that the expected number of detections is essentially independent of how the clouds are distributed around the groups and galaxies. For these samples we should detect approximately 250 clouds around galaxies and 70 around groups if the HVC population of BSHTB is a common feature of nearby galaxies. Restricting our analysis to the compact clouds of BB, reduces these numbers to 39 and 9. For a uniformly filled spherical distribution of BSTHB clouds, the distribution of H i masses of the expected detections is shown in the lowest panel in Fig. 1. This figure illustrates that our analysis is sensitive to typical H i clouds (compare second panel of Fig. 1), and not only to the most massive ones.
The robustness of the result is demonstrated in Table 1, where the numbers in parentheses indicate the expected number of detections if the detection threshold is increased from to . The average decrease is 25%. A 50% decrease occurs if the detection threshold is set at . This extremely conservative threshold would still predict more than 100 detections.
5 Conclusions
The hypothesis that HVCs are primordial gas clouds with typical H i masses of a few at distances of Mpc from the Galaxy is not in agreement with observations of nearby galaxies and groups. Blind H i surveys of the extragalactic sky would have detected these clouds if they exist around all galaxies or galaxy groups in numbers equal to those suggested for the Local Group. These results are highly significant: the Arecibo H i strip survey would have detected approximately 250 clouds around individual galaxies and 70 in galaxy groups.
References
- Bland-Hawthorn et al. (1998) Bland-Hawthorn, J., Veilleux, S., Cecil, G. N., Putman, M. E., Gibson, B. K., & Maloney, P. R. 1998, MNRAS, 299, 611
- Bland-Hawthorn & Maloney (1999) Bland-Hawthorn, J., & Maloney, P. R. 1999, ApJ, 510, L33
- Blitz et al. (1999) Blitz, L., Spergel, D. N., Teuben, P. J., Hartmann, D., & Burton, W. B. 1999, ApJ, 514, 818
- Braun & Burton (1999) Braun, R., & Burton, W. B 1999, A&A, 341, 437
- Briggs & Rao (1993) Briggs, F. H., & Rao, S. 1993, ApJ, 417, 494
- Garcia (1993) Garcia, A. M. 1993, A&AS, 100, 47
- Henning et al. (1998) Henning, P. A., Kraan-Korteweg, R. C., Rivers, A. J., Loan, A. J., Lahav, O., & Burton, W. B 1998, AJ, 115, 584
- Kilborn et al. (1999) Kilborn, V., Webster, R. L., & Staveley-Smith 1999, PASA, 16, 8
- Klypin et al. (1999) Klypin, A. A., Kravtsov, A. V., Valenzuela, O., & Prada, F. 1999, ApJ, submitted
- Kraan-Korteweg et al. (1999) Kraan-Korteweg, R. C., van Driel, W., Briggs, F. H., Binggeli, B., & Mostefaoui, T. I. 1999, A&AS, 135, 255
- Mateo (1998) Mateo, M. L. 1998, ARA&A, 36, 435
- McMahon (1993) McMahon, P. M. 1993, Ph.D Thesis, Columbia University
- Putman et al. (1998) Putman, M. E. et al. 1998, Nature, 394, 752
- Schneider et al. (1998) Schneider, S. E., Spitzak, & J. G., Rosenberg, J. L. 1998, ApJ, 507, L9
- Sorar (1994) Sorar, E. 1994, Ph.D. Thesis, University of Pittsburgh
- Spitzak & Schneider (1999) Spitzak, J. G., & Schneider, S. S. 1999, ApJS, 119, 159
- Szomoru et al. (1996) Szomoru, A., van Gorkom, J. H., Gregg, M. D., & Strauss, M. A. 1996, AJ, 111, 2150
- Szomoru et al. (1994) Szomoru, A., Guhathakurta, P., van Gorkom, J. H., Knapen, J. H., Weinberg, & D. H., Fruchter, A. S. 1994, AJ, 108, 491
- Wakker & van Woerden (1991) Wakker, B. P., & van Woerden, H. 1991, A&A, 250, 509
- Wakker & van Woerden (1997) Wakker, B. P., & van Woerden, H. 1997, ARA&A, 35, 217
- van Woerden et al. (1999) van Woerden, H., Schwarz, U. J., Peletier, R. F., Wakker, B. P., & Kalberla, P. M. W. 1999, Nature, 400, L138
- Weinberg et al. (1991) Weinberg, D. H., Szomoru, A., Guhathakurta, P., & van Gorkom, J. H. 1991, ApJ, 372, L13
- Willick et al. (1997) Willick J. A., Courteau S., Faber S. M., Burstein D., Dekel A., & Strauss M. A. 1997, ApJS, 109, 333
- Zwaan et al. (1997) Zwaan, M. A., Briggs, F. H., Sprayberry, D., & Sorar, E. 1997, ApJ, 490, 173
| BSTHB | |||||
|---|---|---|---|---|---|
| uniform | shell | Gaussian | BB | selected | |
| groups | 70(52) | 72(54) | 70(52) | 9(8) | 14 |
| galaxies | 248(167) | 256(173) | 260(177) | 39(28) | 347 |
Note. — The number of expected HVC detections are calculated assuming a detection threshold. The numbers in parentheses indicate the expected number if the threshold is raised to . The last column shows the number of groups and galaxies that are included in the analysis. For the Gaussian distributions a selection radius of 2 Mpc has been used for inclusion in the sample.