Neutral Evolution of Mutational Robustness
Abstract
We introduce and analyze a general model of a population evolving over a network of selectively neutral genotypes. We show that the population’s limit distribution on the neutral network is solely determined by the network topology and given by the principal eigenvector of the network’s adjacency matrix. Moreover, the average number of neutral mutant neighbors per individual is given by the matrix spectral radius. This quantifies the extent to which populations evolve mutational robustness: the insensitivity of the phenotype to mutations. Since the average neutrality is independent of evolutionary parameters—such as, mutation rate, population size, and selective advantage—one can infer global statistics of neutral network topology using simple population data available from in vitro or in vivo evolution. Populations evolving on neutral networks of RNA secondary structures show excellent agreement with our theoretical predictions.
I Introduction
Kimura’s contention that a majority of genotypic change in evolution is selectively neutral [24] has gained renewed attention with the recent analysis of evolutionary optimization methods [4, 31] and the discovery of neutral networks in genotype-phenotype models for RNA secondary structure [10, 14, 29] and protein structure [1, 3]. It was found that collections of mutually neutral genotypes, which are connected via single mutational steps, form extended networks that permeate large regions of genotype space. Intuitively, a large degeneracy in genotype-phenotype maps, when combined with the high connectivity of (high-dimensional) genotype spaces, readily leads to such extended neutral networks. This intuition is now supported by recent theoretical results [2, 13, 26, 28].
In in vitro evolution of ribozymes, mutations responsible for an increase in fitness are only a small minority of the total number of accepted mutations [35]. This indicates that, even in adaptive evolution, the majority of point mutations is neutral. The fact that only a minority of loci is conserved in sequences evolved from a single ancestor similarly indicates a high degeneracy in ribozymal genotype-phenotype maps [25]. Neutrality is also implicated in experiments where RNA sequences evolve a given structure starting from a range of different initial genotypes [7]. More generally, neutrality in RNA and protein genotype-phenotype maps is indicated by the observation that their structures are much better conserved during evolution than their sequences [15, 18].
Given the presence of neutral networks that preserve structure or function in sequence space, one asks, How does an evolving population distribute itself over a neutral network? Can we detect and analyze structural properties of neutral networks from data on biological or in vitro populations? To what extent does a population evolve toward highly connected parts of the network, resulting in sequences that are relatively insensitive to mutations? Such mutational robustness has been observed in biological RNA structures [22, 33] and in simulations of the evolution of RNA secondary structure [21]. However, an analytical understanding of the phenomenon, the underlying mechanisms, and their dependence on evolutionary parameters—such as, mutation rate, population size, selection advantage, and the topology of the neutral network—has up to now not been available.
Here we develop a dynamical model for the evolution of populations on neutral networks and show analytically that, for biologically relevant population sizes and mutation rates, a population’s distribution over a neutral network is determined solely by the network’s topology. Consequently, one can infer important structural information about neutral networks from data on evolving populations, even without specific knowledge of the evolutionary parameters. Simulations of the evolution of a population of RNA sequences, evolving on a neutral network defined with respect to secondary structure, confirm our theoretical predictions and illustrate their application to inferring network topology.
II Modeling Neutrality
We assume that genotype space contains a neutral network of high, but equal fitness genotypes on which the majority of a population is concentrated and that the neighboring parts of genotype space consist of genotypes with markedly lower fitness. The genotype space consists of all sequences of length over a finite alphabet of symbols. The neutral network on which the population moves can be most naturally regarded as a graph embedded in this genotype space. The vertex set of consists of all genotypes that are on the neutral network; denote its size by . Two vertices are connected by an edge if and only if they differ by a single point mutation.
We will investigate the dynamics of a population evolving on this neutral network and analyze the dependence of several population statistics on the topology of the graph . With these results, we will then show how measuring various population statistics enables one to infer ’s structural properties.
For the evolutionary process, we assume a discrete-generation selection-mutation dynamics with constant population size . Individuals on the neutral network have a fitness . Individuals outside the neutral network have fitnesses that are considerably smaller than . Under the approximations we use, the exact fitness values for genotypes off turn out to be immaterial. Each generation, individuals are selected with replacement and with probability proportional to fitness and then mutated with probability . These individuals form the next generation.
This dynamical system is a discrete-time version of Eigen’s molecular evolution model [6]. Our analysis can be directly translated to the continuous-time equations for the Eigen model. The results remain essentially unchanged.
Although our analysis can be extended to more complicated mutation schemes, we will assume that only single point mutations can occur at each reproduction of an individual. With probability one of the symbols is chosen with uniform probability and is mutated to one of the other symbols. Thus, under a mutation, a genotype moves with uniform probability to one of the neighboring points in genotype space.
A Infinite-Population Solution
The first step is to solve for the asymptotic distribution of the population over the neutral network in the limit of very large population sizes.
Once the (infinite) population has come to equilibrium, there will be a constant proportion of the population located on the network and a constant average fitness in the population. Under selection the proportion of individuals on the neutral network increases from to . Under mutation a proportion of these individuals remains on the network, while a proportion falls off the neutral network to lower fitness. At the same time, a proportion of individuals located outside mutate onto the network so that an equal proportion ends up on in the next generation. Thus, at equilibrium, we have a balance equation:
| (1) |
In general, the contribution of to is negligible. As mentioned above, we assume that the fitness of the network genotypes is substantially larger than the fitnesses of those off the neutral network and that the mutation rate is small enough so that the bulk of the population is located on the neutral network. Moreover, since their fitnesses are smaller than the average fitness , only a fraction of the individuals off the network produces offspring for the next generation. Of this fraction, only a small fraction mutates onto the neutral network . Therefore, we neglect the term in Eq. (1) and obtain:
| (2) |
This expresses the balance between selection expanding the population on the network and deleterious mutations reducing it by moving individuals off.
Under mutation an individual located at genotype of with vertex degree (the number of neutral mutant neighbors) has probability
| (3) |
to remain on the neutral network . If asymptotically a fraction of the population is located at genotype , then is simply the average of over the asymptotic distribution on the network: . As Eq. (3) shows, the average is simply related to the population neutrality . Moreover, using Eq. (2) we can directly relate the population neutrality to the average fitness :
| (4) |
Despite our not specifying the details of ’s topology, nor giving the fitness values of the genotypes lying off the neutral network, one can relate the population neutrality of the individuals on the neutral network directly to the average fitness in the population. It may seem surprising that this is possible at all. Since the population consists partly of sequences off the neutral network, one expects that the average fitness is determined in part by the fitnesses of these sequences. However, under the assumption that back mutations from low-fitness genotypes off the neutral network onto are negligible, the fitnesses of sequences outside only influence the total proportion of individuals on the network, but not the average fitness in the population.
Equation (4) shows that the population neutrality can be inferred from the average fitness and other parameters—such as, mutation rate. However, as we will now show, the population neutrality can also be obtained independently, from knowledge of the topology of alone.
The asymptotic equilibrium proportions of the population at network nodes are the solutions of the simultaneous equations:
| (5) |
where is the set of neighbors of that are also on the network . Using Eq. (4), Eq. (5) can be rewritten as:
| (6) |
where is the adjacency matrix of the graph :
| (7) |
Since is nonnegative and the neutral network is connected, the adjacency matrix is irreducible. Therefore, the theorems of Frobenius-Perron for nonnegative irreducible matrices apply[12]. These imply that the proportions of the limit distribution on the network are given by the principal eigenvector of the graph adjacency matrix . Moreover, the population neutrality is equal to ’s spectral radius : . In this way, one concludes that asymptotically the population neutrality is independent of evolutionary parameters (, , ) and of the fitness values of the genotypes off the neutral network. It is a function only of the neutral network topology as determined by the adjacency matrix .
This fortunate circumstance allows us to consider several practical consequences. Note that knowledge of , , and allows one to infer a dominant feature of ’s topology, namely, the spectral radius of its adjacency matrix. In in vitro evolution experiments in which biomolecules are evolved (say) to bind a particular ligand [30], by measuring the proportion of functional molecules that remain functional after mutation, we can now infer the spectral radius of their neutral network. In other situations, such as in the bacterial evolution experiments of Ref. [8], it might be more natural to measure the average fitness of an evolving population and then use Eq. (4) to infer the population neutrality of viable genotypes in sequence space.
B Blind and Myopic Random Neutral Walks
In the foregoing we solved for the asymptotic average neutrality of an infinite population under selection and mutation dynamics and showed that it was uniquely determined by the topology of the neutral network . To put this result in perspective, we now compare the population neutrality with the effective neutralities observed under two different kinds of random walk over . The results illustrate informative extremes of how network topology determines the population dynamics on neutral networks.
The first kind of random walk that we consider is generally referred to as a blind ant random walk. An ant starts out on a randomly chosen node of . Each time step it chooses one of its neighbors at random. If the chosen neighbor is on , the ant steps to this node, otherwise it remains at the current node for another time step. It is easy to show that this random walk asymptotically spends equal amounts of time at all of ’s nodes [17]. Therefore, the network neutrality of the nodes visited under this type of random walk is simply given by:
| (8) |
It is instructive to compare this with the effective neutrality observed under another random walk, called the myopic ant. An ant again starts at a random node . Each time step, the ant determines the set of network neighbors of and then steps to one at random. Under this random walk, the asymptotic proportion of time spent at node is proportional to the node degree [17]. It turns out that the myopic neutrality seen by this ant can be expressed in terms of the mean and variance of node degrees over :
| (9) |
The network and myopic neutralities, and , are thus directly given in terms of local statistics of the distribution of vertex degrees, while the population neutrality is given by , the spectral radius of ’s adjacency matrix. The latter is an essentially global property of .
III Mutational Robustness
With these cases in mind, we now consider how different network topologies are reflected by these neutralities. In prototype models of populations evolving on neutral networks, the networks are often assumed to be or are approximated as regular graphs [11, 27, 28, 31, 32]. If the graph is, in fact, regular, each node has the same degree and, obviously, one has .
In more realistic neutral networks, one expects ’s neutralities to vary over the network. When this occurs, the population neutrality is typically larger than the network neutrality: . This difference quantifies precisely the extent to which a population seeks out the most connected areas of the neutral network. Thus, a population will evolve a mutational robustness that is larger than if the population were to spread uniformly over the neutral network. Additionally, the mutational robustness tends to increase during the transient phase in which the population relaxes towards the its asymptotic distribution.
Assume, for instance, that initially the population is located entirely off the neutral network at lower fitness sequences. At some time, a genotype is discovered by the population. To a rough approximation, one can assume that the probability of a genotype being discovered first is proportional to the number of neighbors, , that has off the neutral network. Therefore, the population neutrality when the population first enters the neutral network is approximately given by:
| (10) |
Therefore, we define the excess robustness to be the relative increase in neutrality between the initial neutrality and (asymptotic) population neutrality:
| (11) |
For networks that are sparse, i.e. , this is well approximated by . Note that, while is defined in terms population statistics, the preceding results have shown that this robustness is only a function of ’s topology and should thus be considered a property of the network.
IV Finite-Population Effects
Our analysis of the population distribution on the neutral network assumed an infinite population. For finite populations, it is well known that sampling fluctuations converge a population and this raises a question: To what extent does the asymptotic distribution still describe the distribution over the network for small populations? As a finite population diffuses over a neutral network [19], one might hope that the time average of the distribution over is still given by . Indeed, the simulation results shown below indicate that for moderately large population sizes, this seems to be the case. However, a simple argument shows that this cannot be true for arbitrarily small populations.
Assume that the population size is so small that the product of mutation rate and population size is much smaller than ; i.e. . In this limit the population will, at any point in time, be completely converged onto a single genotype on the neutral network . With probability a single mutant will be produced at each generation. This mutant is equally likely to be one of the neighbors of . If this mutant is not on , it will quickly disappear due to selection. However, if the mutant is on the neutral network, there is a probability that it will take over the population. When this happens, the population will effectively have taken a random-walk step on the network, of exactly the kind followed by the blind ant. Therefore, for , the population neutrality will be equal to the network neutrality: . In this regime, and excess mutational robustness will not emerge through evolution.
The extent to which the initial population neutrality approaches is determined by the extent to which evolution on is dominated by sampling fluctuations. In neutral evolution, population convergence is generally only a function of the product [5, 23, 36]. Thus, as the product ranges from values much smaller than to values much larger than , we predict that the population neutrality shifts from the network neutrality to the infinite-population neutrality, given by ’s spectral radius .
V RNA Evolution on Structurally Neutral Networks
The evolution of RNA molecules in a simulated flow reactor provides an excellent arena in which to test the theoretical predictions of evolved mutational robustness. The replication rates (fitnesses) were chosen to be a function only of the secondary structures of the RNA molecules. The secondary structure of RNA is an essential aspect of its phenotype, as documented by its conservation in evolution [15] and the convergent in vitro evolution toward a similar secondary structure when selecting for a specific function [7]. RNA secondary structure prediction based on free energy minimization is a standard tool in experimental biology and has been shown to be reliable, especially when the minimum free energy structure is thermodynamically well defined [20]. RNA secondary structures were determined with the Vienna Package [16], which uses the free energies from [34]. Free energies of dangling ends were set to .
The neutral network on which the population evolves consists of all RNA molecules of length that fold into a particular target structure. A target structure (Fig. 1) was selected that contains sufficient variation in its neutrality to test the theory, yet is not so large as to preclude an exhaustive analysis of its neutral network topology.

Using only single point mutations per replication, purine-pyrimidine base pairs {G-C, G-U, A-U} can mutate into each other, but not into pyrimidine-purine {C-G, U-G, U-A} base pairs. The target structure contains base pairs which can each be taken from one or the other of these two sets. Thus, the approximately sequences that are consistent with the target’s base pairs separate into disjoint sets. Of these, we analyzed the set in which all base pairs were of the purine-pyrimidine type and found that it contained two neutral networks of and sequences that fold into the target structure. Simulations were performed on the largest of the two. The exhaustive enumeration of this network showed that it had a network neutrality of with standard deviation , a maximum neutrality of , and a minimum of . The spectral radius of the network’s adjacency matrix was . The theory predicts that, when , the population neutrality should converge to this value.
The simulated flow reactor contained a population of replicating and mutating RNA sequences [6, 9]. The replication rate of a molecule depends on whether its calculated minimum free energy structure equals that of the target: Sequences that fold into the target structure replicate on average once per time unit, while all other sequences replicate once per time units on average. During replication the progeny of a sequence has probability of a single point mutation. Selection pressure in the flow reactor is induced by an adaptive dilution flow that keeps the total RNA population fluctuating around a constant capacity .
Evolution was seeded from various starting sequences with either a relatively high or a relatively low neutrality. Independent of the starting point, the population neutrality converges to the predicted value, as shown in Fig. 2.
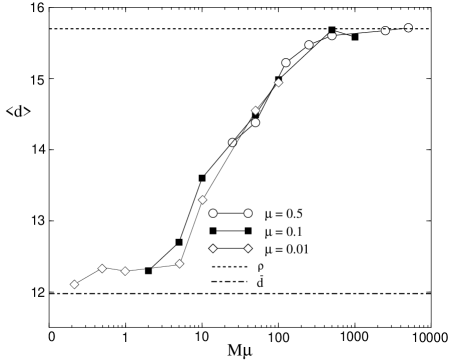
Subsequently, we tested the finite-population effects on the population’s average neutrality at several different mutation rates. Figure 3 shows the dependence of the asymptotic average population neutrality on population size and mutation rate . As expected, the population neutrality depends only on the product of population size and mutation rate. For small the population neutrality increases with increasing , until where it saturates at the predicted value of . Since small populations do not form a stationary distribution over the neutral net, but diffuse over it [19], the average population neutrality at each generation may fluctuate considerably for small populations. Theoretically, sampling fluctuations in the proportions of individuals at different nodes of the network scale inversely proportional to the square root of the population size. We therefore expect the fluctuations in population neutrality to scale as the inverse square root of the population size as well. This was indeed observed in our simulations.

Finally, the fact that for this neutral network shows that under selection and mutation, a population will evolve a mutational robustness that is percent higher than if it were to spread randomly over the network.
VI Conclusions
We have shown that, under neutral evolution, a population does not move over a neutral network in an entirely random fashion, but tends to concentrate at highly connected parts of the network, resulting in phenotypes that are relatively robust against mutations. Moreover, the average number of point mutations that leave the phenotype unaltered is given by the spectral radius of the neutral network’s adjacency matrix. Thus, our theory provides an analytical foundation for the intuitive notion that evolution selects genotypes that are mutationally robust.
Perhaps surprisingly, the tendency to evolve toward highly connected parts of the network is independent of evolutionary parameters—such as, mutation rate, selection advantage, and population size (as long as )—and is solely determined by the network’s topology. One consequence is that one can infer properties of the neutral network’s topology from simple population statistics.
Simulations with neutral networks of RNA secondary structures confirm the theoretical results and show that even for moderate population sizes, the population neutrality converges to the infinite-population prediction. Typical sizes of in vitro populations are such that the data obtained from experiments are expected to accord with the infinite-population results derived here. It seems possible then to devise in vitro experiments that, using the results outlined above, would allow one to obtain information about the topological structure of neutral networks of biomolecules with similar functionality.
We will present the extension of our theory to cases with multiple-mutation events per reproduction elsewhere. We will also report on analytical results for a variety of network topologies that we have studied.
Finally, here we focused only on the asymptotic distribution of the population on the neutral network. But how did the population attain this equilibrium? The transient relaxation dynamics, such as that shown in Fig. 2, can be analyzed in terms of the nonprincipal eigenvectors and eigenvalues of the adjacency matrix . Since the topology of a graph is almost entirely determined by the eigensystem of its adjacency matrix, one should in principle be able to infer the complete structure of the neutral network from accurate measurements of the transient population dynamics.
Acknowledgments We thank the participants of the Santa Fe Institute workshop on Evolutionary Dynamics for stimulating this work, which was supported in part at SFI by NSF under grant IRI-9705830, Sandia National Laboratory, and the Keck Foundation. M.H. gratefully acknowledges support from a fellowship of the Royal Netherlands Academy of Arts and Sciences.
REFERENCES
- [1] A. Babajide, I. L. Hofacker, M. J. Sippl, and P. F. Stadler. Neutral networks in protein space: A computational study based on knowledge-based potentials of mean force. Folding Design, 2:261–269, 1997.
- [2] L. Barnett. Tangled webs: Evolutionary dynamics on fitness landscapes with neutrality. Master’s thesis, School of Cognitive Sciences, University of East Sussex, Brighton, 1997. http://www.cogs.susx.ac.uk/ lab/adapt/nnbib.html.
- [3] U. Bastolla, H. E. Roman, and M. Vendruscolo. Neutral evolution of model proteins: Diffusion in sequence space and overdispersion. Technical report, LANL preprint archive: cond-mat/9811267, 1998.
- [4] J. P. Crutchfield and M. Mitchell. The evolution of emergent computation. Proc. Natl. Acad. Sci. U.S.A., 92:10742–10746, 1995.
- [5] B. Derrida and L. Peliti. Evolution in a flat fitness landscape. Bull. Math. Bio., 53(3):355–382, 1991.
- [6] M. Eigen. Self-organization of matter and the evolution of biological macromolecules. Naturwissen., 58:465–523, 1971.
- [7] E. H. Ekland and D. P. Bartel. RNA-catalysed RNA polymerization using nucleoside triphosphates. Nature, 383:192, 1996.
- [8] S. F. Elena, V. S. Cooper, and R. E. Lenski. Punctuated evolution caused by selection of rare beneficial mutations. Science, 272:1802–1804, 1996.
- [9] W. Fontana, W. Schnabl, and P. Schuster. Physical aspects of evolutionary optimization and adaptation. Phys. Rev. A, 40:3301–3321, 1989.
- [10] W. Fontana, P. F. Stadler, E. G. Bornberg-Bauer, T. Griesmacher, I. L. Hofacker, M. Tacker, P. Tarazona, E. D. Weinberger, and P. Schuster. RNA folding and combinatory landscapes. Phys. Rev. E, 47:2083–2099, 1992.
- [11] C. V. Forst, C. Reidys, and J. Weber. Evolutionary dynamics and optimizations: Neutral networks as model landscapes for RNA secondary-structure folding landscape. In F. Moran, A. Moreno, J. Merelo, and P. Chacon, editors, Advances in Artificial Life, volume 929 of Lecture Notes in Artificial Intelligence. Springer, 1995. SFI preprint 95-20-094.
- [12] F. R. Gantmacher. Applications of the theory of matrices. Interscience Publishers, New York, 1959.
- [13] S. Gavrilets and J. Gravner. Percolation on the fitness hypercube and the evolution of reproductive isolation. J. Theor. Biol., 184:51–64, 1997.
- [14] W. Grüner, R. Giegerich, D. Strothmann, C. Reidys, J. Weber, I. L. Hofacker, P. F. Stadler, and P. Schuster. Analysis of RNA sequence structure maps by exhaustive enumeration: I. neutral networks; II. structure of neutral networks and shape space covering. Monatsh. Chem., 127:355–389, 1996.
- [15] R. Gutell, A. Power, G. Z. Hertz, E. J. Putz, and G. D. Stormo. Identifying constraints on the higher-order structure of RNA: Continued development and application of comparative sequence analysis methods. Nucleic Acids Res., 20:5785–5795, 1993.
- [16] I. L. Hofacker, W. Fontana, P. F. Stadler, S. Bonhoeffer, M. Tacker, and P. Schuster. Fast folding and comparison of RNA secondary structures. Monatsh. Chem., 125(2):167–188, 1994.
- [17] B. D. Hughes. Random Walks and Random Environments, volume II, chapter 7. Clarendon Press, Oxford, 1996.
- [18] M. Huynen, T. Doerks, F. Eisenhaber, C. Orengo, S. Sunyaev, Y. Yuan, and P. Bork. Homology-based fold predictions for Mycoplasma genitalium proteins. J. Mol. Biol., 280:323–326, 1998.
- [19] M. Huynen, P. F. Stadler, and W. Fontana. Smoothness within ruggedness: The role of neutrality in adaptation. Proc. Natl. Acad. Sci. USA, 93:397–401, 1996.
- [20] M. A. Huynen, R. Gutell, and D. Konings. Assessing the reliability of RNA folding using statistical mechanics. J. Mol. Biol., 267:1104–12, 1997.
- [21] M. A. Huynen and P. Hogeweg. Pattern generation in molecular evolution: Exploitation of the variation in RNA landscapes. J. Mol. Evol., 39:71–79, 1994.
- [22] M. A. Huynen, D. Konings, and P. Hogeweg. Multiple coding and the evolutionary properties of RNA secondary structure. J. Theor. Biol., 165:251–267, 1993.
- [23] M. Kimura. Diffusion models in population genetics. J. Appl. Prob., 1:177–232, 1964.
- [24] M. Kimura. The neutral theory of molecular evolution. Cambridge University Press, 1983.
- [25] L. F. Landweber and I. D. Pokrovskaya. Emergence of a dual-catalytic RNA with metal-specific cleavage and ligase activities: The spandrels of RNA evolution. Proc. Natl. Acad. Sci. USA, 96:173–178, 1999.
- [26] C. Reidys and S. Fraser. Evolution on random structures. Technical Report 95-11-087, Santa Fe Institute, 1995.
- [27] C. M. Reidys. Neutral networks of RNA secondary structures. PhD thesis, Mathematics Faculty. Friedrich Schiller Universität Jena., 1995.
- [28] C. M. Reidys, P. F. Stadler, and P. Schuster. Generic properties of combinatory maps—Neutral networks of RNA secondary structures. Bull. Math. Biol., 59:339–397, 1997.
- [29] P. Schuster, W. Fontana, P. F. Stadler, and I. Hofacker. From sequences to shapes and back: A case study in RNA secondary structures. Proc. Roy. Soc. (London) B, 255:279–284, 1994.
- [30] C. Türk. Using the SELEX combinatorial chemistry process to find high affinity nucleic acid ligands to target molecules. Methods Mol. Biol., 67:219–230, 1997.
- [31] E. van Nimwegen, J. P. Crutchfield, and M. Mitchell. Finite populations induce metastability in evolutionary search. Phys. Lett. A, 229:144–150, 1997.
- [32] E. van Nimwegen, J. P. Crutchfield, and M. Mitchell. Statistical dynamics of the Royal Road genetic algorithm. Theoretical Computer Science, special issue on Evolutionary Computation, A. Eiben, G. Rudolph, editors, in press, 1998. SFI working paper 97-04-35.
- [33] A. Wagner and P. F. Stadler. Viral RNA and evolved mutational robustness. Technical Report 99-02-010, Santa Fe Institute, 1999.
- [34] A. E. Walter, D. H. Turner, J. Kim, M. H. Lyttle, P. Muller, D. H. Mathews, and M. Zuker. Coaxial stacking of helixes enhances binding of oligoribonucleotides and improves predictions of RNA folding. Proc. Natl. Acad. Sci. USA, 91:9218–9222, 1994.
- [35] M. C. Wright and G. F. Joyce. Continuous in vitro evolution of catalytic function. Science, 276:614–617, 1997.
- [36] S. Wright. Evolution in Mendelian populations. Genetics, 16:97–159, 1931.