Search for an unitary mortality law through a theoretical model
for biological ageing
Abstract
In this work we check the occurrence of the Azbel assumption of mortality within the framework of a bit string model for biological ageing. We reproduced the observed feature of linear correspondence between the fitting parameters of the death rate as obtained by Azbel with demographic data.
Keywords: biological ageing, mutation accumulation, bit string model, Gompertz law
1 Introduction
Since the pioneer work of Gompertz of 1825 on the exponential increase of mortality with human age, there have been various attempts to quantify this relation between mortality rate and the ageing process. But there is no consensus on whether genetically programmed death exists or not. Some recent works raise questions about the existence of a single mortality pattern, also discussing whether senescence can be characterized by the increase of mortality with age. This features have been detected in the analysis of medflies, where the mortality rate of the oldest medflies decreased with age [1], and in drosophilas, where it levels off [2] [3]. There are also some questions about the existence of an absolute life expectancy for particular species.
Recently, Azbel [4] proposed an unitary mortality law for species based on the analysis of demographic and medfly data. His assertion is that this result is due only to genetic features. Based on this, we try to verify if this assumption supported by the mutation accumulation theory of biological ageing, simulated on the computer with the bit string model [5].
The bit string model has been successfully applied in many ageing problems, like the death rate of German population [6], catastrophic senescence of pacific salmon [7], vanishing of northern codfish [8], longevity of trees [9], advantages of sexual reproduction [10] [11] and others which reinforce the mutation accumulation theory.
This paper is organized as follows: in section we review the Azbel proposal [4] and the different results found for homogeneous and heterogeneous populations. In section we review the bit string model and discuss the meaning of homogeneous and heterogeneous populations in this computer model. Finally, in section we present the results and discussions.
2 The Azbel proposal
In a recent paper, Azbel [4] proposed the existence of a mortality law that could successfully explain the behaviour of different death rates like human and medfly mortality curves, like the German death rate shown in fig.. His basic assumption is the existence of at least one Gompertz region in the death rate, which means that it must exist some region in the mortality curve where the behaviour is predominantly exponential.
The mortality in a certain age at time is
| (1) |
where is the number of individuals alive with age at time . Considering time as a continuous variable, we have
| (2) |
Assuming that is an exponential function of time and integrating the above equation from to we get the better definition of mortality rate:
| (3) |
We can also write , where is the number of deaths in time with age , and obtain
| (4) |
Following the assertion that every death rate has its Gompertz region, where the logarithm of mortality rate is close to its linear regression
| (5) |
Fitting the mortality curves of demographic data, Azbel determined the values of and . In fact, Azbel worked with the dimensionless death rate
| (6) |
with . From each mortality curve it is obtained a pair and by extensive study of demographic data of Japanese and Sweden population (which have low premature mortality), Azbel showed that the points determined by and follow a straight line and so can be related by . With this we can write the death rate as
| (7) |
The striking feature is the behaviour of the parameters with respect to distinct populations (at different times): Japanese (1891-1990), Swedish (1970-1991) and German (1987) lifetables, the fittings give years, . Fifty abridged Swedish (1780-1900) lifetables yield year, ; 62 abridged world-wide lifetables provide ; , and all data combined (for a few billion males and females in different countries with reliable statistics, over the period of two centuries) yield almost the same age and number . With all this data, Azbel proposes that as and are the same within one species, they must be genetic factors. Since for these developed countries there is low premature mortality, we can say that the mortality in these countries is due principally to genetic factors. Equation (7) is valid for sufficiently homogeneous cohorts, which means individuals with the same genetic factors that will affect their life history. Homogeneous populations have smooth death rates, since the life history of the individuals in normal situations is almost the same. When the population is heterogeneous, then some features might change like the appearance of arbitrarily old Methuselah’s ( it has been observed that under the worst conditions, 30 of 3 million female medflies should survive a year, 18.6 times their life expectancy at birth [1]) and the linear increase of maximal lifespan with the initial population. Heterogeneous populations, as studied by Carey et al [1] with medflies, indicate the lack of exponential behaviour with
| (8) |
for sufficiently beyond , where and are constants. If heterogeneity is sufficiently high to allow , in eq() the main contribution to the region of old ages of the death rate will come from individuals with smallest b.
3 The Bit-String Model and
Computer Simulations
In the bit-string model [5], the age-dependent effects of ageing described by an evolutionary theory [12] are taken into account by assigning to each individual in the population a computer word (string) of , in our case, 128 bits, which should be interpreted as a transcription of the genetic code. Each bit of the word will represent the activity of the ageing process in that age. The ages in which the deleterious mutations will affect the individual will have their bits in the computer word set to one, while the others are all zero . After an age the individual is mature and can reproduce (in this case, asexually) generating offspring, or one child with probability if . It is known that the transcription of th e genetic code from parent to child is not perfect, and that the errors in the transcription accumulate. These errors can be deleterious or even good to the individual, but the rate of deleterious mutations is much higher then the rate of the good ones. I n the bit string model , when an individual reproduces, its offspring will have the same genetic code of its parent, except for new mutations randomly disposed on the string at the moment of birth. At the age that the number of mutations in the gene tic code exceeds a certain threshold , the individual dies. Limitations of food and space are introduced into the model through a logistic factor, known as Verhulst factor. This allow us to control the population size, which is of vital importance to do the computer simulations. After all individuals of the population have been tested, we count one time step (in this paper, one time step corresponds to one year).
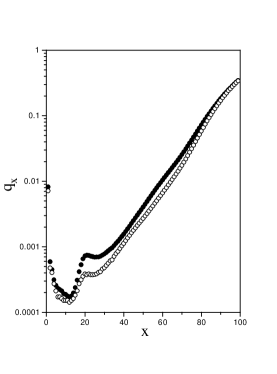
Even though we have a Verhulst factor to control the population size, we will count in the simulations the deaths due only to genetic causes (fig.) .

Starting from a random population (i.e., individuals with different genetic code) of 10000 individuals, we wait a transient period until the size of population reaches an equilibrium state and collect the informations of the system. Setting all individuals of the population with the same intrinsic parameters guarantees us sufficiently homogeneous cohorts when equilibrium (steady state) is reached and prevents us from getting extremely fluctuating death rates due to the variability of the lifespan introduced by varying the parameters (see [5] - [9]).
In order to calculate the death rate of an homogeneous population, shown in fig.2, we took the last 10000 steps of a total of 100000 (150000 for mutation rates ) [6].
4 Results and discussions
We performed several tests controlling the parameters of the bit-string model, first we just varied the seed for the random number sequence with all the other parameters fixed. With this, we generate initial populations with different genetic code, which allow us to obtain different mortality curves. These random numbers also control which individual will die under the pressure of the Verhulst factor. With this, we try to reproduce the same species in different situations, as human population in different countries. When can also calculate the death rate at different time steps of a single simulation, as did Azbel for demographic data.
With minimum reproduction age all fittings of the Gompertz region were made for ages , and for each fitting we store the pair. Plotting this pair in a linear scale we get the same qualitative result presented by Azbel, as seen in figure . Also, it can be observed that different mutation rates give us different straight lines of the pair , thus giving a suggestion of different species in the bit-string model (fig.).
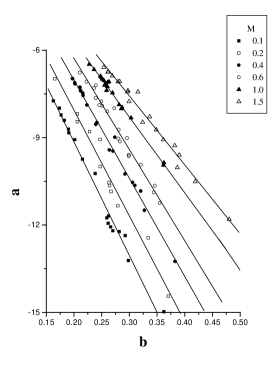
Observing the behaviour of the linear fittings obtained for different mutation rates in the simulation and using the relation between and obtained in the figure , we can make an extrapolation of the results obtained by Azbel in order to have an idea of how low have to be the mutation rate of the genetic code of human species. In order to have years [4] we have , which is in agreement with the mutation rate proposed to fit the female mortality in Germany [6]. In order to describe effects like premature mortality it is necessary to define other genetic factors in the model, which is out of the scope of this work.
Analyzing the behaviour of the parameters involved on the phenomenological law we can see that the characteristic age increases with decreasing mutation rate (fig.), and that increases with increasing (fig.). We can observe at the simulations that the characteristic age, , is not the maximum lifespan, as already concluded in ref. [4]. We can also check from our simulations that it is smaller than the maximum lifespan.


With the parameters of the problem established, we can get back to the figure , where we have already plotted the death rate obtained from the simulations and the respective theoretical mortality law (line) obtained from eq.
In the treatment of heterogeneous populations we have to interpret first what is heterogeneity in the bit-string model. When we start the simulations we give different genotypes to the individuals, and these individuals compete with themselves and only the individuals with best genotypes survive and form the population of the steady state. More precisely, the genotypes disappear as a power law in time [13]. These out of equilibrium properties have already been proposed as an explanation of the oldest old effect in drosophilas [3]. Our proposal is that the heterogeneity should be essentially an out-of-equilibrium state, where individuals with very different characteristics coexist. The degree of heterogeneity is related with the distance from the equilibrium state, so in order to study heterogeneous populations we study the properties of the model far from equilibrium. In that region, as shown in figure , is evident the non-exponential behaviour of the distribution of the individuals with age, as in ref [1].

In summary, by simulating the bit-string model we succeeded in reproducing the behaviour of the death rate parameters of both demographic and medfly data reinforcing the mutation accumulation theory of biological ageing and the reliability of the bit-string model.
5 Acknowledgments
We thank D.Stauffer for fruitful discussions and suggestions, and M.Azbel for providing copies of his work prior to publication. This work is partially supported by Brazilian agencies CNPq and CAPES.
References
- [1] J.R.Carey, P.Liedo, D.Orozco, and J.W.Vaupel, Science 258, 457 (1992).
- [2] J.R.Carey, J.W.Curtsinger, and J.W.Vaupel, Science 260, 1665 (1993).
- [3] K.A.Hughes and B.Charlesworth, Nature 367, 64 (jan.1994).
-
[4]
M.Ya.Azbel, Proc. Royal Soc. of London B 263, 1449
(1996).
M.Ya.Azbel, Phys.Repts. 288, in press.
M.Ya.Azbel, Physica A, in press. - [5] T.J.P.Penna, J.Stat.Phys. 78 1629 (1995).
- [6] T.J.P.Penna and D.Stauffer, Zeits.Phys. B101 469 (1996).
- [7] T.J.P.Penna, S.Moss de Oliveira and D.Stauffer, Phys.Rev.E, 52, R3309 (1995). T.J.P.Penna and S.Moss de Oliveira, J.Physique (France) I5, 1697 (1995).
- [8] S.Moss de Oliveira,T.J.P.Penna and D.Stauffer, Physica A 215, 1619 (1995).
- [9] M. Argollo de Menezes, A. Racco and T.J.P. Penna, Physica A 233 (1996) 221.
- [10] D.Stauffer, P.M.C de Oliveira, S.Moss de Oliveira and R.M.Zorzenon dos Santos, Physica A 231, 504 (1996).
- [11] T.J.P.Penna and D.Wolf, Theory in Biosciences (1997).
- [12] L.Partridge and N.H.Barton, Nature (London) 362, 305 (1993).
- [13] Y.C. Zhang, M. Serva and M. Polykarpov, J.Stat.Phys. 58, 849 (1990). P.M.C.de Oliveira, S.Moss de Oliveira and D.Stauffer, Theory in Biosciences 113, 65 (1997).