3D Radiative MHD Modeling of Particle Beam Heating of the Solar Atmosphere
Abstract
While solar flares are primarily associated with enhanced ultraviolet and X-ray emission, a subset of flares exhibit significant continuum brightening in visible light and are classified as white-light flares (WLFs). Despite extensive observational and modeling efforts, the physical mechanisms responsible for the compact, short-lived photospheric brightenings in WLF kernels observed during the impulsive phase of solar flares remain uncertain. Thick-target electron-beam models typically deposit energy in the upper chromosphere, and their ability to reproduce the magnitude and spatial localization of photospheric continuum enhancements observed in white-light flare kernels remains an open question. To investigate the role of realistic atmospheric structuring and multidimensional transport in flare energy deposition, we perform three-dimensional radiative MHD simulations of electron-beam heating using the StellarBox code for beam fluxes of erg s-1 cm-2 and low-energy cutoffs of 10–25 keV. We then compute Fe I 6173 Å Stokes profiles using the RH 1.5D radiative transfer code for direct comparison with Helioseismic and Magnetic Imager (HMI) observations. The simulations produce strong upper-chromospheric heating, multiple shock fronts, and continuum enhancements up to a factor of 2.5 relative to pre-flare levels, comparable to continuum enhancements observed during strong X-class white-light flares. Comparison with one-dimensional RADYN simulations highlights the influence of fine-scale structuring on flare dynamics and continuum emission that arises in three-dimensional geometry.
I Introduction
Solar flares release large amounts of energy, observed across the electromagnetic spectrum. While flare radiation is most pronounced in X-ray and ultraviolet bands, a subset of flares produce distinct increases in visible continuum intensity and are known as white-light flares (WLFs). The compact, short-lived bright kernels of WLFs are understood to trace energy deposition in the low chromosphere and upper photosphere, regions that are typically not expected to be strongly heated by traditional thick-target models, in which electron-beam energy is predominantly deposited in the lower corona and upper chromosphere. Observations of the Helioseismic and Magnetic Imager (HMI) onboard the Solar Dynamics Observatory (SDO) (Scherrer et al., 2012) that show Fe I 6173 Å line core emission (Kosovichev et al., 2023) together with helioseismic signatures (sunquakes) provide direct evidence for impulsive impacts at photospheric depths and motivate detailed modeling that couples particle transport, radiative transfer, and realistic magneto-convection.
In the standard thick-target framework (Brown, 1971; Hudson, 1972; Syrovatskii & Shmeleva, 1972), non-thermal electrons accelerated in the corona precipitate along magnetic field lines and dissipate their energy through Coulomb collisions in the upper chromosphere. Early hydrodynamic studies (Kostiuk & Pikelner, 1975; Livshits et al., 1981) demonstrated that this process drives a strong upward evaporation front and a downward-moving chromospheric condensation but leaves the deeper photosphere largely unaffected. The predicted heating is insufficient to account for the strong continuum brightenings, Fe I 6173 Å line core emission, and photospheric impulses inferred from helioseismic observations of sunquakes. Radiative back-warming of deeper layers (Machado et al., 1989) may enhance the continuum emission. Yet, even with this effect, conventional electron-beam models typically underestimate both the amplitude and duration of observed white-light kernels.
One-dimensional radiative-hydrodynamic (RHD) modeling using the RADYN code has provided essential insight into flare energy deposition and chromospheric response (Allred et al., 2005, 2015; Carlsson et al., 2023). In the F-CHROMA grid of RADYN flare models (Carlsson et al., 2023), a publicly available suite of 1D radiative hydrodynamic simulations spanning a wide range of electron-beam fluxes, spectral power-law indices, and low-energy cutoffs (), electron beams with fluxes of to erg s-1 cm-2, power-law indices of 3 to 5, and of 15-25 keV produce upper-chromospheric heating and modest continuum enhancements of a few percent. The energy deposition remains confined above about 1 Mm, and the transition region is represented by an abrupt rise from about K to K near z = 2 Mm. While these 1D simulations reproduce many chromospheric observables, they do not consistently reproduce the strong photospheric heating and Fe I 6173 Å emission observed by HMI during intense WLFs (Sadykov et al., 2020; Monson et al., 2021). Moreover, their smooth, semi-empirical initial atmospheres lack the fine magnetic and thermal structuring evident in flare footpoints, limiting their ability to model spatially localized energy deposition.
Recent work has expanded the RHD framework to include proton and mixed electron-proton beams as alternative energy carriers. Proton beams penetrate to greater column depths than electrons and can produce both white-light emission and helioseismic signatures. In particular, (Sadykov et al., 2024) presented a comprehensive suite of RADYN + Fokker-Planck simulations of proton-beam heating with from 25 keV to 3 MeV. They found that low to moderate energy proton beams ( 50–250 keV) can drive photospheric perturbations and acoustic transients comparable to observed sunquakes, while higher energy beams reproduce the continuum enhancements near the Fe I 6173 Å line seen in WLF kernels. These results demonstrate that deeply penetrating particles can, under certain conditions, reproduce observed photospheric and helioseismic responses that are difficult to obtain in simplified electron-beam models. Nevertheless, the models remain inherently one-dimensional and assume idealized magnetic-loop geometries, precluding investigation of multi-threaded or inclined-field effects.
Although these advances in one-dimensional RHD modeling have significantly improved our understanding of flare energy deposition, they also highlight key limitations that hinder direct comparison with high-resolution observations. In particular, the inherently stratified geometry of 1D models cannot capture the complex magneto-convective structure, lateral transport, and multi-threaded energy deposition that characterize real flare footpoints. The lack of realistic magnetic topology, fine-scale thermal structure, and multi-dimensional radiative coupling may substantially alter both the depth and efficiency of beam-driven heating. These considerations motivate extending flare-beam modeling to fully three-dimensional radiative-MHD environments, where the interplay involving particle transport, magnetic structuring, and hydrodynamic response can be studied self-consistently and compared directly with Fe I 6173 Å and continuum signatures observed by HMI.
In this study, we perform 3D StellarBox simulations of electron-beam heating using parameters consistent with the F-CHROMA RADYN grid: total flux erg s-1 cm-2, spectral index = 3, and = 10–25 keV and synthesize Fe I 6173 Å Stokes profiles using the RH 1.5D code (Rybicki & Hummer, 1991, 1992; Uitenbroek, 2001; Pereira & Uitenbroek, 2015) for direct comparison with HMI observations. By contrasting the three-dimensional StellarBox results with one-dimensional RADYN electron and proton models, we assess how magnetic and thermal structuring, multidimensional transport, and radiative coupling influence the atmospheric response to flare energy deposition. Our goal is to determine whether realistic 3D models can reproduce the depth and magnitude of photospheric heating implied by white-light and helioseismic observations and to identify the physical mechanisms responsible for the most energetic flare kernels.
II Observational Constraints
The Helioseismic and Magnetic Imager obtains narrow-band filtergrams at six wavelength positions across the Fe I 6173 Å line in multiple polarizations and produces full Stokes products on standard observing cadences (90 s for linear polarization sequences and 45 s for circular polarization). Because the measurement sequence samples the line at discrete filtergram positions over tens of seconds, rapid line shape changes during flares may be imperfectly sampled and must be interpreted with care. For the identification of line-core emission, we follow the core-to-wing (CtW) metric computed from filtergram channels by sampling 34 mÅ (core) and 170 mÅ (wing). Although CtW is sensitive to bandpass drifts and complex line shapes, it reliably locates instances where the line core brightens relative to the line wings. In Granovsky et al. (2025), several WLFs observed by HMI between 2016 and 2024 that exhibited brief instances of Fe I 6173 Å line-core emission were analyzed. These events are spatially compact and short-lived, typically localized to small kernels above sunspot umbrae or umbra/penumbra boundaries and typically last for only a single 90 s Stokes frame. The strongest example analyzed in Granovsky et al. (2025) was the SOL2017-09-06 X9.3 flare, which displayed multiple umbral emission kernels with CtW ratios approaching about 1.8 and local continuum increases by factors up to 4 in the emission kernels. In the analyzed events, line-core emission always coincides with peaks in hard X-ray and with local maxima in the time derivative of soft X-ray flux, and post-flare analysis often reveals lasting changes in the Stokes Q, U, and/or V profiles at the kernel locations, indicating permanent magnetic field reconfigurations. These observational characteristics constrain plausible heating mechanisms: models must reproduce short duration and small spatial extent, be temporally associated with particle precipitation proxies (e.g., hard X-ray emission), and, in some cases, deliver sufficient impulse to excite helioseismic waves.
III Numerical Methods
III.1 StellarBox Radiative MHD Simulations
The three-dimensional radiative MHD simulations were performed with the StellarBox code (Wray et al., 2015). Simulation domains extend vertically from z = -10 Mm (subsurface) to z = +15 Mm (corona) over a 24.2 24.2 Mm2 horizontal area using 1 s time steps. The computational grid consists of 400 points in x and y, with horizontal sampling near 60.7 km. The vertical grid consists of 400 points and varies in resolution; higher resolutions are used near z = 0 Mm with spacing in the range of 23.9–157.3 km. StellarBox solves the compressible MHD equations with realistic radiative transfer and includes magnetic field evolution and convective motions, producing time-dependent three-dimensional atmospheres (temperature, density, velocity, magnetic field) suitable for particle-beam injection and spectral synthesis. Two representative photospheric magnetic configurations were used. The first configuration, denoted B1, centers the beam over a granule with photospheric Bz 30 G. The second configuration, denoted B2, centers the beam over an intergranular lane with photospheric Bz 700 G. The B1 and B2 cases probe how local magneto-convection and field strength influence beam energy deposition and hydrodynamic response.
III.2 Particle-beam Implementation
Particle beams were imposed along the vertical (z) direction with a Gaussian profile with a half-width at half maximum (HWHM) of 500 km (FWHM = 1000 km, 425 km) and a symmetric triangular temporal profile of 20 s duration. The implementation of collisional energy deposition follows the classical thick-target formalism originally developed by Syrovatskii & Shmeleva (1972) and later extended by Livshits et al. (1981) for calculating the heating rate and ionization effects produced by non-thermal electrons penetrating the solar atmosphere. This formalism is incorporated into the StellarBox framework to compute the local energy-deposition profile and resulting thermal response.
A suite of electron beam simulation cases was carried out with a total energy flux density of erg s-1 cm-2 and a power-law spectral index = 3. values of 10, 15, 20, and 25 keV were chosen to examine the trade-offs between number flux (favoring lower ) and penetration depth (favoring higher ). The resulting heating rates were applied to the evolving 3D StellarBox atmosphere at each time step. Proton and mixed-species beams were not included in the present simulations but are planned for future work.
III.3 RH 1.5D Spectral Synthesis
For spectral diagnostics, the RH 1.5D radiative transfer code (Pereira & Uitenbroek, 2015) was used to synthesize Fe I 6173 Å line profiles from vertical columns extracted from the StellarBox atmospheres in a 3.7 3.7 Mm patch centered on the beam impact. RH 1.5D solves the non-local thermodynamic equilibrium (NLTE) radiative transfer problem per column, including Zeeman polarization, and computes Stokes I, Q, U, and V. Temperature, hydrogen populations, magnetic field, vertical velocity, and the height grid are taken or computed from the Stellarbox model output, and micro-turbulence was set to 0 m/s in order to isolate thermal and bulk velocity effects. The 1.5D approach for calculating the spectral line preserves column stratifications while neglecting fully three-dimensional radiative coupling.
IV Results
IV.1 Atmospheric Heating and Hydrodynamic Response
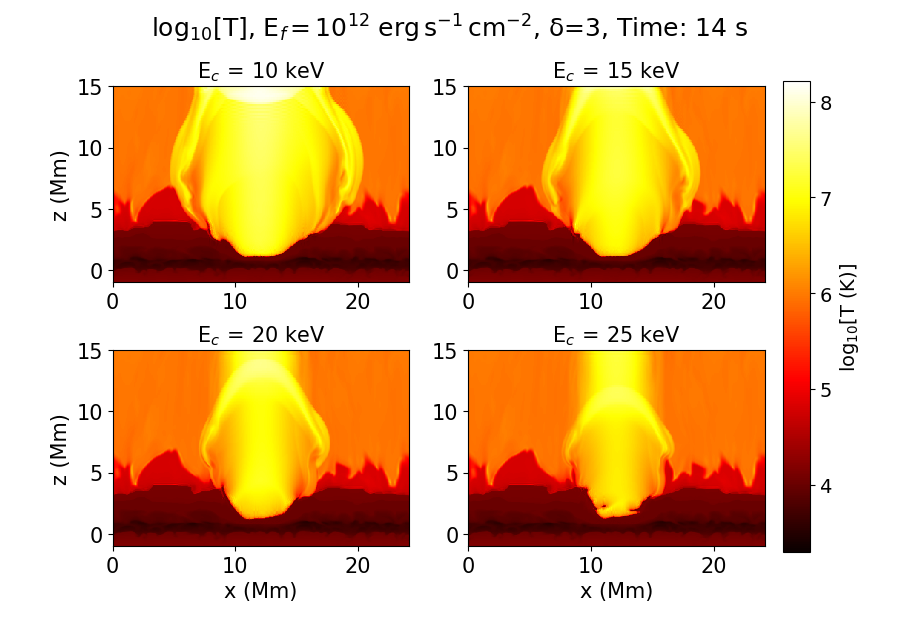
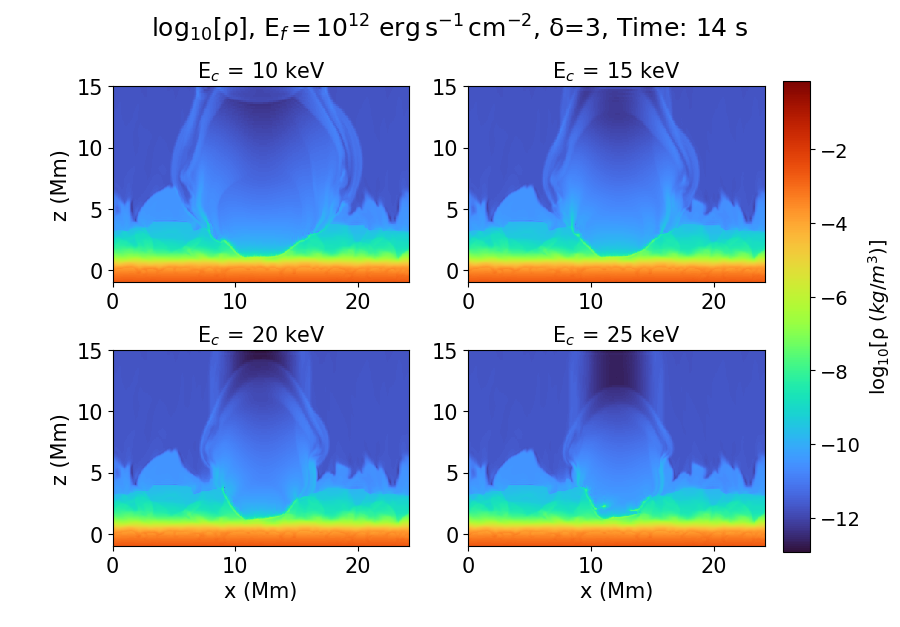
Across the electron-beam parameter set, heating remains concentrated in the upper chromosphere and above Mm in both magnetic configurations. Lower beams, with their larger number fluxes, deposit energy higher in the atmosphere and produce a more rapid hydrodynamic response, whereas higher beams penetrate to lower heights (smaller ) but yield weaker upper-chromospheric heating (see Figures 1 and 2).
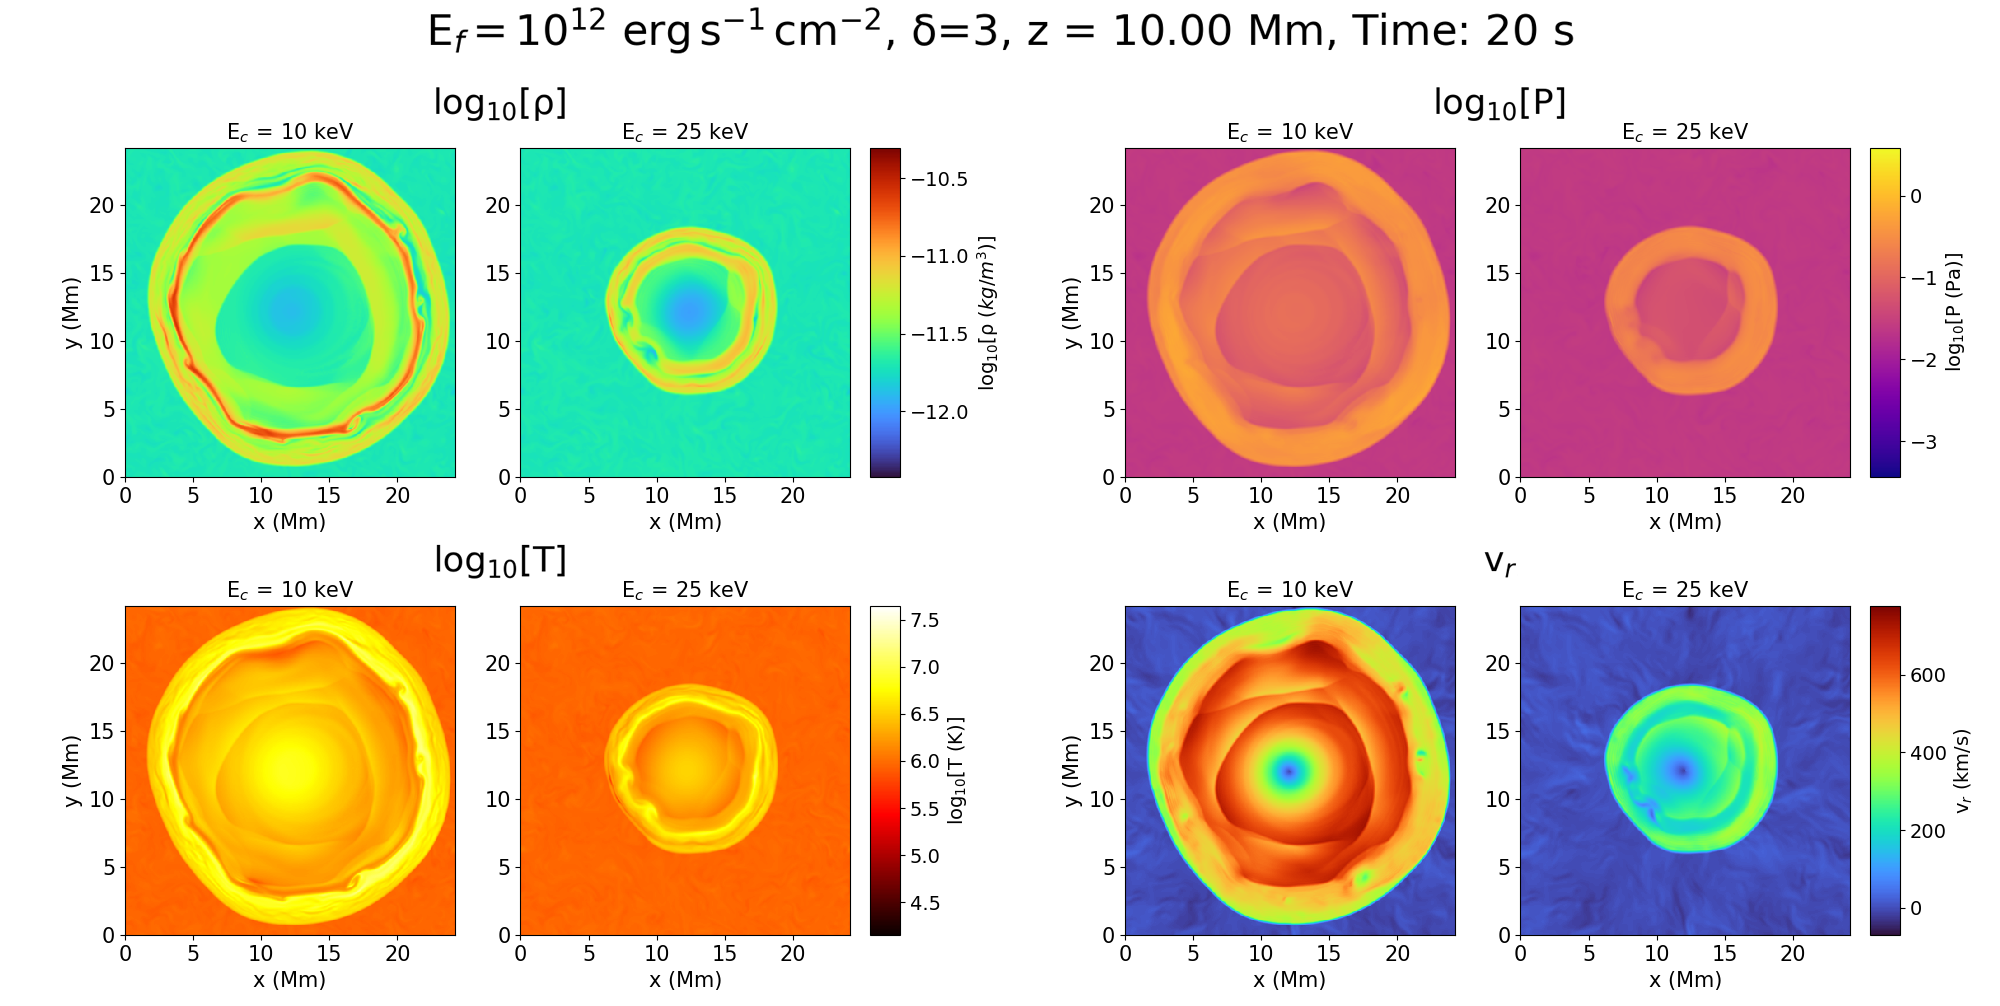
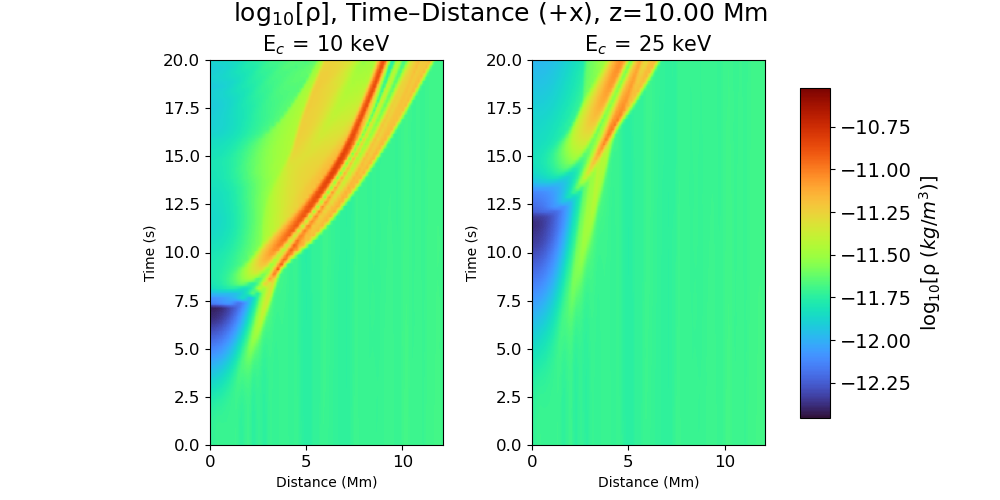
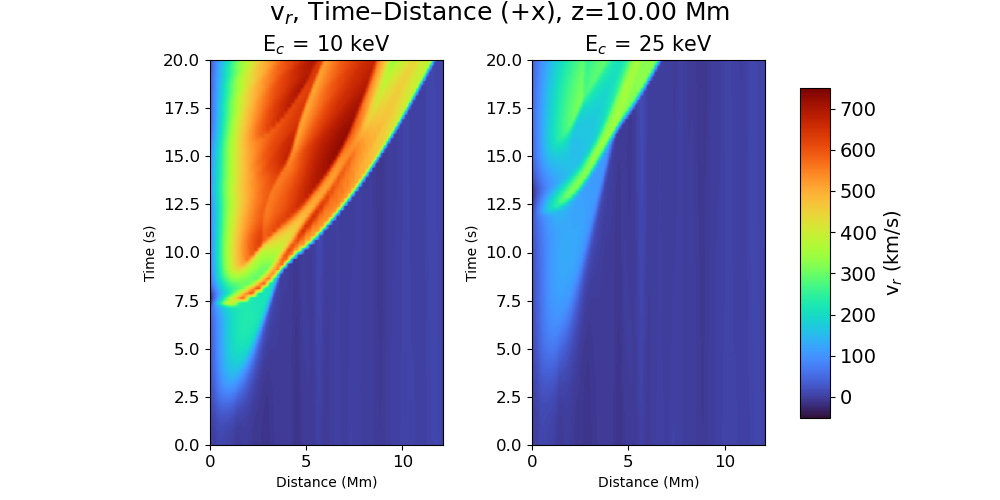
In the B1 simulation, the onset of beam heating generates a high-pressure disturbance visible within s of beam initiation. In the 10 keV case, this produces a prominent upward-propagating shock earliest, with the 15–25 keV models showing comparable fronts appearing progressively later ( 6–9 s). Multiple upward-moving compression fronts develop in the corona, three to four in the 10 keV run and two in the 25 keV run, readily identifiable in the radial-velocity and density signatures at Mm (Figures 3, 4, and 5). At this height, each model exhibits two sharp outer density rings and, in the 10 keV case, an additional, more diffuse inner ring. The 25 keV simulation shows two outer rings of similar density, while the 10 keV case displays a second ring of noticeably higher density than the first. In both models, the highest temperature and pressure occur between the first two rings. Time-distance diagrams of radial velocity show an initial weak shock (200 km/s in the 10 keV run; 100 km/s in the 25 keV run). A much stronger shock emerges later at 8 s in the 10 keV case (peak radial speeds 600–800 km/s) and at 13 s in the 25 keV case ( 300–400 km/s), propagating at 600–700 km/s. Subsequent inner shock fronts travel more slowly than the leading fronts but remain significantly faster than the initial weak disturbance.
These shocks originate from the rapid, localized overpressure created when the electron beam deposits energy impulsively in the upper chromosphere and lower corona. The resulting steep pressure gradients drive upward and lateral flows that steepen into shocks as they expand into progressively lower-density plasma. Because the local magnetic field in these models is weak in the chromosphere and corona ( 10 G), magnetic forces contribute little to the dynamics, and the disturbances behave primarily as hydrodynamic (acoustic or weakly magneto-acoustic) shocks rather than strongly magnetically guided waves.
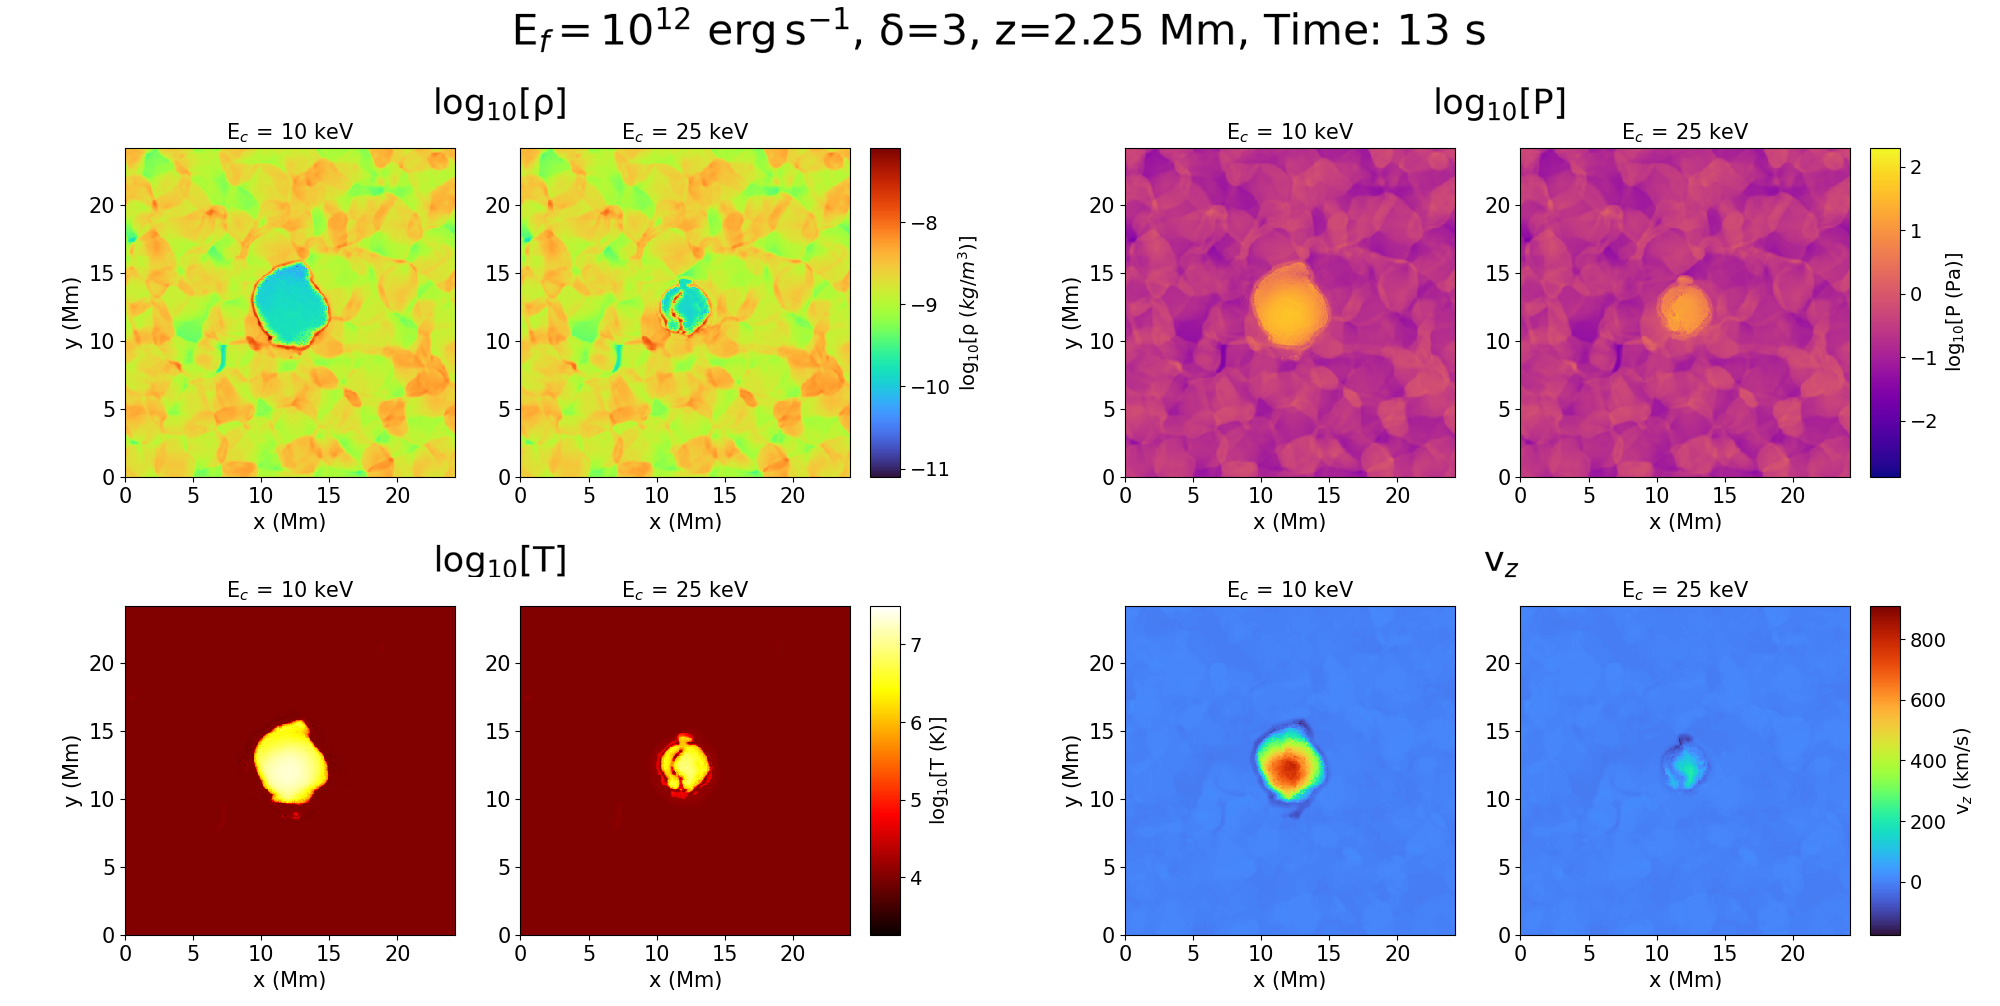
At chromospheric heights ( Mm), the hydrodynamic response exhibits strong lateral structuring (Figure 6). In the 25 keV case, chromospheric condensation becomes visible by 8 s, initially forming a curved, asymmetric condensation near beam center before spreading outward and fragmenting as heating continues. A secondary ring-like condensation forms around the beam perimeter between 10–15 s. In the 10 keV model, a weaker condensation is faintly visible along the beam perimeter between 6–10 s. In both models, beam heating produces a central region of reduced density surrounded by a denser annulus tracing the condensation front, accompanied by enhanced pressure near the beam core. Vertical velocities are upward in the central impact region (larger in the 10 keV model), while small downward velocities appear at the condensation sites along the perimeter.
In the 25 keV case, a compact “chromospheric bubble” forms beneath the primary heating site as a cool, dense pocket that expands laterally over time, consistent with the bubble-like structures described by Reid et al. (2020). The combination of chromospheric condensation, bubble formation, and multiple upward-propagating shocks reflects the complex interactions between rapid heating, pressure-gradient expansion, and modest magnetic structuring. Despite these highly dynamic effects, no model in the explored energy range produces significant heating below Mm.
IV.2 Comparison with F-CHROMA RADYN 1D Models
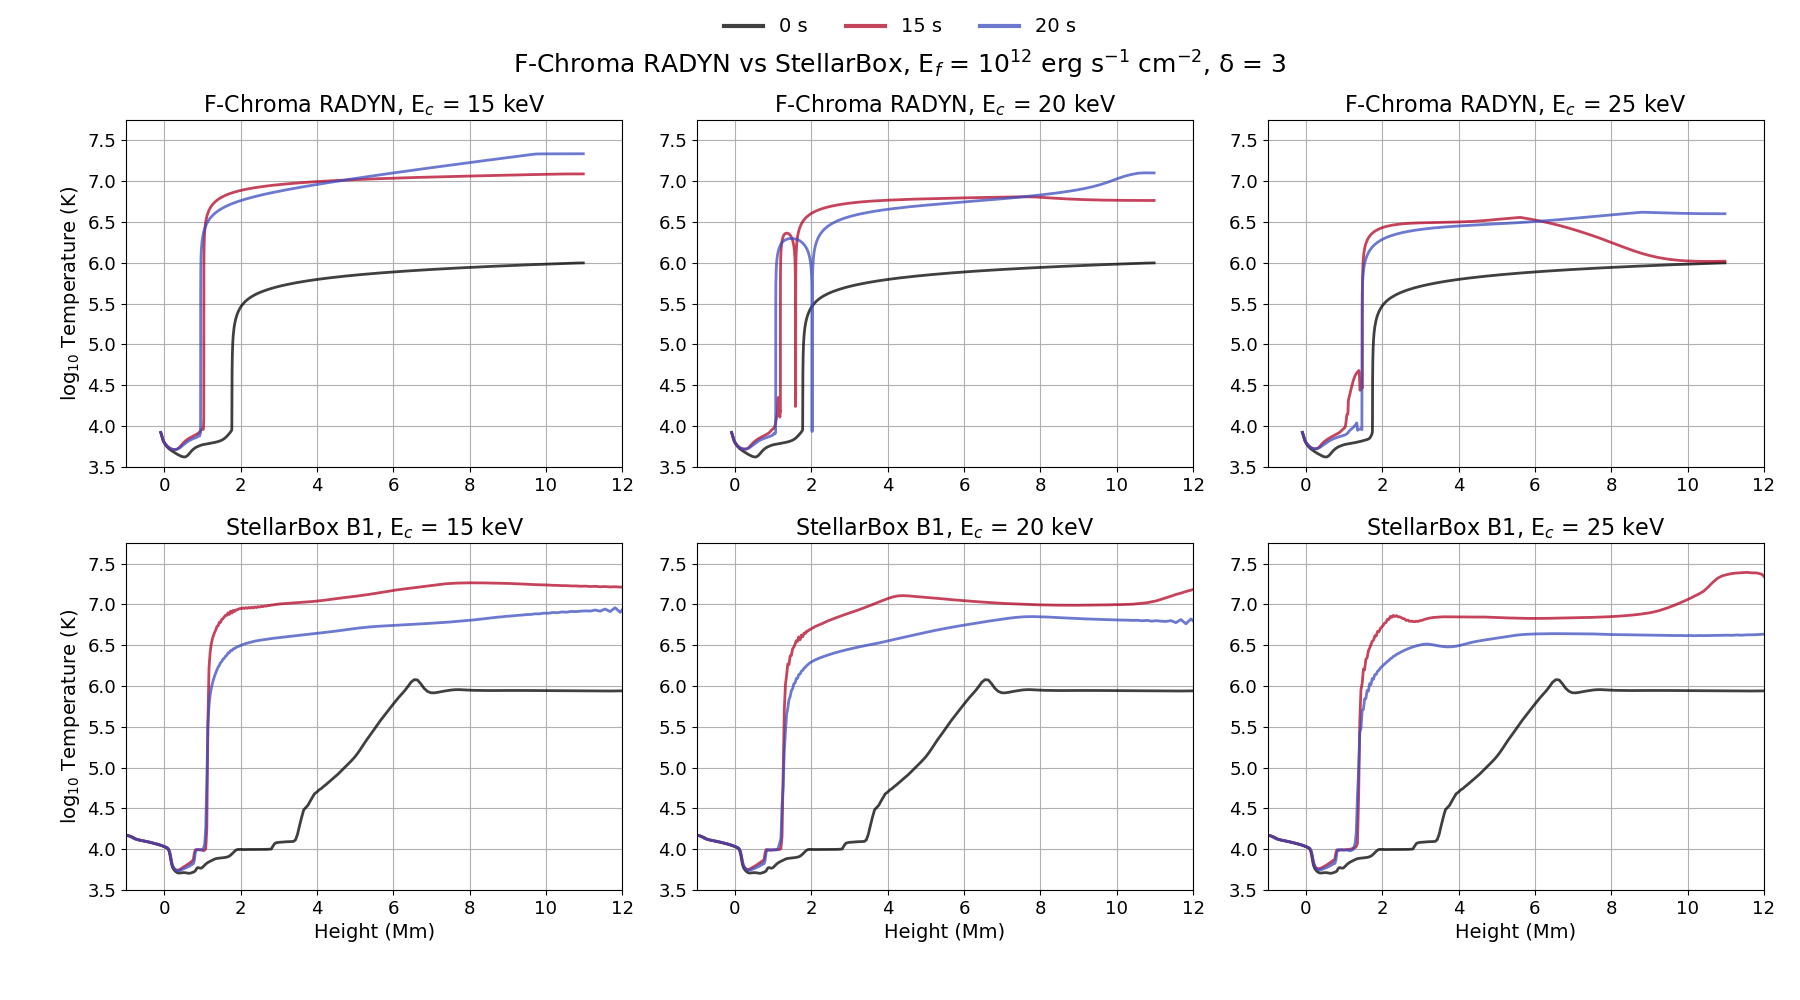
To place the three-dimensional StellarBox results in context, we compared them with one-dimensional F-CHROMA RADYN flare models (Carlsson et al., 2023) computed with equivalent beam parameters: total energy flux density of erg s-1 cm-2, a power-law spectral index = 3, and a 20 s triangular temporal profile. Because no 10 keV RADYN model is available in the F-CHROMA database, comparisons were made for the 15, 20, and 25 keV cases. The primary variable examined was temperature as a function of height and time, allowing direct comparison of heating depth, coronal response, and cooling behavior between the two model frameworks (Figure 7).
Prior to beam injection, the StellarBox atmospheres exhibit substantially greater chromospheric and coronal structural detail in contrast to the relatively smooth RADYN models (Figure 7). In the RADYN simulations, the transition region appears as an abrupt jump near z 2 Mm from K to K, whereas in StellarBox the transition from chromospheric to coronal temperatures is more gradual, extending from z 2 to 6 Mm with temperature increasing approximately linearly in from K to K. During beam heating, temperature increases occur more rapidly at all heights in StellarBox than in the corresponding RADYN runs. The maximum coronal temperatures reached in RADYN are to K, decreasing with increasing , while StellarBox produces higher coronal peaks of to K that follow the same trend with (Figure 7).
Another key difference is the post-heating evolution. In the StellarBox model, the atmosphere begins to cool during the decay phase of the beam, roughly after the 15 s mark, with coronal temperatures decreasing by between 0.2 to 0.8 MK between t 15 and 20 s depending on the beam (Figure 7), and reaches near pre-beam values within roughly 10 s after beam termination. In comparison, the coronal layers in the RADYN models remain elevated well beyond the end of heating. Additionally, the fine-scale temperature structure present in the StellarBox chromosphere and transition region before beam impact becomes smoothed during the impulsive phase. Finally, a small chromospheric bubble is visible in the 20 keV RADYN simulation, manifesting as a localized cool region below the heating front, consistent with bubble-like features previously reported in flare simulations (Reid et al., 2020).
IV.3 Fe I 6173 Å Synthesis
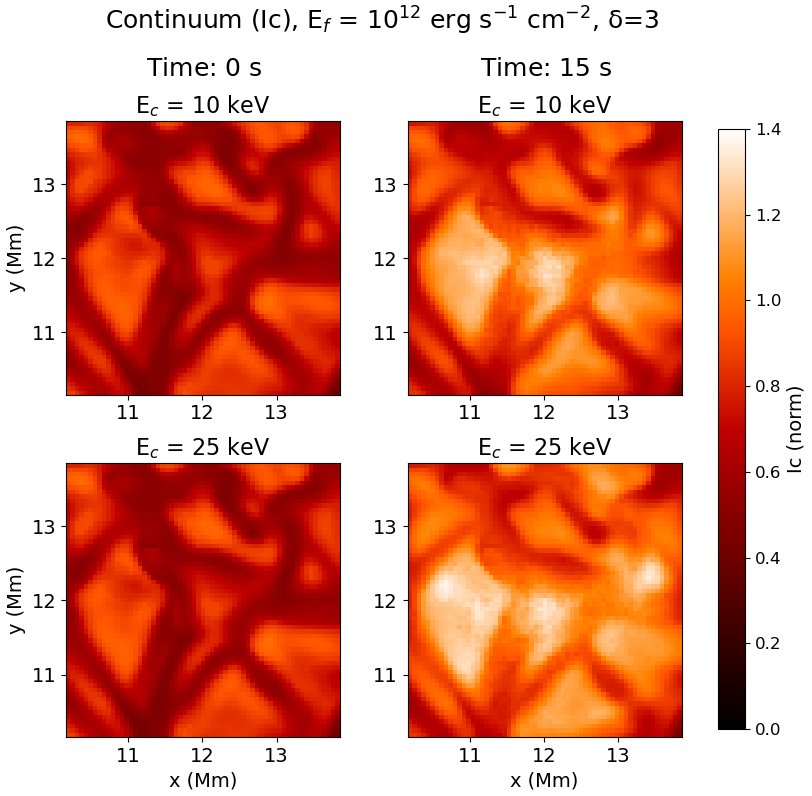
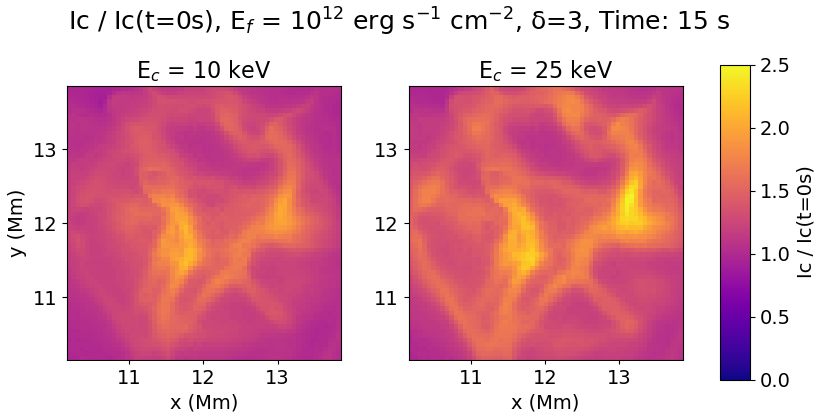
NLTE line synthesis reveals strong continuum enhancement in all electron-beam runs, with peak continuum intensity increases reaching factors of about 2.17 and 2.47 relative to pre-beam levels for the = 10 and 25 keV beam cases respectively, and with the onset of enhancement occurring slightly earlier for higher runs (Figures 8 and 9). The normalized continuum plots (Figure 9) show that this enhancement is spatially structured, with the largest relative increases concentrated in intergranular lanes, reflecting the influence of local photospheric conditions on the continuum response.
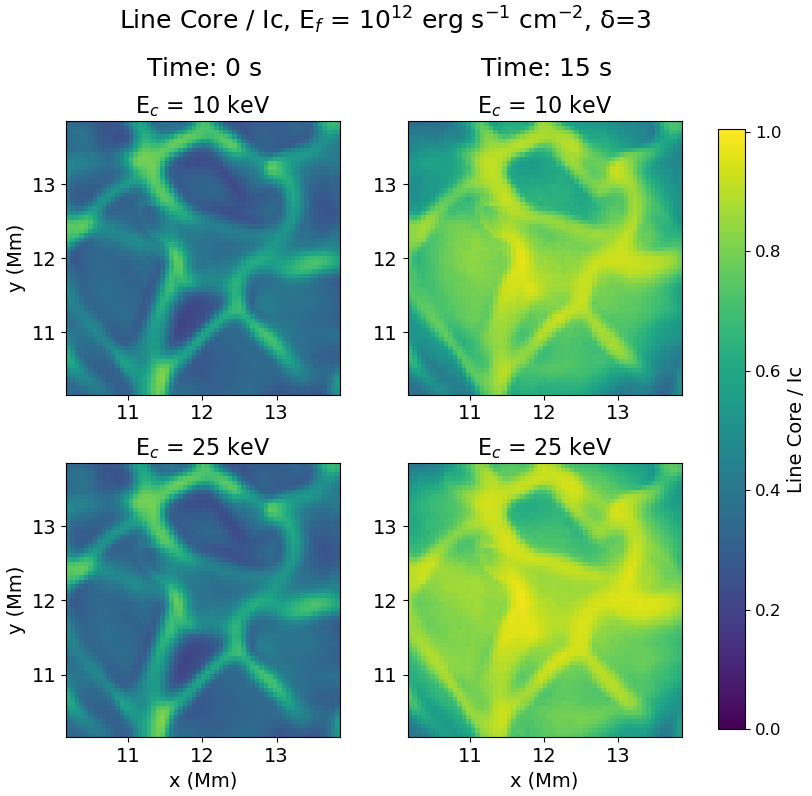
The Fe I 6173 Å line core brightens in all cases, and the core enhancement generally increases with , yet the line remains in absorption for all tested values. The peak core intensity does not exceed the continuum and reaches at most about 97–98% of the continuum in the most favorable (higher ) cases (Figure 10). While electron beams with the considered parameters reproduce continuum WLF signatures, the Fe I 6173 Å line remains in absorption in all cases, indicating that additional factors, such as deeper energy deposition or cooler pre-flare atmospheric conditions, may be required to produce full line-core emission.
Spatially, the line approaches emission most closely above the intergranular lanes (Figures 8 and 10). These regions are characterized by cooler photospheric temperatures compared to the adjacent granules. The enhanced core brightening in these lanes suggests that lower pre-flare photospheric temperatures reduce the continuum background and thereby favor partial or full line-core emission under comparable heating conditions. This dependence is consistent with HMI observations, where Fe I 6173 Å emission kernels are typically located above sunspot umbra and umbra-penumbra boundaries. It supports the interpretation that cooler atmospheric stratifications are more susceptible to line reversal.
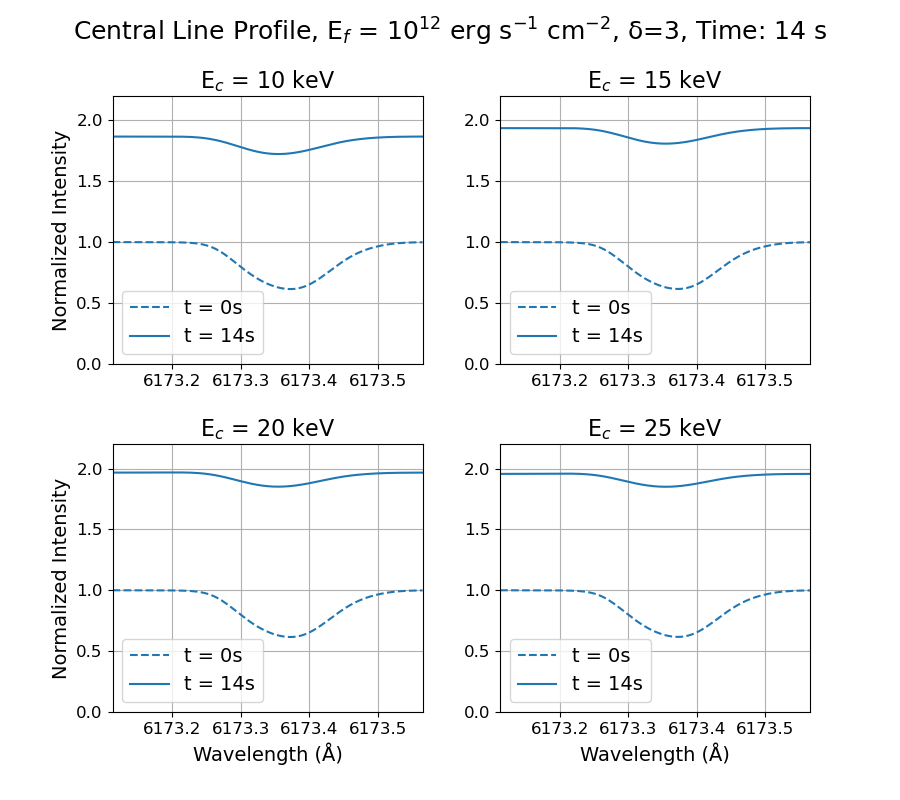
Finally, the synthesized spatially averaged line profiles (Figure 11) show that although all values produce substantial line-core brightening, none achieve a transition to full emission at any time. This further indicates that the beam parameters studied here do not yield the deep photospheric heating needed to reproduce the Fe I 6173 Å emission observed in strong white-light kernels.
V Discussion
The 3D radiative MHD simulations presented here reveal that electron beams with realistic energy fluxes and spectral parameters can drive substantial upper-chromospheric heating and reproduce strong continuum enhancements, while placing constraints on the conditions required to produce Fe I 6173 Å line-core emission. In all cases, the bulk of the deposited energy remains confined above Mm (Figures 1 and 2), and the resulting shocks, condensations, and chromospheric bubbles evolve on short (5–20 s) timescales without appreciable penetration into the photosphere. Although the atmospheric response is highly structured and strongly time-dependent, the depth of energy deposition limits the ability of these disturbances to produce the compact, high-contrast continuum kernels seen in observations.
Comparison with the one-dimensional F-CHROMA RADYN flare models clarifies the role of multidimensional geometry and realistic atmospheric structure. Despite using identical beam fluxes, spectral indices, and temporal profiles, the StellarBox atmospheres exhibit significantly greater chromospheric and coronal structuring prior to beam injection (Figure 7), reflecting magneto-convective dynamics absent in 1D equilibria. This fine structuring modulates beam energy deposition, accelerates the formation of shocks, and enables more vigorous lateral expansion. Consequently, the StellarBox simulations produce faster and more spatially extended temperature increases, along with higher peak coronal temperatures ( to K) than their RADYN counterparts ( to K) (Figure 7). These differences demonstrate how multidimensional transport and local magnetic geometry shape the flare response even when beam parameters are held fixed.
A striking contrast with 1D models is the rapid cooling observed in StellarBox. Temperatures return to near pre-flare values within about 10 s of beam termination (Figure 7), suggesting efficient radiative losses and lateral conductive leakage facilitated by the full 3D structure. In contrast, the 1D RADYN models retain hot coronal plasma long after the beam ceases, highlighting differences in energy confinement that stem from the absence of lateral expansion and radiative leakage in 1D geometries. These distinctions demonstrate the need for multi-dimensional modeling when evaluating flare energy transport and post-impulsive cooling.
The synthetic Fe I 6173 Å profiles provide further insight into the observational consequences of these hydrodynamic processes. All electron-beam cases exhibit strong continuum brightening consistent with continuum enhancements observed during strong X-class white-light flares (Figures 8–11), but none achieve full line-core reversal. Instead, the line brightens substantially while remaining in absorption, with core intensities reaching at most 97–98% of the continuum. The line approaches emission most closely above the intergranular lanes, where cooler pre-flare photospheric temperatures lower the continuum intensity and thus enhance the relative line-core contrast. This behavior is consistent with HMI observations (Granovsky et al., 2025), where Fe I core emission kernels are concentrated in umbrae and umbra-penumbra boundaries. Thus, the susceptibility of Fe I 6173 Å to reversal appears controlled jointly by the heating mechanism and the pre-flare thermal stratification.
The shock and condensation dynamics visible in the simulations highlight important implications for helioseismic responses. Multiple upward shock fronts, lateral expansions, and chromospheric condensations introduce significant momentum fluxes into the overlying plasma. Under certain conditions, these motions may contribute to the excitation of downward-propagating acoustic waves, a key requirement for sunquake generation. However, because the impulsive heating remains confined to heights above the low chromosphere, these electron-beam-driven dynamics may be insufficient to reproduce the strongest helioseismic impulses under the atmospheric and magnetic conditions explored here. In particular, the absence of significant overpressure or momentum transfer near the photosphere suggests that an additional, deeper-reaching energy carrier is required.
Taken together, these results indicate that while electron beams can readily produce strong continuum enhancements and dynamic chromospheric responses, additional factors, such as deeper particle penetration, stronger magnetic fields, or cooler pre-flare atmospheric stratifications, may be required to reproduce the most extreme white-light and helioseismic signatures. The need for deeper penetration naturally directs attention toward high-energy proton beams (Sadykov et al., 2024; Granovsky et al., 2025) and, perhaps, mixed electron-proton precipitation, which are capable of reaching larger column masses and potentially delivering the necessary photospheric heating. Similarly, the strong dependence of Fe I line response on local photospheric temperature highlights the importance of realistic pre-flare atmospheric conditions, particularly the cooler environments of sunspot umbrae where line reversal is observed.
VI Conclusions
The three-dimensional radiative MHD simulations presented here demonstrate that electron beams with realistic flare parameters (energy flux of erg s-1 cm-2, a spectral index of , and between 10 and 25 keV) produce substantial upper-chromospheric heating, strong continuum enhancement, and a complex hydrodynamic response (Figures 1–6). The impulsive energy deposition generates multiple upward-propagating shock fronts, lateral expansions, and short-lived chromospheric condensations and bubbles, reflecting the inherently three-dimensional nature of flare energy transport. The simulated continuum brightens by a maximum factor of 2.2–2.5 and exhibits fine-scale structuring of the continuum emission (Figure 9), indicating that electron beams can account for the magnitude of white-light continuum enhancements and capture key aspects of their localized nature. However, the Fe I 6173 Å line core does not transition into full emission, observed in some strong flares (Kosovichev et al., 2023; Granovsky et al., 2025) and remains in absorption for all tested beam parameters.
Comparison with one-dimensional F-CHROMA RADYN models highlights key differences that arise from multidimensional atmospheric structure. Despite identical beam parameters, the StellarBox atmospheres exhibit more rapid temperature rises, higher peak coronal temperatures, and faster post-impulsive cooling than their 1D counterparts (Figure 7). This behavior reflects the enhanced efficiency of radiative and conductive losses, as well as lateral expansion, in a fully 3D environment. While 1D models retain hot coronal plasma long after heating ceases, the 3D simulations rapidly relax toward pre-flare conditions, suggesting that energy confinement may be overestimated in simplified geometries. These distinctions demonstrate the need for multidimensional modeling when interpreting flare energetics, particularly in the context of line formation and continuum response.
The synthetic Fe I 6173 Å profiles further clarify the relationship between heating depth, atmospheric structure, and observable flare signatures. Line-core brightening is strongest above cooler intergranular lanes, where lower continuum background levels enhance the contrast of the partially filled-in line core. This sensitivity to local thermal structure mirrors HMI observations, which show Fe I emission kernels preferentially forming in umbral and umbra-penumbra regions. The spatially fragmented continuum emission in our simulations may explain the fine structure of flare ribbons (Sharykin & Kosovichev, 2014; French et al., 2025). The absence of full line-core reversal in the simulations suggests that significantly deeper and more concentrated heating, and/or different pre-flare atmospheric conditions, may be required to reproduce the observed emission.
Taken together, these results suggest that additional energy-transport agents or atmospheric conditions, such as high-energy protons, mixed particle populations, or strong-field sunspot atmospheres, may play an important role in producing the deepest heating and most extreme flare signatures. However, a full assessment of electron-beam efficacy requires extending the present models to include umbral magnetic fields and cooler pre-flare stratifications. Future work will incorporate proton and mixed-species beams into the StellarBox framework, along with more realistic umbral and penumbral initial conditions, improved treatment of deep photospheric radiative transfer, and the inclusion of radiative-acoustic coupling needed to assess sunquake excitation.
VII Appendix
The electron-beam heating term implemented in StellarBox follows the analytic solution for collisional energy loss in a cold plasma (Syrovatskii & Shmeleva, 1972; Livshits et al., 1981). At each horizontal location the vertical hydrogen column density above height is
| (1) |
where is the number density of neutral and ionized hydrogen atoms.
In the numerical implementation, the hydrogen column density in Equation 1 is evaluated discretely from the top of the domain downward. For each vertical cell with cell thickness and hydrogen number densities and at adjacent cell centers, the incremental contribution to the cumulative column density is computed as:
| (2) |
This trapezoidal summation accumulates from the upper boundary ( at ) downward through the computational grid.
Next, we define characteristic column depth and ionization loss constant for electrons with energy :
| (3) |
| (4) |
The function of heating is:
| (5) |
where is the total beam energy flux density at the top of the atmosphere, and is:
| (6) |
The volumetric heating rate added to the MHD energy equation is
| (7) |
with a Gaussian lateral width and a triangular temporal profile
| (8) |
where is the beam onset time and its total duration.
Acknowledgment
This work is partially supported by the NSF grant 1916509, and NASA Programs: the Science DRIVE (Diversify, Realize, Integrate, Venture, Educate) Center Program (COFFIES Project “Consequences of Fields and Flows in the Interior and Exterior of the Sun”; 80NSSC22M0162), Heliophysics Guest Investigators (23-HGIO23_2-0077), and Heliophysics Internal Scientist Funding (24-HISFM24_2-0001 and 24-HISFM24_2-0032). Resources supporting this work were provided by the NASA High-End Computing (HEC) Program through the NASA Advanced Supercomputing (NAS) Division at Ames Research Center. The authors acknowledge the use of the Overleaf Writeful and TeXGPT models for sentence structure and prose suggestions.
References
- Allred et al. (2005) Allred, J. C., Hawley, S. L., Abbett, W. P., & Carlsson, M. 2005, ApJ, 630, 573, doi: 10.1086/431751
- Allred et al. (2015) Allred, J. C., Kowalski, A. F., & Carlsson, M. 2015, ApJ, 809, 104, doi: 10.1088/0004-637X/809/1/104
- Brown (1971) Brown, J. C. 1971, Sol. Phys., 18, 489, doi: 10.1007/BF00149070
- Carlsson et al. (2023) Carlsson, M., Fletcher, L., Allred, J., et al. 2023, A&A, 673, A150, doi: 10.1051/0004-6361/202346087
- French et al. (2025) French, R. J., Kazachenko, M. D., Berghmans, D., et al. 2025, arXiv e-prints, arXiv:2512.00710, doi: 10.48550/arXiv.2512.00710
- Granovsky et al. (2025) Granovsky, S., Kosovichev, A. G., Sadykov, V. M., Kerr, G. S., & Allred, J. C. 2025, ApJ, 988, 74, doi: 10.3847/1538-4357/addd1e
- Hudson (1972) Hudson, H. S. 1972, Sol. Phys., 24, 414, doi: 10.1007/BF00153384
- Kosovichev et al. (2023) Kosovichev, A. G., Sadykov, V. M., & Stefan, J. T. 2023, ApJ, 958, 160, doi: 10.3847/1538-4357/acf9eb
- Kostiuk & Pikelner (1975) Kostiuk, N. D., & Pikelner, S. B. 1975, Soviet Ast., 18, 590
- Livshits et al. (1981) Livshits, M. A., Badalian, O. G., Kosovichev, A. G., & Katsova, M. M. 1981, Sol. Phys., 73, 269, doi: 10.1007/BF00151682
- Machado et al. (1989) Machado, M. E., Emslie, A. G., & Avrett, E. H. 1989, Sol. Phys., 124, 303, doi: 10.1007/BF00156272
- Monson et al. (2021) Monson, A. J., Mathioudakis, M., Reid, A., Milligan, R., & Kuridze, D. 2021, ApJ, 915, 16, doi: 10.3847/1538-4357/abfda8
- Pereira & Uitenbroek (2015) Pereira, T. M. D., & Uitenbroek, H. 2015, A&A, 574, A3, doi: 10.1051/0004-6361/201424785
- Reid et al. (2020) Reid, A., Zhigulin, B., Carlsson, M., & Mathioudakis, M. 2020, ApJ, 894, L21, doi: 10.3847/2041-8213/ab8d1e
- Rybicki & Hummer (1991) Rybicki, G. B., & Hummer, D. G. 1991, A&A, 245, 171
- Rybicki & Hummer (1992) —. 1992, A&A, 262, 209
- Sadykov et al. (2020) Sadykov, V. M., Kosovichev, A. G., Kitiashvili, I. N., & Kerr, G. S. 2020, ApJ, 893, 24, doi: 10.3847/1538-4357/ab7b6a
- Sadykov et al. (2024) Sadykov, V. M., Stefan, J. T., Kosovichev, A. G., et al. 2024, ApJ, 960, 80, doi: 10.3847/1538-4357/ad0cf3
- Scherrer et al. (2012) Scherrer, P. H., Schou, J., Bush, R. I., et al. 2012, Sol. Phys., 275, 207, doi: 10.1007/s11207-011-9834-2
- Sharykin & Kosovichev (2014) Sharykin, I. N., & Kosovichev, A. G. 2014, ApJ, 788, L18, doi: 10.1088/2041-8205/788/1/L18
- Syrovatskii & Shmeleva (1972) Syrovatskii, S. I., & Shmeleva, O. P. 1972, Soviet Ast., 16, 273
- Uitenbroek (2001) Uitenbroek, H. 2001, ApJ, 557, 389, doi: 10.1086/321659
- Wray et al. (2015) Wray, A. A., Bensassi, K., Kitiashvili, I. N., Mansour, N. N., & Kosovichev, A. G. 2015, arXiv e-prints, arXiv:1507.07999, doi: 10.48550/arXiv.1507.07999