Object-Centric 3D Gaussian Splatting for Strawberry Plant Reconstruction and Phenotyping
Abstract
Strawberries are among the most economically significant fruits in the United States, generating over $2 billion in annual farm-gate sales and accounting for approximately 13% of the total fruit production value. Plant phenotyping plays a vital role in selecting superior cultivars by characterizing plant traits such as morphology, canopy structure, and growth dynamics. However, traditional plant phenotyping methods are time-consuming, labor-intensive, and often destructive. Recently, neural rendering techniques, notably Neural Radiance Fields (NeRF) and 3D Gaussian Splatting (3DGS), have emerged as powerful frameworks for high-fidelity 3D reconstruction. By capturing a sequence of multi-view images or videos around a target plant, these methods enable non-destructive reconstruction of complex plant architectures. Despite their promise, most current applications of 3DGS in agricultural domains reconstruct the entire scene, including background elements, which introduces noise, increases computational costs, and complicates downstream trait analysis. To address this limitation, we propose a novel object-centric 3D reconstruction framework incorporating a preprocessing pipeline that leverages the Segment Anything Model v2 (SAM-2) and alpha channel background masking to achieve clean strawberry plant reconstructions. This approach produces more accurate geometric representations while substantially reducing computational time. With a background-free reconstruction, our algorithm can automatically estimate important plant traits, such as plant height and canopy width, using DBSCAN clustering and Principal Component Analysis (PCA). Experimental results show that our method outperforms conventional pipelines in both accuracy and efficiency, offering a scalable and non-destructive solution for strawberry plant phenotyping.
keywords:
Plant phenotyping \sep3D reconstruction \sep3D Gaussian Splatting \sepNeural Radiance Fields \sepStrawberry1 Introduction
Strawberries (Fragaria × ananassa) are not only valued for their rich nutritional profile, being an excellent source of vitamins, minerals, and antioxidants that promote human health, but also for their strong consumer demand and economic importance (Giampieri et al., 2012). Strawberries are among the most widely consumed and economically significant fruits in the United States. In 2024, U.S. strawberry production exceeded 1.6 billion pounds, with California and Florida serving as the primary production regions (Fresh Produce Association of the Americas, 2024). However, strawberry plants and their nutritional composition are highly sensitive to environmental changes such as temperature and light intensity (Tulipani et al., 2011).
Given the crop’s economic importance and sensitivity to environmental factors, effective cultivation and phenotyping strategies are essential to improve yield and quality. The cultivation process plays a critical role in selecting cultivars that perform best under varying environmental conditions such as temperature, humidity, and light (Kouloumprouka Zacharaki et al., 2024). Plant phenotyping, defined as the quantitative assessment of plant traits such as morphology, physiology, and yield components, plays a critical role in cultivar development (Fiorani and Schurr, 2013). Traditionally, these selection and evaluation processes rely heavily on manual measurements and visual assessments, which are often time-consuming, labor-intensive, and destructive (Liu et al., 2023). Such limitations hinder large-scale and continuous monitoring of plant growth and fruit development, underscoring the need for automated, non-destructive, and high-throughput phenotyping approaches.
Recent advancements in sensing modalities, including hyperspectral imaging, LiDAR, and 3D reconstruction, combined with machine learning and deep learning algorithms, have transformed plant phenotyping into a data-rich and computationally driven discipline (Fiorani and Schurr, 2013, Li et al., 2014, Jiang and Li, 2020). For instance, Ndikumana et al. (2024) recently developed an image-based Strawberry Phenotyping Tool that integrates two deep learning architectures, YOLOv4 (Bochkovskiy et al., 2020) and U-Net (Ronneberger et al., 2015), into a unified system to extract multiple strawberry phenotypic traits. The system enabled the detection and measurement of six key traits, including plant height, leaf area, and flower count, either directly from natural scenes or indirectly from captured and stored images. Similarly, Zheng et al. (2022) utilized Structure-from-Motion (SfM) techniques in combination with high-resolution RGB orthoimages, near-infrared (NIR) orthoimages, and Digital Surface Models (DSM) to enhance strawberry canopy characterization. In their study, Mask R-CNN (He et al., 2017) was applied to orthoimages with two spectral band combinations (RGB and RGB–NIR) to accurately identify and delineate strawberry plant canopies. Despite these advances, traditional image-based and SfM approaches remain constrained by limited geometric fidelity and sensitivity to occlusion (Li et al., 2025, Bao et al., 2025).
More recently, advanced neural rendering techniques such as Neural Radiance Fields (NeRF) and 3D Gaussian Splatting (3DGS) have emerged as powerful approaches for high-fidelity 3D reconstruction and scene representation (Gao et al., 2022, Chen and Wang, 2024, Li et al., 2025). NeRF utilizes implicit neural representations to synthesize photorealistic 3D scenes from sparse multi-view images, capturing fine geometric and textural details that conventional reconstruction methods often miss (Mildenhall et al., 2021). Trained in a self-supervised manner using only images and camera poses, without explicit 3D or depth annotations, NeRF is particularly advantageous for complex plant architectures where occlusion and noise hinder traditional depth-sensing approaches. In contrast, 3DGS models scenes as collections of Gaussian primitives, enabling efficient real-time rendering and reconstruction (Kerbl et al., 2023). By replacing volumetric rendering with point-based splatting, 3DGS achieves superior computational efficiency and scalability, making it highly suitable for high-throughput phenotyping and large-scale agricultural applications.
Although significant progress has been made, applying NeRF and 3DGS to plant phenotyping is still in its early stages and has only recently begun attracting strong interest from the agricultural research community (Li et al., 2025, Jiang et al., 2025, Shen et al., 2025, Chen et al., 2025). For instance, Zhang et al. (Zhang et al., 2024) proposed a NeRF-based model for 3D scene reconstruction and rendering of strawberry plants. Building upon the baseline NeRF framework, their model integrates multi-resolution latent feature encoding and environmental factor embedding to enhance reconstruction quality under varying conditions. Experimental results demonstrated that the proposed NeRF model achieved photorealistic rendering performance across small-, medium-, and large-scale agricultural scenes; however, it did not specifically address plant phenotyping tasks such as trait extraction or quantitative analysis. In Jiang et al. (2025), the authors introduced a 3DGS-based workflow for reconstructing high-fidelity 3D models of cotton plants and extracting phenotypic traits such as boll number, volume, plant height, and canopy size. Using smartphone imagery and photogrammetry, but the background was removed manually. The method achieved superior rendering quality and accurate trait estimation, with errors under 10% compared to LiDAR ground truth. Despite these advancements, strawberry plant phenotyping remains largely unexplored using 3DGS techniques. Moreover, most current applications in the agricultural domain focus on reconstructing entire scenes, including background elements, which introduces noise, increases computational costs, and complicates downstream trait analysis.
In this paper, we propose a novel high-throughput strawberry plant phenotyping framework based on 3D Gaussian Splatting (3DGS). Instead of reconstructing the entire captured scene, our method introduces an object-centric 3D reconstruction framework that focuses on generating clean and accurate strawberry plant models from noisy backgrounds. A preprocessing pipeline leveraging the Segment Anything Model v2 (SAM-2) (Ravi et al., 2024) is incorporated prior to reconstruction to isolate plant regions. During the reconstruction, RGBA-based loss masking, opacity-guided Gaussian culling (Tancik et al., 2023), and background randomization are employed to further suppress background artifacts. This framework yields high-fidelity, object-centric strawberry plant reconstructions with improved accuracy and substantially reduced computational time. By reconstructing background-free plant models, the proposed framework can automatically estimate key phenotypic traits, such as plant height and canopy width, using Density-Based Spatial Clustering of Applications with Noise (DBSCAN) (Ester et al., 1996) and Principal Component Analysis (PCA) (Maćkiewicz and Ratajczak, 1993). The framework provides a low-cost, automated, and scalable solution for precise strawberry plant analysis, paving the way for advanced 3D phenotyping and intelligent crop breeding, with potential applicability to other crop species.
2 Materials and Methods
2.1 Data acquisition
All strawberry plant data used in this study were collected under controlled indoor conditions to ensure consistent illumination and minimize environmental variability. The plants were maintained in their natural growth state without pruning, defoliation, or any other human intervention, thereby preserving their authentic canopy structures for realistic 3D reconstruction and phenotyping analyses. Each strawberry plant was placed individually on a circular bin to provide uniform background separation and facilitate complete multi-view capture. A 10 cm calibration cube, with 9.6 cm ArUco markers affixed to all six faces, was positioned adjacent to each plant to serve as a geometric scale reference for metric restoration and alignment during 3D reconstruction.
Video data were acquired using an Apple iPhone 16. The recording resolution was set to 2160 3840 pixels (4K), with a frame rate of 24 frames per second (fps) to capture fine spatial and temporal details. During acquisition, the operator circumnavigated each plant along a smooth trajectory at three distinct height levels (i.e., low (approximately 0–5 cm above the soil), mid (5–20 cm), and high (20–50 cm), to ensure adequate multi-view coverage of the canopy, fruiting zones, and crown region. The data collection was conducted in April 2025. In total, 15 healthy strawberry plants at the fruiting growth stage were recorded. The resulting dataset encompasses a wide range of morphological variations, including differences in leaf density, occlusion patterns, and fruit positioning, thereby providing a robust foundation for evaluating 3D reconstruction accuracy, scale calibration, and subsequent phenotypic analysis.
2.2 3D Gaussian Splatting (3DGS)
NeRF-based methods have demonstrated remarkable 3D reconstruction fidelity by learning a volumetric scene function that maps spatial coordinates and viewing directions to color and density , without explicitly modeling scene geometry (Mildenhall et al., 2021). Despite their success, these approaches often suffer from heavy computational costs and long training and rendering times (Barron et al., 2021, Gao et al., 2022, Li et al., 2025).
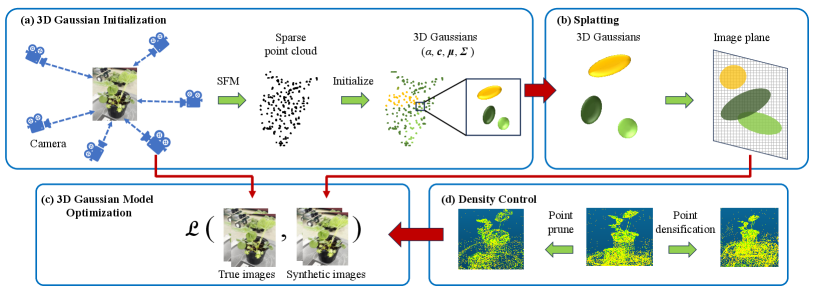
To overcome these limitations, 3DGS (Kerbl et al., 2023) introduces an explicit 3D geometry representation that enables real-time rendering, compact scene modeling, and high reconstruction accuracy. Unlike implicit radiance field methods, 3DGS formulates an explicit radiance field by directly associating radiance information with points in 3D space (Fig. 1). The model is trained in a supervised manner to minimize discrepancies between synthesized and ground-truth multi-view images, substantially improving learning efficiency and rendering speed for complex, high-resolution scenes.
As illustrated in Figure 1(a), the scene geometry is represented as a set of 3D Gaussians (ellipsoids), each defined by radiance attributes, opacity and color , and spatial attributes, including the center and a 3D covariance matrix . In contrast to NeRF, which infers opacity implicitly from volumetric density , 3DGS models the opacity explicitly as a learnable parameter, allowing finer control over transparency and surface boundaries. The color component is represented through spherical harmonic coefficients to capture view-dependent appearance variations efficiently. To guarantee that the covariance matrix remains positive semi-definite and geometrically meaningful, it is factorized as:
| (1) |
where denotes a rotation matrix (commonly parameterized by a quaternion), and is a diagonal scaling matrix.
In the rendering stage, splatting is employed to project each 3D Gaussian onto the 2D image plane, as illustrated in Figure 1(b). To reduce redundant computation, frustum culling (Assarsson and Moller, 2000) efficiently filters out Gaussians that fall outside the camera’s viewing frustum. This rendering strategy stands in contrast to NeRF’s ray-marching procedure, which requires dense sampling along camera rays and thus incurs higher computational overhead. After projection, every 3D Gaussian corresponds to a 2D elliptical Gaussian on the image plane. The final pixel color is determined through alpha compositing, where the contributions of overlapping Gaussians are blended according to their opacities (Zheng et al., 2024):
| (2) |
with the pixel-level opacity computed as
| (3) |
This formulation allows 3DGS to achieve fast, differentiable rendering while maintaining photorealistic image quality.
To achieve real-time rendering, 3DGS leverages tile-based rasterization (Lassner and Zollhofer, 2021) in conjunction with highly parallel CUDA-based rendering (Kerbl et al., 2023). During model optimization, density control strategies (Rota Bulò et al., 2024), including Gaussian densification and pruning, dynamically adjust point distributions according to gradient magnitude and opacity to maintain both fidelity and efficiency (Figure 1(d)). Given the ground truth RGB image and rendered RGB image , the overall objective function typically integrates an color reconstruction term with a D-SSIM perceptual loss to balance pixel accuracy and structural similarity (Figure 1(c)):
| (4) | ||||
The training process generally follows three key stages: (i) acquiring multi-view images and initializing Gaussians (through SfM or random seeding), (ii) projecting Gaussians to synthesize novel views, and (iii) iteratively optimizing Gaussian parameters while refining their spatial density based on learned gradients and opacity cues.
2.3 Object-centric 3DGS
For the classical 3DGS, both foreground and background objects are reconstructed simultaneously within the same scene representation. While this holistic modeling captures complete environmental context, it can introduce redundant Gaussian primitives in background regions that are irrelevant to the primary object of interest. Such redundancy increases memory usage, slows optimization, and may degrade rendering quality due to unnecessary occlusions or scattering effects (Markin et al., 2024, Rogge and Stricker, 2025, Jain et al., 2024). In the context of strawberry plant reconstruction and phenotyping, reconstructing the entire scene is typically unnecessary and may even be detrimental, as background clutter introduces visual noise around the plant canopy. This noise complicates accurate morphological trait estimation, particularly for fine structures such as leaves, crowns, and fruit surfaces.
To overcome these limitations, we develop an object-centric 3DGS framework tailored for precise plant reconstruction. Multi-view images are preprocessed using SAM 2 (Ravi et al., 2024) to generate RGBA inputs, where the alpha channel encodes a binary mask that distinguishes the plant and reference cube (foreground) from the surrounding environment (background). Unlike the original 3DGS implementation (Kerbl et al., 2023), which relies solely on RGB supervision across all pixels, our proposed model incorporates the alpha channel into its training pipeline as a foreground supervision mask. This mechanism ensures that optimization focuses exclusively on object regions while automatically suppressing background Gaussians through the refinement process.
Given a ground-truth RGBA image , where denotes the RGB channels and represents the alpha mask channel. In addition, a rendered RGB prediction is denoted by . our proposed model applies the channel as a multiplicative binary mask during loss computation:
| (5) |
Pixels with (background) are excluded from the loss, ensuring that gradients are propagated only through the foreground regions. Consequently, Gaussians projected onto background pixels receive negligible gradient updates and are not optimized during training.
An adaptive refinement strategy (Tancik et al., 2023) is further employed, where it periodically removes or splits Gaussians based on their learned opacity and gradient magnitudes. Although the RGBA alpha mask is not explicitly used in this stage, its influence propagates indirectly through the optimization gradients: Gaussians corresponding to background pixels (masked by ) accumulate low opacity values and are automatically pruned during the refinement step when
| (6) |
This synergy between masked supervision and opacity-based pruning leads to a natural elimination of background Gaussians without requiring explicit segmentation or post-processing.
During each iteration, a random background color (with normalized RGB values) is used to further prevent the model from fitting to static background regions:
| (7) |
where denotes the accumulated Gaussian opacity. represents the rendered color from Gaussian splatting and denotes the final composited RGB image. Randomizing discourages the network from reconstructing the background, thereby reinforcing the suppression of non-object Gaussians.
Through the combination of (i) loss masking using RGBA alpha channels, (ii) opacity-guided Gaussian culling, and (iii) background randomization, the proposed approach achieves clean, object-centric reconstructions. In contrast, traditional 3DGS pipelines lacking alpha masking optimize over all image pixels and thus tend to reconstruct unwanted background regions. Consequently, the reconstructed scenes exhibit a clean separation between plant structures and background, yielding compact, geometrically accurate, and visually consistent point clouds, well-suited for downstream strawberry phenotyping and structural trait analysis.
2.4 Plant trait estimation
After 3D reconstruction using the proposed object-centric 3DGS, a high-fidelity point cloud of the strawberry plant and reference cube is generated. This point cloud serves as the foundation for quantitative trait estimation, including plant height and crown width.
To begin, the exported point cloud is segmented using the Density-Based Spatial Clustering of Applications with Noise (DBSCAN) algorithm (Ester et al., 1996) to separate the plant and reference cube. DBSCAN is particularly suitable for this task because it does not require a predefined number of clusters and effectively handles outliers caused by minor reconstruction artifacts. Each identified cluster is analyzed by its oriented bounding box (OBB) dimensions, from which the cube cluster is isolated based on its characteristic geometric regularity and compactness.
Once the cube cluster is identified, it is used to perform scale calibration, converting the reconstruction units (arbitrary 3DGS coordinates) into physical dimensions (centimeters). Specifically, we estimate the cube’s edge length from the reconstructed geometry and compare it with the known real-world cube edge length of . To obtain an accurate edge estimate, a plane-based measurement method is employed: multiple parallel planes are fitted to the cube’s faces, and the mean inter-plane distances are used to compute the average reconstructed edge length. This measured edge length, denoted as , yields a global scaling ratio:
| (8) |
All 3D points are then rescaled by this factor , ensuring that the reconstructed plant dimensions reflect true metric measurements.
Following scale restoration, the plant cluster is analyzed to extract morphological traits. The height of the plant is computed as the difference between the maximum and minimum -coordinates of the scaled point cloud, while the crown width is estimated by projecting the points onto the ground plane and measuring the maximum lateral extent along principal axes obtained via Principal Component Analysis (PCA) (Abdi and Williams, 2010). Additional derived metrics, such as canopy volume, leaf spread area, and fruit distribution density, can also be calculated depending on the desired phenotyping objectives.
This integrated pipeline, combining 3DGS-based reconstruction, DBSCAN segmentation, plane-based scaling, and geometric feature extraction, enables robust, accurate, and fully automated quantification of plant morphological traits. It provides a reliable foundation for downstream analyses in high-throughput phenotyping, growth monitoring, and genotype-to-phenotype association studies.
2.5 Evaluation metrics
Comprehensive evaluation of both 3D reconstruction quality and plant trait measurement accuracy is important for assessing the effectiveness of reconstruction frameworks in plant phenotyping. The first group of metrics focuses on 3D reconstruction evaluation, measuring how accurately the reconstructed renderings represent real-world scenes in terms of visual and structural fidelity. The second group centers on plant trait estimation, quantifying the accuracy of morphological traits (i.e., plant height and width) derived from the reconstructed 3D models. Together, these complementary metrics provide a holistic assessment of both the visual realism and biological reliability of the reconstruction pipeline.
2.5.1 3D Reconstruction metrics
Peak Signal-to-Noise Ratio (PSNR): PSNR is a standard quantitative metric derived from the mean squared error (MSE) that expresses the fidelity of reconstructed images on a logarithmic scale. A higher PSNR indicates that the reconstruction retains more image detail and introduces less distortion or noise:
| (9) |
where represents the maximum possible pixel intensity. In the context of 3D plant reconstruction, PSNR evaluates how faithfully the generated textures and surfaces replicate the reference imagery (Zhao et al., 2024).
Structural Similarity Index Measure (SSIM): SSIM quantifies perceptual similarity by jointly considering luminance, contrast, and structural information between the reconstructed and reference images:
| (10) |
where denote mean intensities, are variances, and represents covariance between images and . Higher SSIM values correspond to improved perceptual quality and structural consistency (Zhao et al., 2024).
Learned Perceptual Image Patch Similarity (LPIPS): LPIPS measures perceptual similarity using deep feature representations extracted from pretrained convolutional neural networks. Unlike PSNR or SSIM, which operate on pixel intensity, LPIPS captures high-level semantic differences between images:
| (11) |
where and are normalized feature maps from layer of a pretrained network, and are learned channel-wise weights. Lower LPIPS scores indicate closer perceptual alignment and greater visual realism (Chopra et al., 2024).
2.5.2 Plant trait-specific metrics
Coefficient of Determination (): measures the proportion of variance in observed trait values (e.g., plant height, leaf area) that is explained by predictions derived from the reconstructed model:
| (12) |
where is the number of test samples, and represent the estimated plant height/width and the actual plant height/width in the th test image, respectively. Values approaching “1” indicate high predictive accuracy and strong agreement between reconstructed and ground-truth traits (Zhu et al., 2024, Yang et al., 2024).
Root Mean Squared Error (RMSE): RMSE quantifies the average magnitude of prediction error, reflecting the precision of quantitative trait estimation:
| (13) |
Lower RMSE values imply more accurate estimations and are particularly important for applications such as biomass prediction and morphological assessment (Yang et al., 2024).
Mean Absolute Percentage Error (MAPE): MAPE measures the average percentage deviation between predicted and observed values, providing an interpretable indicator of relative prediction error:
| (14) |
A lower MAPE value reflects higher predictive robustness and reliability of trait estimation (Choi et al., 2024).
Mean Absolute Error (MAE): MAE measures the accuracy of the predicted plant height or width across the test dataset, indicating how close the predictions are to the ground truth counts.
| (15) |
A lower value indicates higher accuracy of the trait estimation.
Accuracy (Acc): accuracy evaluates how well a predictive model aligns with the actual values.
| (16) |
2.6 Experimental setups
The collected strawberry videos were first decomposed into image frames, yielding approximately 100–150 frames per sequence to ensure sufficient multi-view coverage of each plant. During video acquisition, the camera was moved smoothly around each plant at multiple height levels and viewing angles to capture comprehensive geometric and texture information. The camera intrinsics and extrinsics were estimated using Structure-from-Motion (SfM) implemented in the COLMAP pipeline, producing accurate camera poses and a sparse 3D point cloud for Gaussian initialization. The resulting image sets were subsequently divided into training (60%) and testing (40%) subsets. The training subset was used for model reconstruction, whereas the testing subset served to evaluate the rendering and trait estimation performance of the reconstructed 3D model.
We adopt the Splatfacto model in Nerfstudio (Tancik et al., 2023) as the implementation of the 3D Gaussian Splatting (3DGS) framework. To evaluate the effectiveness of our object-centric approach, we also implement a post background removal method (Splatfacto-PBR), in which backgrounds are removed using the SAM-2 model after reconstruction, whereas in our method, background removal is performed prior to reconstruction.
To establish comparative baselines, we implement three NeRF-based models: Nerfacto (Tancik et al., 2023), Instant-NGP (Müller et al., 2022), and Mip-NeRF (Barron et al., 2021). Specifically, Nerfacto, developed within the Nerfstudio framework (Tancik et al., 2023), integrates several state-of-the-art NeRF techniques such as hash encoding, proposal sampling, and per-image appearance conditioning to balance reconstruction quality, training efficiency, and memory usage. Instant-NGP (Müller et al., 2022) accelerates NeRF training and inference through multi-resolution hash encoding, enabling a compact architecture that achieves high-quality results with significantly reduced computational cost. Mip-NeRF (Barron et al., 2021) extends the NeRF framework to a continuous-scale representation by rendering anti-aliased conical frustums instead of discrete rays, effectively mitigating aliasing artifacts and improving the reconstruction of fine structural details.
All models were trained on the same strawberry dataset for 30,000 iterations, using identical training and testing splits. The Adam optimizer was used throughout, and input images were downsampled to one-quarter of their original resolution to enhance memory efficiency. The reconstruction experiments were conducted on a Linux workstation equipped with an NVIDIA GeForce RTX 5090 GPU (32 GB VRAM), Intel Xeon W-2295 CPU, and 128 GB RAM. The environment utilized CUDA 12.9 and PyTorch 2.4, providing optimized support for GPU-based parallel rendering.
3 Results
In this section, we present and analyze the results of the proposed framework. First, we compare the reconstruction performance of the Splatfacto and NeRF baselines to demonstrate the advantages of the 3DGS approach in terms of rendering quality and efficiency. Next, we evaluate the impact of different background removal strategies on reconstruction accuracy and scene cleanliness. Finally, we examine the effectiveness of the reconstructed 3D models in plant trait estimation.
3.1 Comparison between 3DGS and NeRFs
We first compare the 3DGS model, implemented via Splatfacto, with three representative NeRF-based approaches, Nerfacto, Instant-NGP, and Mip-NeRF, using the strawberry dataset. The evaluation results, averaged over 15 individual strawberry plants, are summarized in Table 1.
Overall, Splatfacto demonstrates superior reconstruction performance across all key metrics. It achieves the highest PSNR (28.69) and SSIM (0.9249) values, indicating greater photometric accuracy and structural fidelity, while maintaining the lowest LPIPS (0.0781) score, reflecting strong perceptual similarity with ground-truth images. In addition, Splatfacto offers the fastest training time (8m52s) and highest rendering speed (2.83 FPS) among all evaluated models, while consuming the least GPU memory (1.89 GB). These results highlight the computational efficiency and reconstruction quality of 3DGS compared with traditional NeRF-based approaches. The explicit Gaussian representation not only accelerates training and rendering but also enables high-fidelity 3D reconstructions suitable for detailed plant structure analysis and phenotyping.
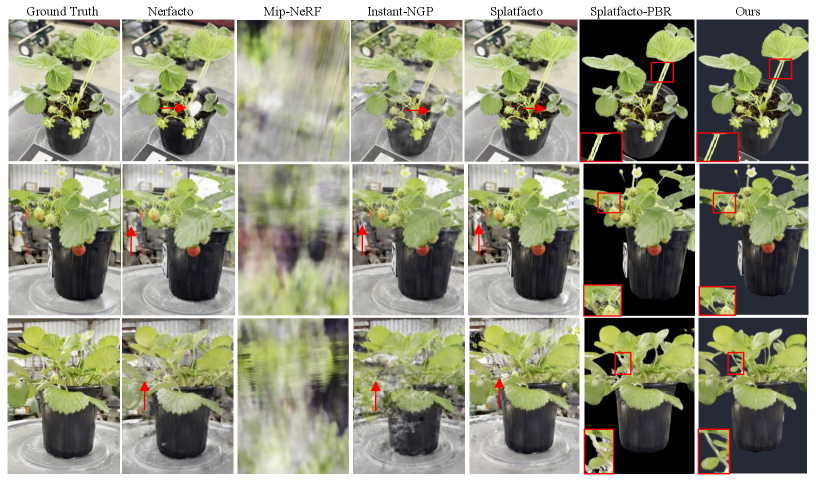
Figure 2 illustrates qualitative reconstruction results for representative strawberry plants across various NeRF-based and 3DGS-based models. As shown, Mip-NeRF fails to preserve geometric or textural fidelity, producing severe blurring and aliasing artifacts. Instant-NGP and Nerfacto improve visual quality but still exhibit noticeable background noise and ghosting effects around leaf edges and stems (indicated by red arrows). In contrast, Splatfacto yields substantially sharper reconstructions with finer structural detail and more realistic shading, consistent with its superior quantitative performance in Table 1.
| PSNR(↑) | SSIM(↑) | LPIPS(↓) | Training Time (↓) | Inference Rendering (FPS ↑) | GPU Memory (GB ↓) | |
| Nerfacto | 21.53 | 0.7738 | 0.2103 | 14m46s | 0.7760 | 2.04 |
| Instant-NGP | 20.25 | 0.7890 | 0.2780 | 14m37s | 0.7413 | 2.69 |
| Mip-Nerf | 10.98 | 0.5487 | 0.8406 | 1h24m | 0.0516 | 4.69 |
| Splatfacto | 28.69 | 0.9249 | 0.0781 | 8m52s | 2.8310 | 1.89 |
3.2 Comparison between different background removal methods
To further evaluate the effectiveness of the proposed object-centric 3DGS, we compared it with a post-processing background removal approach based on the original Splatfacto framework. In the post-processing setup, background pixels were removed after model training using an external pre-trained model SAM 2, while our method integrates the background suppression directly into the training pipeline as discussed in Sec. 2.3.
As shown in Table 2, our method consistently outperforms the post-processing background removal across all evaluation metrics. The PSNR and SSIM scores increase by 4.19 dB and 0.0132, respectively, indicating higher reconstruction fidelity and better structural consistency. The LPIPS value decreases from 0.0657 to 0.0550, confirming improved perceptual quality. Moreover, our integrated masking approach achieves a 40% faster training time (6m26s vs. 8m52s) and a 2.5× increase in rendering speed (7.08 FPS vs. 2.83 FPS), while maintaining comparable memory usage. The superior performance can be attributed to the early incorporation of background masks during optimization, which eliminates irrelevant gradients from background regions and allows the model to focus computation on the foreground plant geometry. This integrated strategy not only enhances visual quality but also improves efficiency by reducing the number of redundant Gaussians generated in non-informative regions.
| PSNR(↑) | SSIM(↑) | LPIPS(↓) | Training Time (↓) | Rendering Speed (FPS, ↑) | GPU Memory (GB, ↓) | |
| Splatfacto-PBR | 23.20 | 0.9289 | 0.0657 | 8m52s | 2.8310 | 1.89 |
| Ours | 27.39 | 0.9421 | 0.055 | 6m26s | 7.0824 | 1.96 |
Furthermore, as shown in Figure 2, incorporating background removal (Splatfacto-PBR) results in clearer object boundaries and reduced clutter, demonstrating the benefits of masking out irrelevant regions after training. Our proposed object-centric 3DGS (“Ours”) produces the cleanest and most photorealistic renderings, effectively isolating the plant canopy and fruit structures from the background. The red insets highlight that our method accurately preserves small details such as leaf serrations, petiole curvature, and fruit surfaces, which are essential for precise morphological analysis.
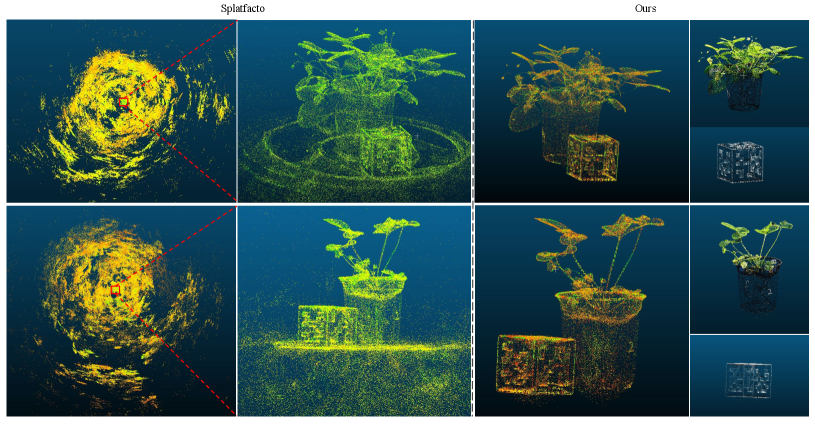
In addition to the quantitative comparisons, the qualitative point cloud visualizations in Figure 3 further highlight the benefits of the proposed method. The Splatfacto baseline exhibits a high density of noisy Gaussian primitives scattered across the background, forming irregular clusters and circular artifacts that obscure plant geometry. This results in diffuse point distributions around the pot and reference cube, as seen in the left panels. In contrast, our object-centric 3DGS produces a well-organized and compact point cloud with a clear separation between the plant and its surroundings. The reconstructed plant canopy and reference cube are sharply defined, and the background noise is almost entirely eliminated. The dense yet uniform distribution of Gaussian centers demonstrates the effectiveness of mask-guided density control, which prunes redundant points while preserving fine geometric details in the leaves and fruits. These results qualitatively validate that integrating the background removal process directly into training yields cleaner, more accurate 3D structures that are crucial for downstream phenotyping and morphological analysis.
Overall, the combination of explicit Gaussian representation and foreground-guided optimization leads to reconstructions that are both computationally efficient and structurally faithful. These qualitative outcomes, together with the quantitative improvements in PSNR, SSIM, and LPIPS, confirm that the proposed method provides a promising foundation for high-fidelity, background-free plant modeling and phenotyping.
3.3 Performance on plant traits
To assess the applicability of the reconstructed 3D models for phenotypic analysis, we evaluated the accuracy of plant height and crown width estimation derived from the reconstructed point clouds. The object-centric 3DGS models were processed through the DBSCAN-PCA–based trait extraction pipeline, as described in Section 2.3. The reference cube in each scene provided the scale calibration, enabling conversion from reconstruction units to metric measurements (cm).
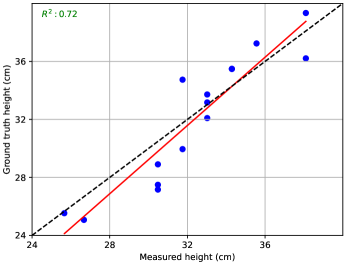
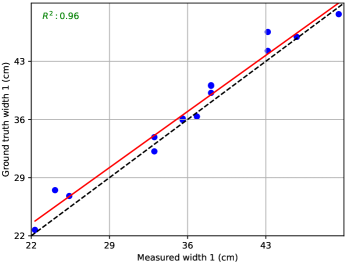
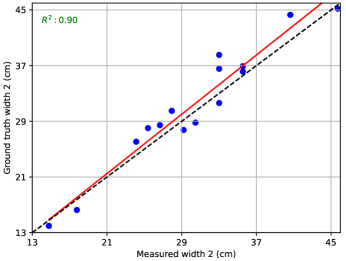
Figure 4 presents the comparison between the estimated and ground-truth traits for 15 strawberry plants. Overall, the proposed approach achieved strong linear correlations across all traits, demonstrating that the reconstructed 3D geometry preserves accurate spatial information. Table 3 summarizes the quantitative results. For plant height, the regression model yielded an of 0.72, with an RMSE of 1.81 cm, MAPE of 4.85%, and an overall accuracy of 95.15%. The estimation of Width 1 (major crown axis) achieved an of 0.96 and MAPE of 3.72%, indicating high consistency with manual measurements. Similarly, Width 2 (minor crown axis) obtained an of 0.90, with an RMSE of 2.43 cm and accuracy of 92.94%. These results demonstrate that the combination of object-centric 3DGS reconstruction, DBSCAN-based plant segmentation, and PCA-driven dimensional analysis provides an effective and robust framework for extracting plant morphological traits. The method accurately captures structural variability across individual plants while maintaining centimeter-level precision.
| RMSE | MAPE | MAE | Acc | ||
| Height | 0.72 | 1.81 | 4.85% | 1.56 | 95.15% |
| Width 1 | 0.96 | 1.59 | 3.72% | 1.25 | 96.28% |
| Width 2 | 0.90 | 2.43 | 7.06% | 2.06 | 92.94% |
4 Limitations and Discussions
The proposed object-centric 3DGS framework demonstrates the advantages of integrating segmentation-guided training within neural rendering pipelines. Unlike traditional NeRF models, which require extensive rendering iterations to resolve fine details, 3DGS directly models radiance through explicit Gaussian primitives, allowing efficient optimization. The addition of alpha-channel masking further enhances convergence speed by focusing learning on object-relevant regions. However, several limitations remain that offer promising avenues for further research and refinement.
4.1 Environmental robustness and lighting conditions
The current experiments were conducted under indoor, controlled illumination conditions, which effectively minimized shadowing, specular reflections, and motion-induced noise. While this setup ensures reproducibility and precise evaluation, it may not fully represent real-world agricultural environments, where natural light variation, fluctuating illumination spectra, and wind-induced plant motion can significantly affect image quality. These environmental factors may cause inconsistencies in photometric cues, camera pose estimation, and Gaussian density optimization. Future research should investigate adaptive illumination correction and temporal denoising strategies, such as photometric calibration, exposure compensation, and video-based multi-view stabilization, to maintain reconstruction consistency under uncontrolled outdoor conditions. Moreover, incorporating physics-based rendering priors, such as LiDAR-guided geometric constraints (Hess et al., 2025, Xiao et al., 2024), into the 3DGS optimization process could further enhance robustness to dynamic lighting and shadow variations in natural field environments.
4.2 Extension to complex phenotypic traits
While the current DBSCAN–PCA–based trait estimation approach effectively quantifies key geometric attributes such as plant height and canopy width, it remains limited to low-level morphological features. These parameters, though fundamental, do not capture higher-order physiological indicators that are often more predictive of yield potential and plant health. For example, traits such as leaf inclination angle distribution, canopy volume, and fruit density require finer structural modeling and semantic understanding beyond simple geometric boundaries. Integrating semantic segmentation networks (Ravi et al., 2024) could enable trait-specific feature extraction directly from Gaussian primitives. Additionally, coupling the 3DGS outputs with multi-modal sensing modalities, such as hyperspectral, multispectral, or thermal imaging, could facilitate the simultaneous analysis of morphological and physiological states (e.g., photosynthetic activity, water stress, and disease onset), thereby bridging structural and functional plant phenotyping (Li et al., 2025).
4.3 Scalability to multi-plant and field-scale applications
The scalability of the proposed framework to multi-plant or field-scale scenarios remains an important challenge. The current pipeline is optimized for individual-plant reconstruction, simplifying DBSCAN-based segmentation and scale calibration using a single reference cube. However, extending the framework to dense crop rows or multi-object scenes introduces challenges related to inter-plant occlusion, viewpoint overlap, and Gaussian density balancing. As the number of Gaussian primitives increases approximately quadratically with scene complexity, memory usage and optimization time may rise substantially. Addressing these issues may require the development of hierarchical or tile-based 3DGS strategies, in which localized Gaussian clusters are trained independently and later fused through spatial registration. Alternatively, incorporating distributed GPU architectures, cloud-based reconstruction, or multi-agent reconstruction pipelines could enable efficient large-scale modeling of crop canopies in outdoor environments (Yu et al., 2025, Ham et al., 2024). These advancements are critical for transitioning the framework from controlled single-plant experiments to high-throughput, field-level phenotyping systems capable of operating directly in commercial agricultural settings.
5 Conclusion
In this paper, we developed an object-centric 3DGS framework for high-fidelity strawberry plant reconstruction and quantitative phenotyping. Unlike traditional NeRF-based methods that are computationally intensive and sensitive to background noise, the proposed approach integrates foreground preprocessing, RGBA-based loss masking, opacity-guided Gaussian culling, and background randomization to focus learning on the plant’s structural geometry while suppressing irrelevant background regions. A systematic comparison with established NeRF variants (Nerfacto, Instant-NGP, and Mip-NeRF) demonstrated that our method achieves superior performance in terms of PSNR, SSIM, and LPIPS, while significantly reducing training time and memory consumption. The integration of SAM 2–based segmentation enables a foreground-aware reconstruction process, leading to clean and structurally consistent point clouds that facilitate accurate plant trait estimation. Using the reconstructed point clouds, we further demonstrated centimeter-level accuracy in measuring plant height and crown width via DBSCAN clustering and PCA-based geometric analysis. These results confirm that the proposed framework not only enhances reconstruction quality but also supports reliable, non-destructive, and automated plant phenotyping, which holds strong potential for agricultural monitoring, breeding, and yield estimation.
Authorship Contribution
Jiajia Li: Conceptualization, Investigation, Software, Writing – original draft; Keyi Zhu: Conceptualization, Investigation, Writing – review; Qianwen Zhang: Resources, Writing – review; Dong Chen: Conceptualization, Investigation, Writing – review; Qi Sun: Conceptualization, Investigation, Writing – review; Zhaojian Li: Supervision, Conceptualization, Resources, Writing – review.
Acknowledgment
The authors would like to thank Mr. Moeen Ul Islam at Mississippi State University for his assistance in printing 3D ArUco marker cubes.
References
- Abdi and Williams (2010) H. Abdi and L. J. Williams. Principal component analysis. Wiley interdisciplinary reviews: computational statistics, 2(4):433–459, 2010.
- Assarsson and Moller (2000) U. Assarsson and T. Moller. Optimized view frustum culling algorithms for bounding boxes. Journal of graphics tools, 5(1):9–22, 2000.
- Bao et al. (2025) Y. Bao, T. Ding, J. Huo, Y. Liu, Y. Li, W. Li, Y. Gao, and J. Luo. 3d gaussian splatting: Survey, technologies, challenges, and opportunities. IEEE Transactions on Circuits and Systems for Video Technology, 2025.
- Barron et al. (2021) J. T. Barron, B. Mildenhall, M. Tancik, P. Hedman, R. Martin-Brualla, and P. P. Srinivasan. Mip-nerf: A multiscale representation for anti-aliasing neural radiance fields. In Proceedings of the IEEE/CVF international conference on computer vision, pages 5855–5864, 2021.
- Bochkovskiy et al. (2020) A. Bochkovskiy, C.-Y. Wang, and H.-Y. M. Liao. Yolov4: Optimal speed and accuracy of object detection. arXiv preprint arXiv:2004.10934, 2020.
- Chen and Wang (2024) G. Chen and W. Wang. A survey on 3d gaussian splatting. arXiv preprint arXiv:2401.03890, 2024.
- Chen et al. (2025) J. Chen, Y. Jiao, F. Jin, X. Qin, Y. Ning, M. Yang, and Y. Zhan. Plant sam gaussian reconstruction (psgr): A high-precision and accelerated strategy for plant 3d reconstruction. Electronics, 14(11):2291, 2025.
- Choi et al. (2024) H.-B. Choi, J.-K. Park, S. H. Park, and T. S. Lee. Nerf-based 3d reconstruction pipeline for acquisition and analysis of tomato crop morphology. Frontiers in Plant Science, 15:1439086, 2024.
- Chopra et al. (2024) S. Chopra, F. Cladera, V. Murali, and V. Kumar. Agrinerf: Neural radiance fields for agriculture in challenging lighting conditions. arXiv preprint arXiv:2409.15487, 2024.
- Ester et al. (1996) M. Ester, H.-P. Kriegel, J. Sander, X. Xu, et al. A density-based algorithm for discovering clusters in large spatial databases with noise. In kdd, volume 96, pages 226–231, 1996.
- Fiorani and Schurr (2013) F. Fiorani and U. Schurr. Future scenarios for plant phenotyping. Annual review of plant biology, 64(1):267–291, 2013.
- Fresh Produce Association of the Americas (2024) Fresh Produce Association of the Americas. U.s. strawberry market annual report 2024. Technical report, Fresh Produce, 2024. URL https://www.freshproduce.com/siteassets/files/reports/global-trade/2024/strawberries_annual_market_report_2024.pdf. Accessed: 2025-10-01.
- Gao et al. (2022) K. Gao, Y. Gao, H. He, D. Lu, L. Xu, and J. Li. Nerf: Neural radiance field in 3d vision, a comprehensive review. arXiv preprint arXiv:2210.00379, 2022.
- Giampieri et al. (2012) F. Giampieri, S. Tulipani, J. M. Alvarez-Suarez, J. L. Quiles, B. Mezzetti, and M. Battino. The strawberry: Composition, nutritional quality, and impact on human health. Nutrition, 28(1):9–19, 2012.
- Ham et al. (2024) Y. Ham, M. Michalkiewicz, and G. Balakrishnan. Dragon: Drone and ground gaussian splatting for 3d building reconstruction. In 2024 IEEE International Conference on Computational Photography (ICCP), pages 1–12. IEEE, 2024.
- He et al. (2017) K. He, G. Gkioxari, P. Dollár, and R. Girshick. Mask r-cnn. In Proceedings of the IEEE international conference on computer vision, pages 2961–2969, 2017.
- Hess et al. (2025) G. Hess, C. Lindström, M. Fatemi, C. Petersson, and L. Svensson. Splatad: Real-time lidar and camera rendering with 3d gaussian splatting for autonomous driving. In Proceedings of the Computer Vision and Pattern Recognition Conference, pages 11982–11992, 2025.
- Jain et al. (2024) U. Jain, A. Mirzaei, and I. Gilitschenski. Gaussiancut: Interactive segmentation via graph cut for 3d gaussian splatting. Advances in Neural Information Processing Systems, 37:89184–89212, 2024.
- Jiang et al. (2025) L. Jiang, J. Sun, P. W. Chee, C. Li, and L. Fu. Cotton3dgaussians: Multiview 3d gaussian splatting for boll mapping and plant architecture analysis. Computers and Electronics in Agriculture, 234:110293, 2025.
- Jiang and Li (2020) Y. Jiang and C. Li. Convolutional neural networks for image-based high-throughput plant phenotyping: a review. Plant Phenomics, 2020.
- Kerbl et al. (2023) B. Kerbl, G. Kopanas, T. Leimkühler, and G. Drettakis. 3d gaussian splatting for real-time radiance field rendering. ACM Trans. Graph., 42(4):139–1, 2023.
- Kouloumprouka Zacharaki et al. (2024) A. Kouloumprouka Zacharaki, J. M. Monaghan, J. R. Bromley, and L. H. Vickers. Opportunities and challenges for strawberry cultivation in urban food production systems. Plants, People, Planet, 6(3):611–621, 2024.
- Lassner and Zollhofer (2021) C. Lassner and M. Zollhofer. Pulsar: Efficient sphere-based neural rendering. In Proceedings of the IEEE/CVF Conference on Computer Vision and Pattern Recognition, pages 1440–1449, 2021.
- Li et al. (2025) J. Li, X. Qi, S. H. Nabaei, M. Liu, D. Chen, X. Zhang, X. Yin, and Z. Li. A survey on 3d reconstruction techniques in plant phenotyping: from classical methods to neural radiance fields (nerf), 3d gaussian splatting (3dgs), and beyond. arXiv preprint arXiv:2505.00737, 2025.
- Li et al. (2014) L. Li, Q. Zhang, and D. Huang. A review of imaging techniques for plant phenotyping. Sensors, 14(11):20078–20111, 2014.
- Liu et al. (2023) Z. Liu, T. Liang, and C. Kang. Molecular bases of strawberry fruit quality traits: Advances, challenges, and opportunities. Plant Physiology, 193(2):900–914, 2023.
- Maćkiewicz and Ratajczak (1993) A. Maćkiewicz and W. Ratajczak. Principal components analysis (pca). Computers & Geosciences, 19(3):303–342, 1993.
- Markin et al. (2024) A. Markin, V. Pryadilshchikov, A. Komarichev, R. Rakhimov, P. Wonka, and E. Burnaev. T-3dgs: Removing transient objects for 3d scene reconstruction. arXiv preprint arXiv:2412.00155, 2024.
- Mildenhall et al. (2021) B. Mildenhall, P. P. Srinivasan, M. Tancik, J. T. Barron, R. Ramamoorthi, and R. Ng. Nerf: Representing scenes as neural radiance fields for view synthesis. Communications of the ACM, 65(1):99–106, 2021.
- Müller et al. (2022) T. Müller, A. Evans, C. Schied, and A. Keller. Instant neural graphics primitives with a multiresolution hash encoding. ACM transactions on graphics (TOG), 41(4):1–15, 2022.
- Ndikumana et al. (2024) J. N. Ndikumana, U. Lee, J. H. Yoo, S. Yeboah, S. H. Park, T. S. Lee, Y. R. Yeoung, and H. S. Kim. Development of a deep-learning phenotyping tool for analyzing image-based strawberry phenotypes. Frontiers in Plant Science, 15:1418383, 2024.
- Ravi et al. (2024) N. Ravi, V. Gabeur, Y.-T. Hu, R. Hu, C. Ryali, T. Ma, H. Khedr, R. Rädle, C. Rolland, L. Gustafson, et al. Sam 2: Segment anything in images and videos. arXiv preprint arXiv:2408.00714, 2024.
- Rogge and Stricker (2025) M. Rogge and D. Stricker. Object-centric 2d gaussian splatting: Background removal and occlusion-aware pruning for compact object models. arXiv preprint arXiv:2501.08174, 2025.
- Ronneberger et al. (2015) O. Ronneberger, P. Fischer, and T. Brox. U-net: Convolutional networks for biomedical image segmentation. In International Conference on Medical image computing and computer-assisted intervention, pages 234–241. Springer, 2015.
- Rota Bulò et al. (2024) S. Rota Bulò, L. Porzi, and P. Kontschieder. Revising densification in gaussian splatting. In European Conference on Computer Vision, pages 347–362. Springer, 2024.
- Shen et al. (2025) P. Shen, X. Jing, W. Deng, H. Jia, and T. Wu. Plantgaussian: exploring 3d gaussian splatting for cross-time, cross-scene, and realistic 3d plant visualization and beyond. The Crop Journal, 13(2):607–618, 2025.
- Tancik et al. (2023) M. Tancik, E. Weber, E. Ng, R. Li, B. Yi, J. Kerr, T. Wang, A. Kristoffersen, J. Austin, K. Salahi, A. Ahuja, D. McAllister, and A. Kanazawa. Nerfstudio: A modular framework for neural radiance field development. In ACM SIGGRAPH 2023 Conference Proceedings, SIGGRAPH ’23, 2023.
- Tulipani et al. (2011) S. Tulipani, G. Marzban, A. Herndl, M. Laimer, B. Mezzetti, and M. Battino. Influence of environmental and genetic factors on health-related compounds in strawberry. Food Chemistry, 124(3):906–913, 2011.
- Xiao et al. (2024) R. Xiao, W. Liu, Y. Chen, and L. Hu. Liv-gs: Lidar-vision integration for 3d gaussian splatting slam in outdoor environments. IEEE Robotics and Automation Letters, 2024.
- Yang et al. (2024) X. Yang, X. Lu, P. Xie, Z. Guo, H. Fang, H. Fu, X. Hu, Z. Sun, and H. Cen. Paniclenerf: low-cost, high-precision in-field phenotyping of rice panicles with smartphone. Plant Phenomics, 6:0279, 2024.
- Yu et al. (2025) J. Yu, H. Wang, S. Jiang, X. Zhang, D. Zhang, and Q. Li. Aerial-ground image feature matching via 3d gaussian splatting-based intermediate view rendering. arXiv preprint arXiv:2509.19898, 2025.
- Zhang et al. (2024) J. Zhang, X. Wang, X. Ni, F. Dong, L. Tang, J. Sun, and Y. Wang. Neural radiance fields for multi-scale constraint-free 3d reconstruction and rendering in orchard scenes. Computers and Electronics in Agriculture, 217:108629, 2024.
- Zhao et al. (2024) J. Zhao, W. Ying, Y. Pan, Z. Yi, C. Chen, K. Hu, and H. Kang. Exploring accurate 3d phenotyping in greenhouse through neural radiance fields. arXiv preprint arXiv:2403.15981, 2024.
- Zheng et al. (2022) C. Zheng, A. Abd-Elrahman, V. M. Whitaker, and C. Dalid. Deep learning for strawberry canopy delineation and biomass prediction from high-resolution images. Plant Phenomics, 2022.
- Zheng et al. (2024) S. Zheng, B. Zhou, R. Shao, B. Liu, S. Zhang, L. Nie, and Y. Liu. Gps-gaussian: Generalizable pixel-wise 3d gaussian splatting for real-time human novel view synthesis. In Proceedings of the IEEE/CVF conference on computer vision and pattern recognition, pages 19680–19690, 2024.
- Zhu et al. (2024) X. Zhu, Z. Huang, and B. Li. Three-dimensional phenotyping pipeline of potted plants based on neural radiation fields and path segmentation. Plants, 13(23):3368, 2024.