Chiral light from an emitter coupled to an achiral particle via the Purcell effect
Abstract
We demonstrate that non-chiral nanoparticles can produce chiral light when point emitters are coupled to their surface plasmon modes (SPMs) under certain conditions. Chiral emission arises from asymmetrical plasmon mode propagation from the source combined with the spin-momentum locked nature of the SPMs. The Purcell regime of cavity quantum electrodynamics (QED) ensures that radiation from the coupled mode dominates over that from the emitter itself, giving rise to photons with a circularly polarized component – i.e. chiral light. We experimentally demonstrate this effect using electron beam-induced cathode luminescence from a gold nanorod, coupling it evanescently to a nanofiber probe which also supports spin-momentum locked light. This converts the net spin of the emission into a net directionality of propagation in the fiber modes.
TUS] Department of Physics, Tokyo University of Science, 1-3 Kagurazaka Shinjuku-ku Tokyo 162-8601
The production of photons with a desired spectrum and enhanced generation rate is ably handled by cavity QED techniques, in particular the Purcell effect 1, 2. By coupling photons from an emitter to a resonant mode, for which both the coupling and mode decay occur much faster than the rate at which photons are emitted into free space, the overall emission of the combined system takes on the characteristics of the mode itself, which may be engineered by nanofabrication. In recent years, it has been shown that photon polarization can also be engineered if the characteristics of the resonator mode can be suitably tailored. In particular, appropriate breaking of resonator symmetries, can produce polarized emission by either large resonator birefringence 3, 4, 5, 6, 7, 8, 9, 10, asymmetrical pumping 11, or the use of chiral nanostructures 12, 13. Because control of polarization allows control of propagation direction in chiral quantum optics, polarization control can also be applied to the routing of photons 14, 15, 16, 13.
It has been shown that even for an achiral particle, such as a gold nanorod (GNR), optical chirality exists in the near field 17, 18, 19. Nonetheless, these intriguing observations were made for effective plane-wave excitation of GNRs, and did not produce circular polarization in the far field, ostensibly due to the overall symmetry in the near-field polarization structure. The convenience that would be afforded by being able to use a simple, non-chiral structure to induce circularly polarized photon emission from a linearly polarized source is a strong motivation for further studies in this area.
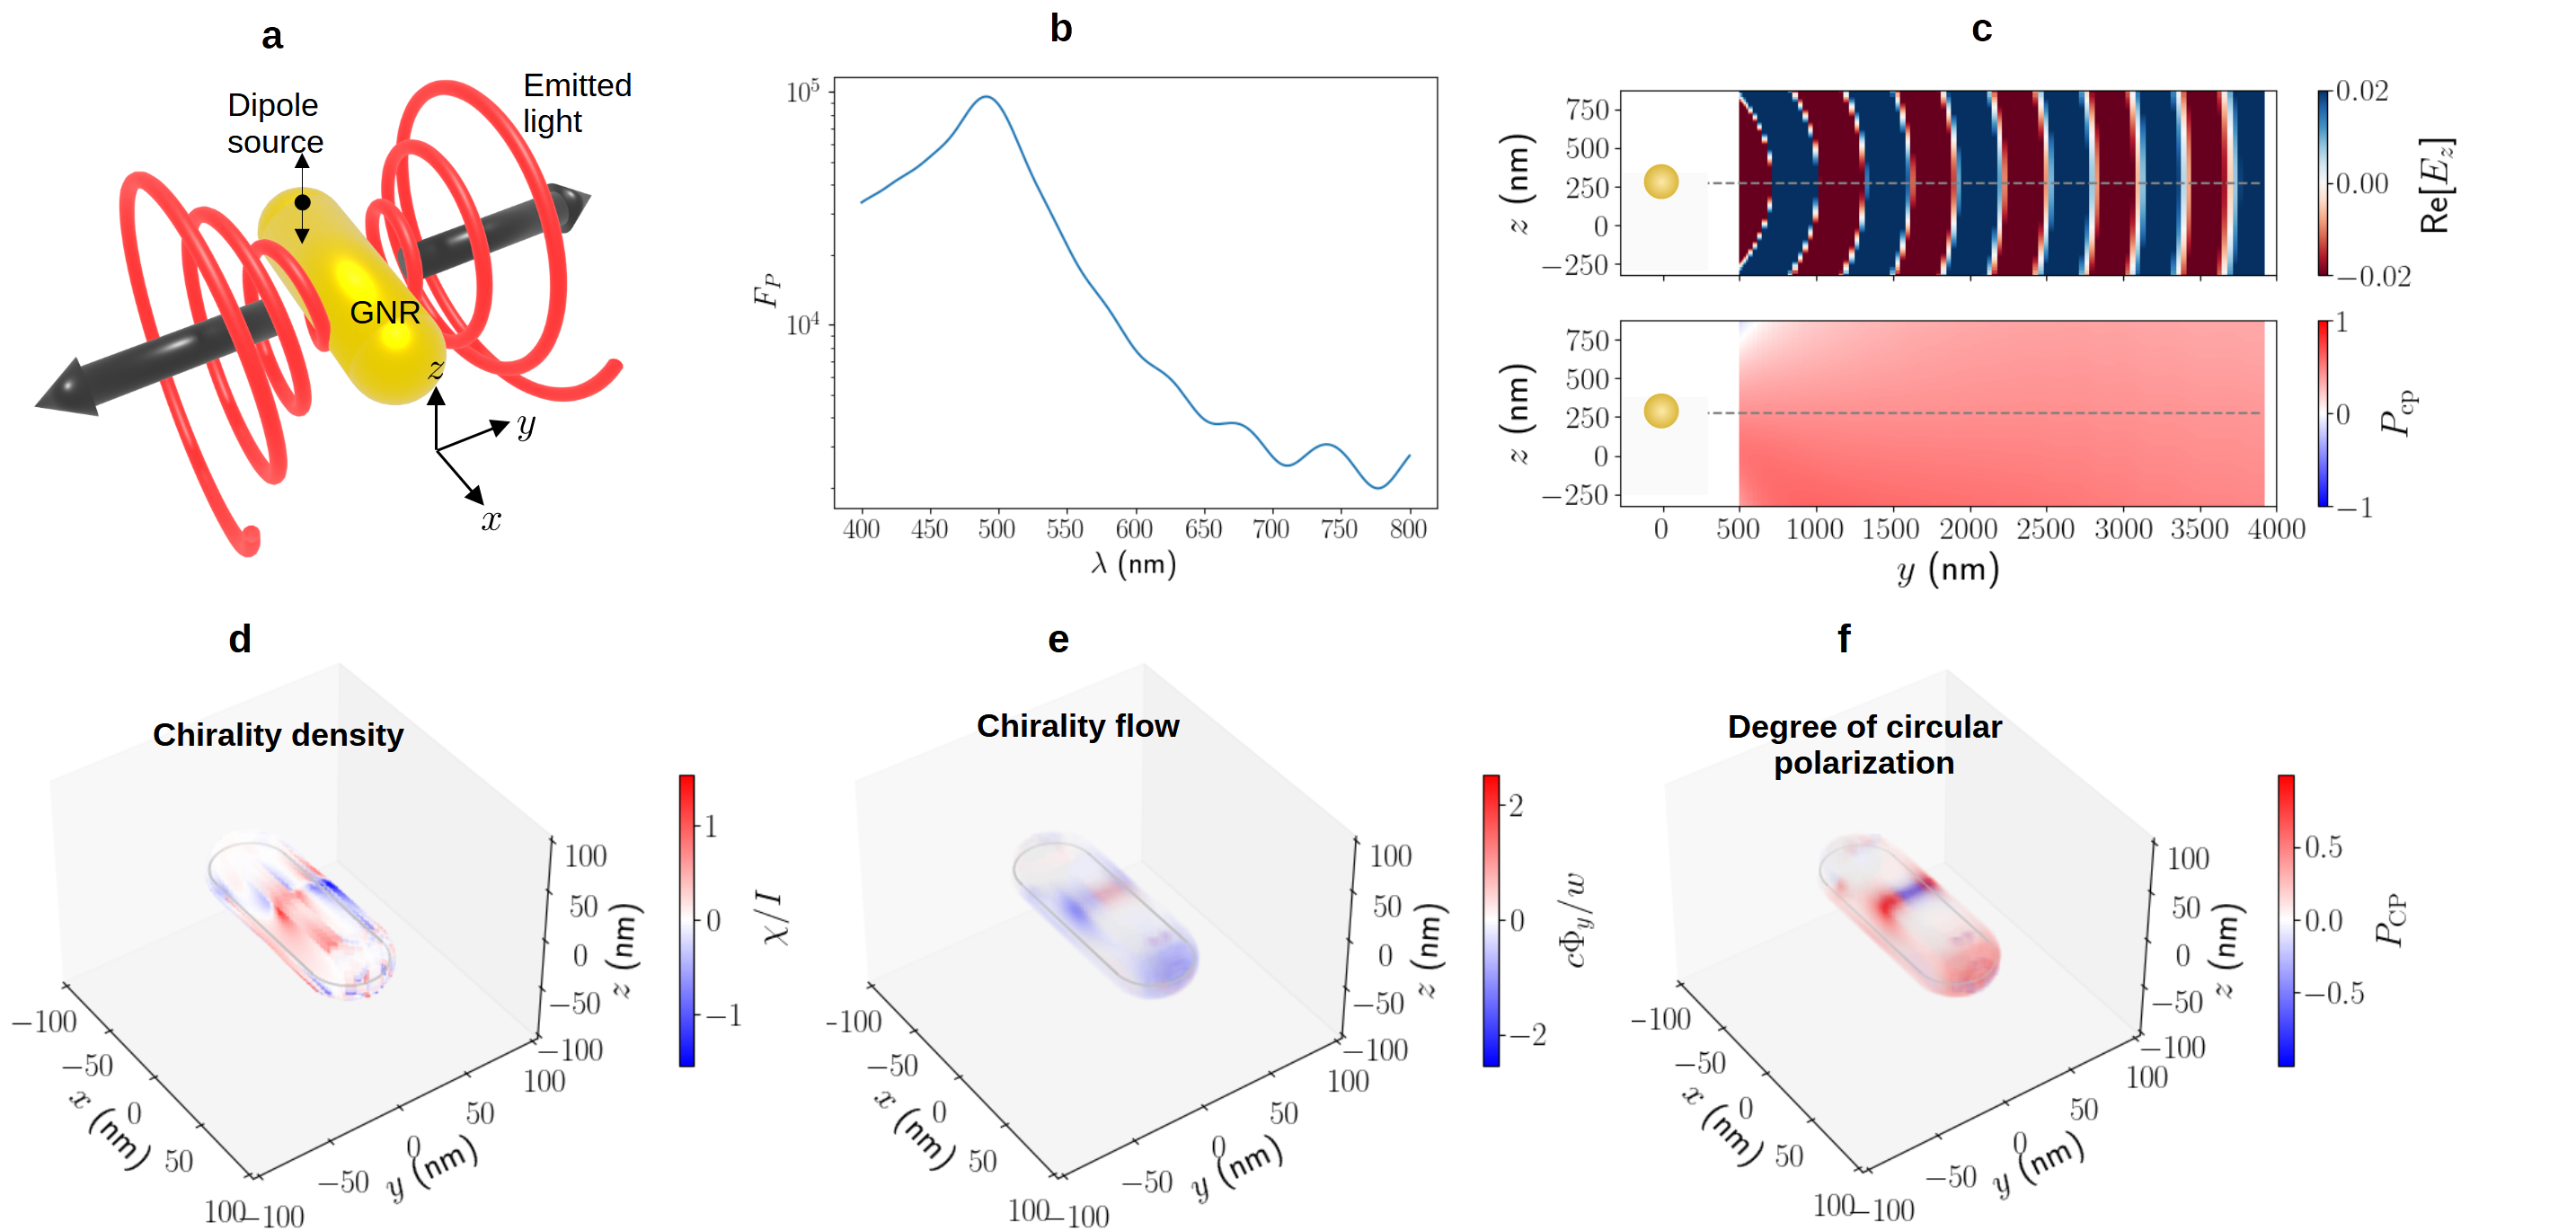
In this work, we investigate the emission produced when a point dipole is coupled to the surface plasmon modes (SPMs) of a GNR, with asymmetric emitter placement relative to the principle axes of the GNR, as depicted in Fig. 1(a). We show that for excitation both inside and outside the GNR, this leads to an asymmetry between propagating modes which is preserved in the SPM field distribution due to the swift decay of the mode. In addition, the large Purcell enhancement, which is well known for gold nanowire antennae and nanorods 20, 4, means that the actual emission for the coupled system comes largely from the SPM of the GNR (Fig. 1(b)). Then, as a consequence of spin-momentum locking of the GNR modes, the asymmetry in propagation leads to a net spin for the dipole moment associated with the GNR, and emission with a non-zero degree of circular polarization (DCP), as shown in Fig. 1(c). We experimentally confirm this effect by using an electron beam to induce a dipole-like excitation in a GNR, and collect the optical emission by evanescent coupling to the spin-momentum locked modes of an optical nanofiber, transforming the net DCP into a net directionality of coupled light in the fiber.
The modern understanding of optical chirality is based on the chirality density and the chirality flow . For the chirality density, it is sufficient to use the definition
| (1) |
for electric (magnetic) field () giving a quantity with units of power per unit area.
The definition of the chirality flow in a dissipative material such as gold is somewhat subtle. We follow Alpeggiani et al. 21 and write
| (2) |
where is the relative permittivity of the metal, which has a negative real part, and, in general, a non-zero imaginary part leading to dissipation. For simplicity, we ignore the imaginary part of when plotting . Note that from here on, we will consider the dimensionless chirality density , where , and the dimensionless chirality flow , where , which are easier to interpret in the case of dipole excitation 22.
Lastly, we introduce a more intuitive quantity, the degree of circular polarization (DCP) which is given by
| (3) |
where is the polarization vector for left-hand circular polarized (LCP) light which rotates counter-clockwise in time using the phase convention . The right-hand circular polarization (RCP) vector is .
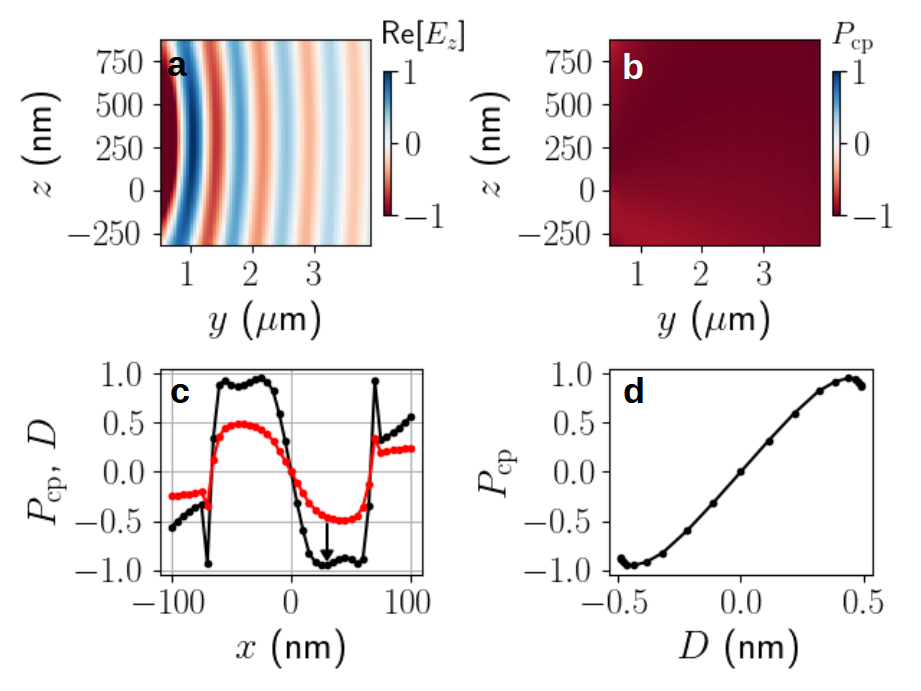
The upper panel of Fig. 1c shows a propagating electromagnetic (EM) field emitted from the GNR in the plane. The field is sampled at a position sufficiently far from the GNR that non-radiative field components have died down. As we show in the Appendix, the field intensity has the expected dependence of EM radiation. The lower panel of Fig. 1c shows the value of for this field. The emitted field clearly has a non-zero degree of circular polarization and thus has net optical chirality. The radiative component of an electric field from a dipole emitter in a direction perpendicular to the dipole axis has the form 23
| (4) |
that is, the polarization of is determined by the dipole moment . We thus restrict our following analysis to the field inside the GNR which determines the induced dipole moment and thus the chirality of the emitted radiation.
Let us now numerically establish the existence of a rotating component for the induced dipole moment in the GNR. In the point dipole approximation, let the induced polarization of the GNR be . For the dipole moment of the GNR as an extended object, we decompose the GNR polarization as follows
| (5) |
where is the GNR volume, and ) is the polarization at point within the GNR induced by the local field at that point. We assume a constant, scalar electric polarizability for simplicity. Because the wavelength we consider is roughly in the middle of the plasmon resonance wavelengths for the and axes, this approximation is not unreasonable. (Note that no such approximations are made in the actual numerics.)
The local field induced by the dipole source in the GNR was found numerically using the finite-difference time-domain (FDTD) technique. We choose to place the dipole source inside the rod since this is the regime accessible experimentally, although we emphasize that the same effect exists for dipoles situated outside the rod. We then analyzed the local field chirality which, by Eq. 5, corresponds to the chirality of the polarization. Details of the FDTD simulations regarding convergence, etc are found in the Appendix.
In Fig. 1(d), the normalized chirality density is shown over the volume of the GNR. Although the density is generally non-zero, it is crucial to note that its structure has sign flipped mirror symmetry in the - plane. That is, every positive region is exactly matched by a negative region of the same size and shape under reflection. For this reason, the average value over the GNR volume vanishes. On the other hand, the distribution of shown in Fig. 1(e) does not have this property and has a net negative value after volume averaging. (The distributions for and do have the same sign-flipped mirror symmetry as the chirality density and thus also average to zero, hence their omission here).
Lastly, we plot in Fig. 1(f). We see it has a similar distribution to , with its average positive value indicating a dominant left-hand circular polarization. This also allows us to interpret as a spin, which is negative as expected for a counter-clockwise polarization in the - plane. Taken together, the results shown in Fig. 1 demonstrate numerically the existence of chiral EM emission despite the fact that the dipole excitation is linearly polarized.
Next, we offer an interpretation of the results in Fig. 1 in terms of the polarization properties of the modes of a metal nanowire. Having verified the three dimensional distribution of the three chirality measures in Figs. 1(d-f), we now restrict our attention to the - plane for ease of visualization. First, we review the properties of the lowest order mode of a nanowire - which has a TM01 character 24, 20. The and components of the field in the - plane are
| (6) | |||||
| (7) |
where are modified Bessel functions of the first kind of order , is the mode transverse wave number, and is the mode propagation constant, which is positive (negative) for positive (negative) propagation.
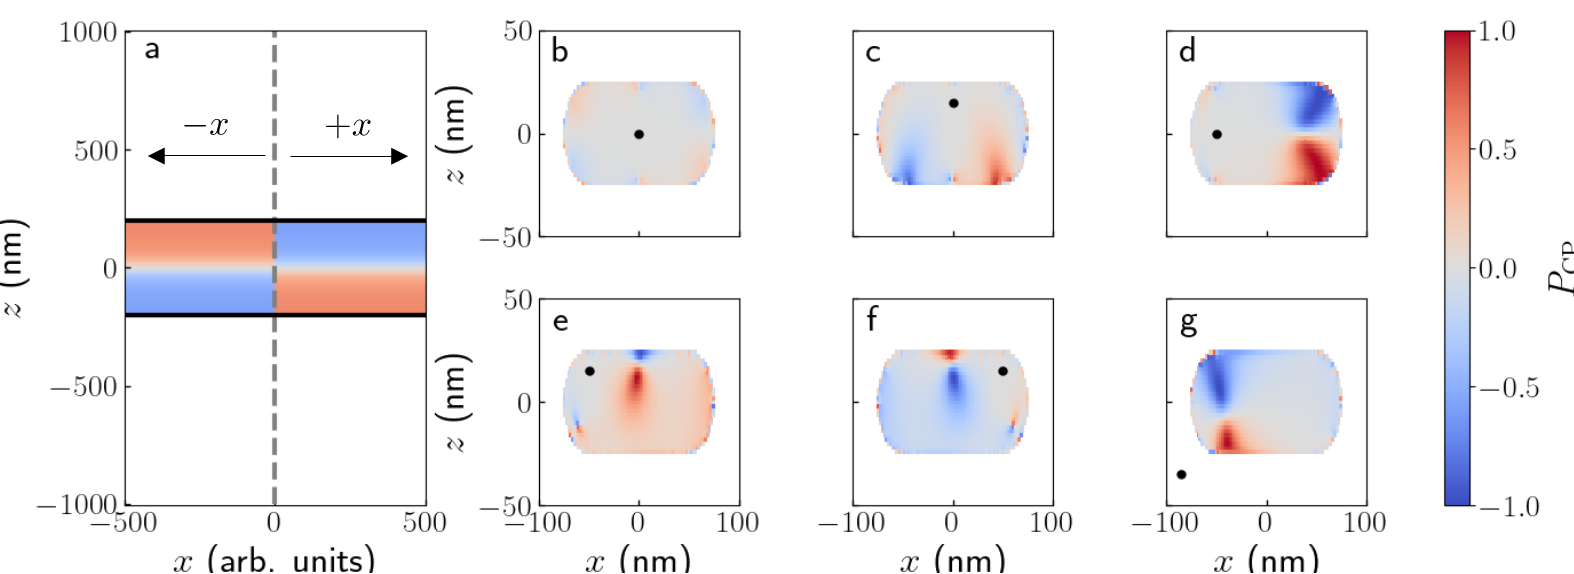
From this definition, we see from comparison to the circular polarization vectors that a propagating mode has left-hand circular polarization component for , and right-hand circular polarization component for due to the fact that is an odd function. The situation is reversed for negative , as shown in Fig. 2(a). Specifically, for the wavelength of 600 nm used here, and a wire diameter equal to that of the GNR (50 nm), we have , and a transverse-to-longitudinal field ratio at the wire surface of 0.29. (This ratio is 1 for perfect circular polarization).
Moving on to simulations of the field created by a dipole source, Fig. 2(b) shows the degree of circular polarization associated with the plasmon mode created by a dipole in the center of the GNR. We note that it is qualitatively the same as that seen for a nanowire, implying that the distribution of polarization within the GNR is due to propagating modes with spin-momentum locking. An objection to this point of view is that a GNR supports localized surface plasmon modes i.e. modes with a standing wave character, and thus the spin-momentum locking concept does not apply. However, the extremely fast decay time of the SPM, which is only slightly more than its round trip time inside the GNR (see Appendix), means that the linearly polarized localized mode is not established within the lifetime of the excitation. Thus the polarization state of the propagating plasmon excitation dominates, and determines the polarization of the local induced dipole moment as seen in Fig. 2(b). Figures 2(c) and (d) show what happens to the distribution of polarization when the dipole is displaced along the or axis respectively. Unsurprisingly, this breaks the symmetry due to the longer traversal length in one direction.
Now, the examples shown in Figs. 2(b-d) all show sign flipped mirror symmetry with respect to at least one plane and thus there is zero degree of circular polarization when averaged over the GNR volume. However, if the dipole is displaced from the center along both the and axes, then a single lobe with well-defined will dominate, as seen in Figs. 2(e) and (f). Here, the broken symmetry of mode propagation leads to the existence of a net DCP of the electric field inside the GNR, and, thus, in the induced dipole moment. Therefore, by Eq. 4, the EM radiation emitted from the GNR also has a degree of circular polarization. In addition, Fig. 2g demonstrates that the effect also holds for a dipole coupled from outside the GNR.
The effect noted here is transient in the sense that if the oscillation continued for more time, or if the GNR was longer and the mode propagated over a longer distance, the mode would eventually settle into an eigenmode with no net spin. However, due to the extremely short SPM lifetime and the short length of the GNR relative to the wavelength, this “transient” field distribution dominates, leading to a net polarization of the SPM over its lifetime. Further tests of this concept are found in the Appendix.
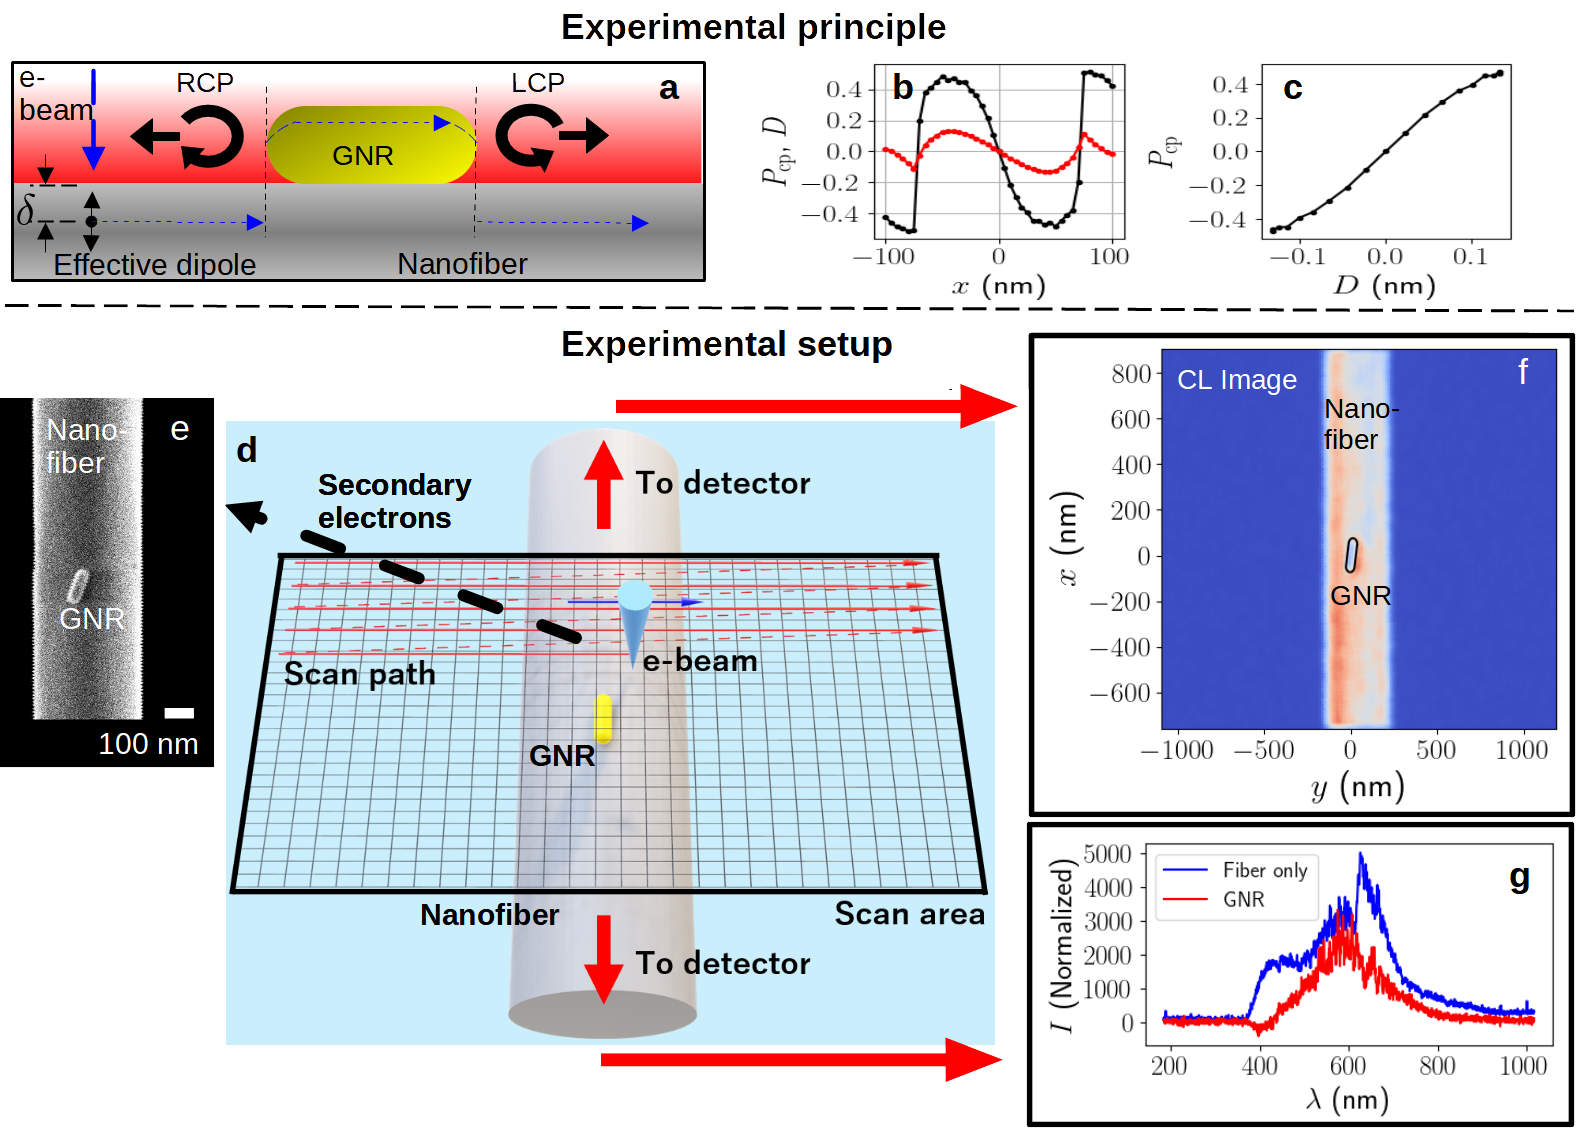
We now move on to our experimental investigation of the effect described above. We use the cathode luminescence (CL) method to excite emission from the GNR using a beam of electrons inside a scanning electron microscope (SEM) which function as point dipole sources when entering or passing near the GNR. It is well known that the CL signal is proportional to the local photonic density of states, which is in turn proportional to the Purcell factor for an emitter coupled to the GNR plasmon 25, 26, 27. As shown in Fig. 3(a), rather than standard collection of emitted light in the far field, we couple it to the evanescent field of an optical nanofiber (ONF) aligned with the GNR axis. Due to the well known spin-momentum locking of the ONF’s evanescent field 15, 14, this results in the optical chirality being converted to a difference in coupled intensity to the positive and negative propagating modes of the fiber.
We define the directionality of the light coupled from the GNR dipole moment to the fiber as , where is the propagating intensity and is the propagating intensity. Now, the intensity of coupling to a given mode is given by 28 . Using to represent the propagating fiber modes, we find, at a given point ,
| (8) |
where we applied Eq. 5 to reach the final form. Equation 8 is equivalent to Eq. 3 for the degree of circular polarization if the spin-momentum locked fiber modes are perfectly circularly polarized. In reality, the modes have elliptical polarizations with a weaker component 29. Nonetheless, the two measures have the same structure as seen in Fig. 3(b), in particular peaking at the same value. In Fig. 3(c) we plot as a function of within the GNR. The monotonicity of the relationship shows that the directionality functions as a proxy for the circular polarization of the emitted light.
Having established the principle of our technique for measuring we move on to the experimental setup. Figure 3(d) shows a schematic representation of our experiment. A tapered optical fiber with a waist diameter of nm is mounted in the sample chamber of a scanning electron microscope (SEM, Carl Zeiss SUPRA50).
A single GNR (Nanopartz A12-50-808, diamete 50 nm, length 150 nm) is deposited on the nanofiber surface with a micro-pipette 30. A fiber feedthrough allows the collected CL to be measured using single photon counting modules (SPCMs) located outside the SEM 31, as shown in Fig. 3(f). Aside from CL measurement by SPCM, it is also possible to take simultaneous measurements of secondary electrons to produce a standard SEM image (Fig. 3(e)) and measurements of the CL spectrum using an optical multi-channel analyzer (Kymera 193i, Newton DU970P-BVF). Fig. 3(g) shows recorded spectra for the fiber alone (black curve) and for the GNR with the fiber background subtracted (red curve). We see that the peak CL wavelength occurs near 600 nm, and thus this wavelength was used in our simulation results, shown so far.
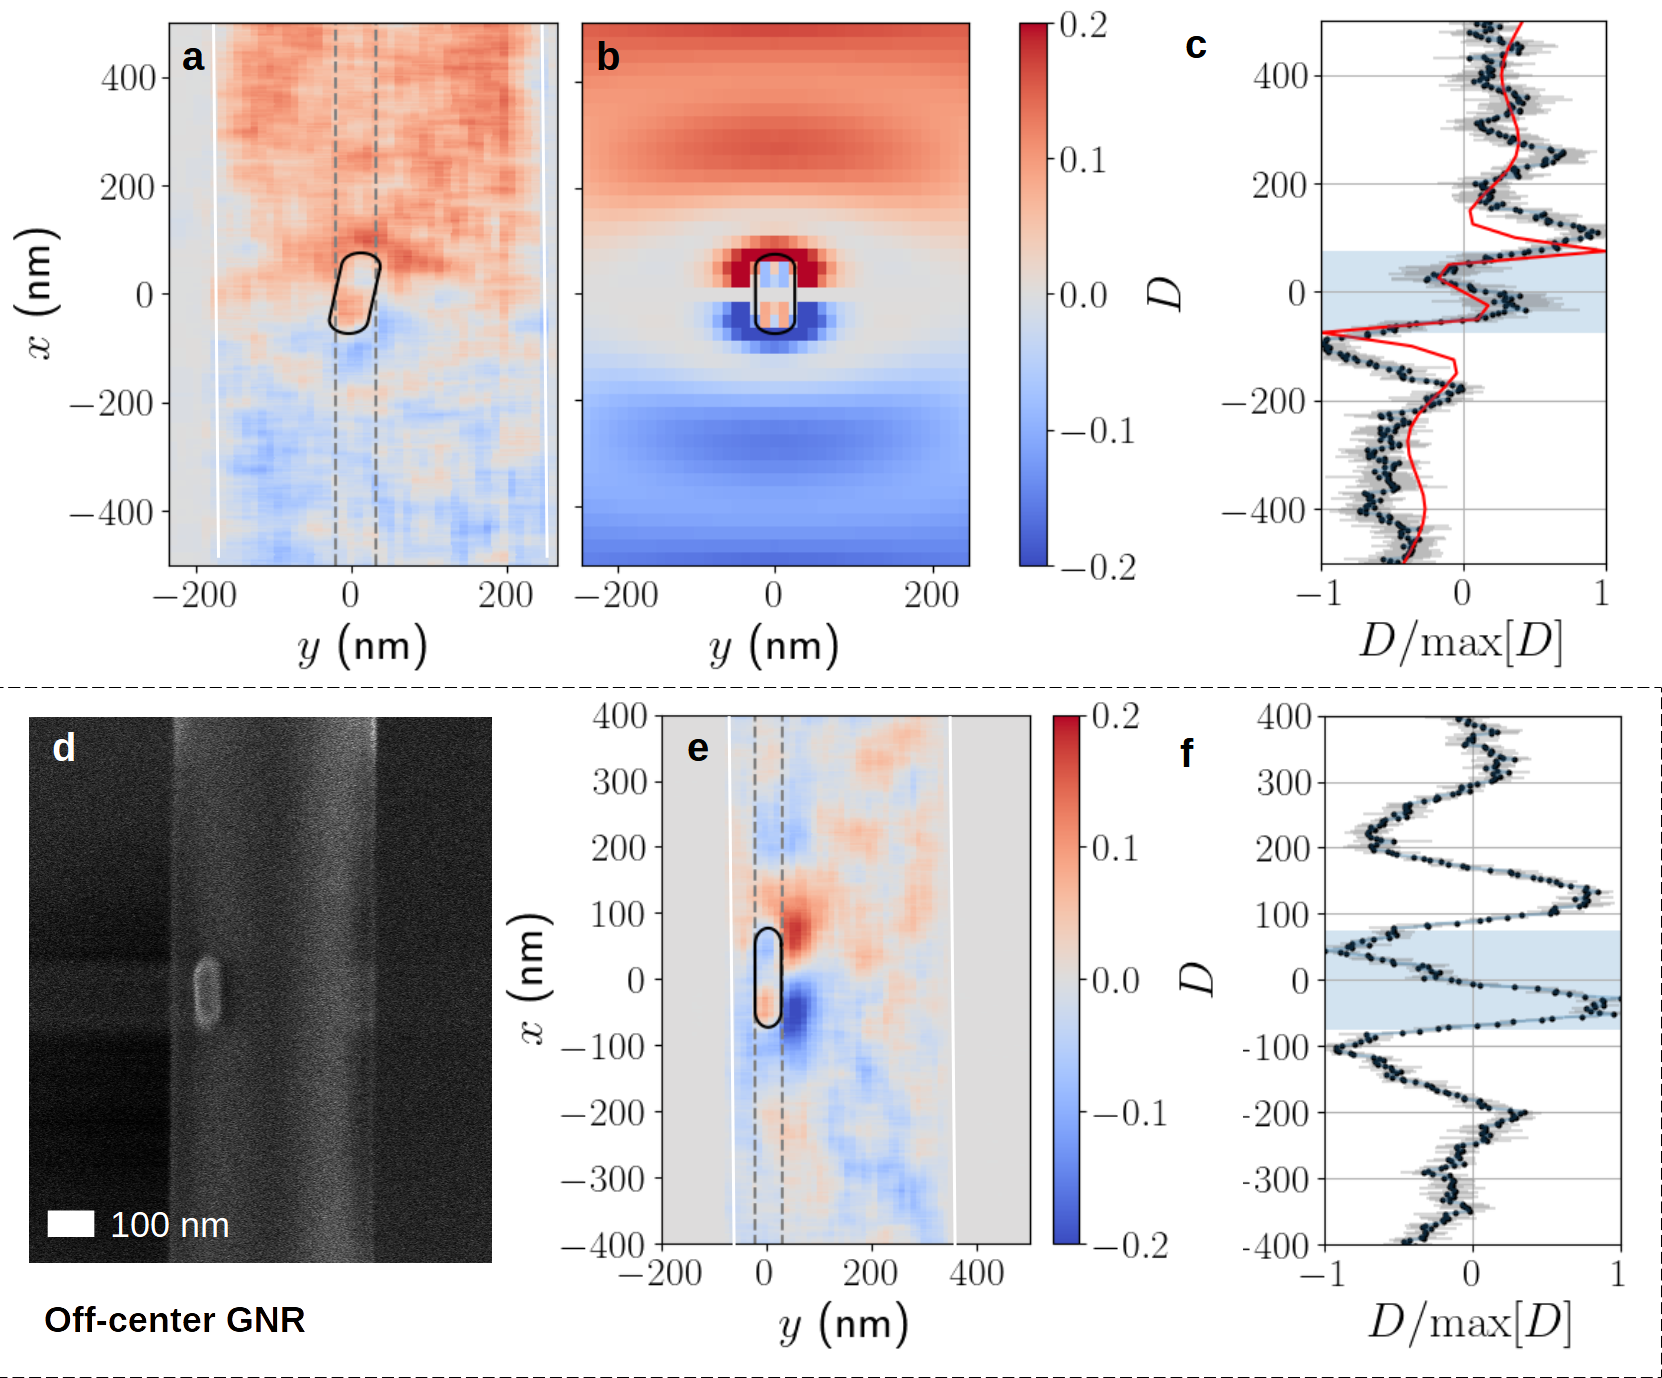
We now turn to the main result of the paper - the demonstration of emission with a circular polarization component from a GNR using spin-momentum locked CL measurements. Figure 4(a) shows the directionality calculated from the CL measurements shown in Fig. 3(d) in a region surrounding the GNR. The associated simulation results are shown in Fig. 4(b).
The experimental result demonstrates a number of features predicted by the detailed numerical simulations. First, there is the directionality inside the GNR which, as predicted, flips from positive to negative as is increased past the origin, owing to a change in the dominant circular polarization from LCP to RCP.
Second, the structure of outside the GNR is also reproduced. Most intriguingly, the reversal of directionality when the GNR boundary is crossed along with oscillations in may be seen. These details are more clearly seen by looking at the behavior of as a function of with , as shown in Fig. 4(c). To make this graph, the experimental data in Fig. 4(a) was averaged over the region indicated by the gray dashed lines, and normalized to its maximum giving the black points shown, while the light gray region shows the standard deviation over the same region. The red curve in Fig. 4(c) shows the normalized simulation results corresponding to . We see good correspondence between the predicted and measured structure in , including the reversal of sign, and position of peaks.
The directionality seen outside the GNR in both simulations and experiments must be interpreted with some care compared to that seen inside the GNR. This is because the source of the dipole excitation outside the GNR is the excitation of non-bridging oxygen hole centers (NBOHCs) in the fiber 31 which couple to the GNR plasmon, but also experience interference due to scattering from the GNR. This leads to the oscillations in seen outside the GNR. We also note that the center wavelength of NBOHCs in silica is about 650 nm, in comparison to the 600 nm center wavelength seen for the GNR CL spectrum. This wavelength difference is taken into account in our simulations.
A natural question is how the relative position of the GNR and fiber affects the results. In Figs. 4(e),(f), we show measurements of for a GNR which is near to the edge of the ONF, as seen in the SEM image in Fig. 4(d). Although the distribution of around the GNR is distorted, the same qualitative behavior seen in Figs. 4(a-c) is reproduced. We note that our experimentally measured values of approach the numerically calculated limit of 0.15 which corresponds to a value of of the emitted light of about 0.4. Although a systematic study is beyond the scope of the present work, we have found numerically that for a longer wavelength, the value of can rise to almost unity. We give an example in the Appendix.
In conclusion, we have numerically investigated the phenomenon of chiral light produced from non-chiral GNRs when a dipole source is coupled to the GNR at a position displaced from its center. The emergence of a net chirality can be understood in terms of the excitation of spin-momentum locked modes in the GNR. We tested this phenomenon experimentally by using an electron beam to produce an effective point dipole excitation in a GNR and collected the induced cathode luminescence evanescently. This allowed the polarization to be converted to directionality of mode propagation, due to the spin-momentum locking of the nanofiber modes.
Although our results might seem at odds with established facts regarding the linear polarization of emitters coupled to anisotropic resonators 3, 4, 5, 6, 7, 8, to the best of our knowledge, no previous studies have had the necessary control over emitter-particle positioning or the right particle geometry to discover the effect reported here. In addition, although electron beam methods have been used to induce directional polarization from isotopic particles 32, this was not mode-resolved or correlated with circular polarized emission, as in the present study.
Generation of circularly polarized photons by coupling an emitter to a non-chiral nanostructure greatly simplifies the generation of chiral light. Furthermore, we note that the realization of directionality of emission is also useful in itself, and has been the focus of many studies in the field of chiral quantum optics in recent years 14. Finally, we note that evanescent collection of CL, used here for the first time, is promising, as it sheds light on new aspects of cathode luminescence through the spin-momentum locking property. In this case, it allowed us to use directionality as a proxy for light chirality, which would have been difficult to measure with standard CL setups, even those equipped with polarization analysis.
Author contributions
†YX and DM contributed equally to this work. YX performed numerical simulations and discovered the circularly polarized emission phenomenon. DM performed the experiment and discovered the flip in directionality inside the GNR. YI contributed to data analysis and the development of the experimental technique. MS supervised the project and contributed to simulations and the overall understanding of the observations. All authors contributed to the writing of the paper.
Notes
The authors declare no competing financial interest.
Appendix A APPENDIX
Appendix A2 Simulation methods
In this section we give details regarding our finite difference time domain (FDTD) simulations. All simulations were performed using a commercial FDTD solver 33.
A2.1 Simulation setup
In all our simulations, the gold nanorod is a hemisphere capped cylinder of total length 150 nm and radius 25 nm. The refractive index is set to the provided preset which uses complex index values taken from the CRC handbook of Chemistry and Physics 34.
The gold nanorod is surrounded by a custom mesh area of volume 1 m3 in which a mesh size of 2 nm is set. Outside this area, the mesh size is left to the software to determine by setting a preset mesh level of 8. The source used for the simulations is a numerical approximation of a -polarized point dipole, with a wavelength centered on 600 nm for excitation within the GNR. The placement is decided by the penetration depth of 2 keV electrons into a gold surface which we take as 10 nm 35.
For simulations which include a nanofiber, the fiber material is set to a silica preset, with a refractive index of approximately 1.45 near 600 nm. The dipole position is decided by the penetration depth of 2 keV electrons into a silica surface which we take as 20 nm 31.
Simulations were typically run until the remaining electromagnetic energy dropped to of the initial energy.
Appendix A3 Supporting simulation results - checks of simulation validity
A3.1 Convergence of results with mesh density
In FDTD simulations, verifying the convergence with respect to mesh density is an essential step to ensure the reliability of numerical results. We systematically refined the mesh density to examine its influence on the calculated transmission and directionality. In each case, the dipole source was placed in the same position in the upper-right corner of the GNR. This configuration excites an RCP component in the dipole moment, which preferentially couples into the direction, as recorded by power monitors placed along the directions.
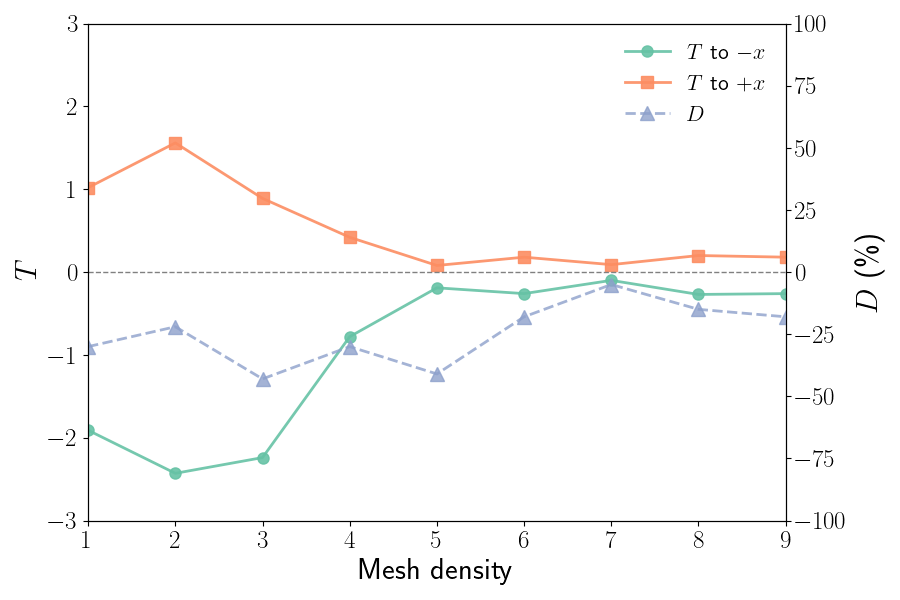
The results are shown in Fig. A1. Here, the horizontal axis (mesh density levels 1–8) corresponds to the default automatic mesh sizes defined in the FDTD software, where level 1 is the coarsest and level 8 the finest. Mesh density level 9 denotes a customized setting, in which the overall mesh was kept at level 8 while an additional refined mesh of was applied locally in a 1 m2 volume centered on the GNR, as used in the simulations presented in the main paper. Although fluctuations in the parameters are not completely eliminated, the transmissions are seen to reduce steadily for mesh sizes between 2 and 5 after which they are distributed over a small range of values. Notably, the sign of the directionality is always negative as expected, but declines with refinement, saturating to a value close to 20 This demonstrates satisfactory convergence and confirms the reliability of our simulation results.
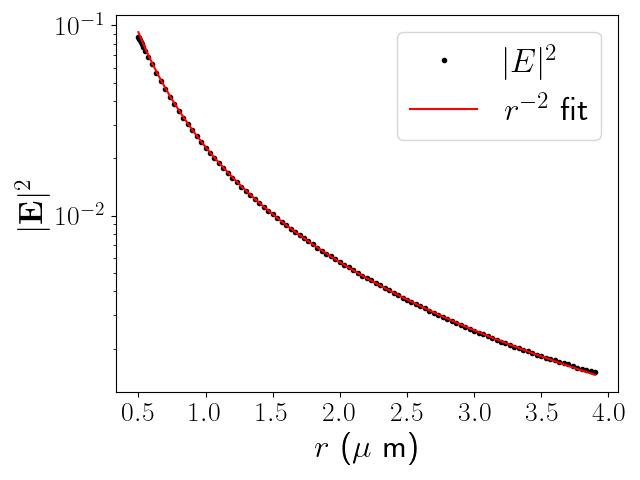
A3.2 Scaling of emitted electric field
In Fig. A2, we present data showing that the numerically predicted fields correspond to radiation by showing that the field intensity follows an inverse square law. In this case, we have plotted the field along the -axis. The results show an excellent fit of the function to the data, where and are constants, and is the distance from the GNR center along the -axis. This demonstrates that the calculated field in this region corresponds to emission as expected.
A3.3 Direct observation of rotating polarization in simulations
Circular polarization may be observed directly in the simulations by recording the fields at each time step, creating a movie. Representative snapshots under different conditions are presented in Fig. A3.
As a reference, we first constructed ideal cases of left- and right-handed circular polarization (LCP and RCP) by simulating two orthogonal point dipole sources with a phase difference. The corresponding results are shown in Figs. A3a (LCP) and c (RCP). When the point dipole source is placed at the upper-left corner of the GNR, light with an LCP component is generated, as seen in Fig. A3b. Similarly, when the dipole source is located at the upper-right corner, an RCP component appears, as shown in Fig. A3d.
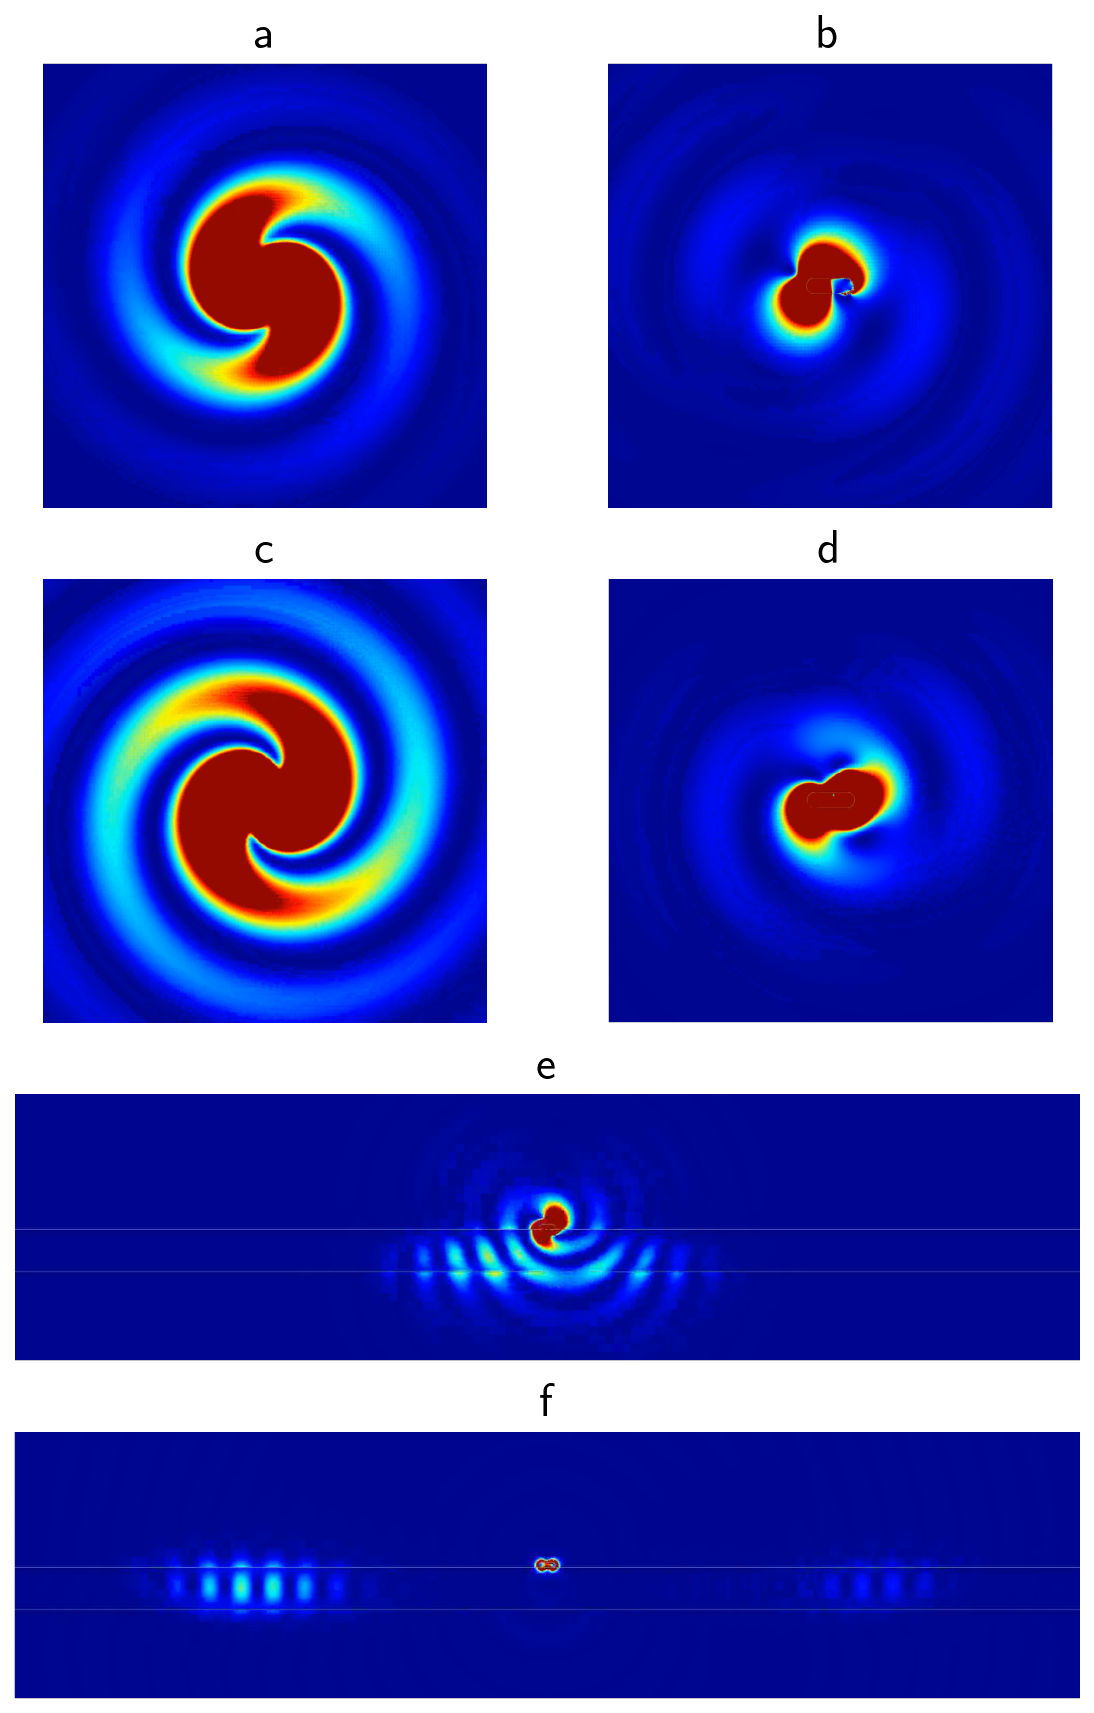
Figs. A3(e) and (f) present the case where the GNR was placed on the surface of an ONF, with the point dipole source positioned at the upper-right corner. According to the mechanism discussed in the main text, light with an RCP component is generated, as shown in Fig. A3(e). Subsequently, due to spin–momentum locking, the excitation couples directionally to the ONF as seen in Fig. A3(f).
Appendix A4 Supporting simulation results - further investigation of the rotating dipole moment effect
In the following subsections, we provide further numerical evidence of the main finding of our paper - the existence of an induced rotating polarization which gives rise to chiral emission and directional coupling to the optical nanofiber.
Let us first qualitatively recap the understanding of this phenomenon presented in the main manuscript. We claim that a linearly polarized dipole emitter couples to a GNR in such a way that a rotating induced dipole moment is created within the GNR. The fundamental source of the rotating polarization is the spin momentum locked nature of the surface plasmon modes which propagate from the position of the dipole. Now, these modes do not carry net spin when averaged over the wire volume. However, as we show in the main paper, if the dipole position is shifted with respect to both the principle axes, the resulting asymmetry in propagating gives rise to a dominant lobe with a certain, non-zero degree of spin, which remains even after volume averaging.
For the average spin induced in this way to be non-trivial after averaging, the following conditions must hold.
-
1.
The plasmon mode decay time must be short enough that the plasmon mode does not have time to settle into a linearly polarized eigenmode of the GNR.
-
2.
The rod must be short enough that the initial “transient” distribution created by the asymmetry of the source placement does not get outweighed by the wire eigenmode which the system will settle into after sufficient propagation length
The following simulations test some aspect of the above conditions, after first establishing basic parameters of the GNR modes.
A4.1 GNR propagating mode properties
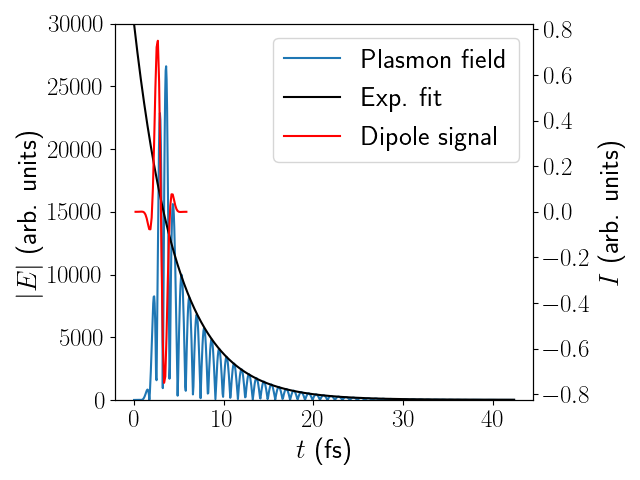
In Table A1, we summarize the properties of the fundamental propagating mode in the GNR, along with properties related to the localized surface plasmon resonance of the GNR. These properties were determined by excitation with an effective function pulse, whose time dependence is shown in Fig. A4
| Parameter | Symbol or expression | Value |
|---|---|---|
| Material | - | Gold |
| GNR length | 150 nm | |
| GNR radius | 50 nm | |
| Mode wavelength | 600 nm | |
| Core dielectric const. @ 600 nm | -8.4398 | |
| Mode effective index | 2.08 | |
| Plasmon lifetime | 4.75 fs | |
| Plasmon decay rate | 210 THz | |
| Mode round trip time | 2.08 fs |
The response of the GNR plasmon mode was calculated as depicted in Fig. A4
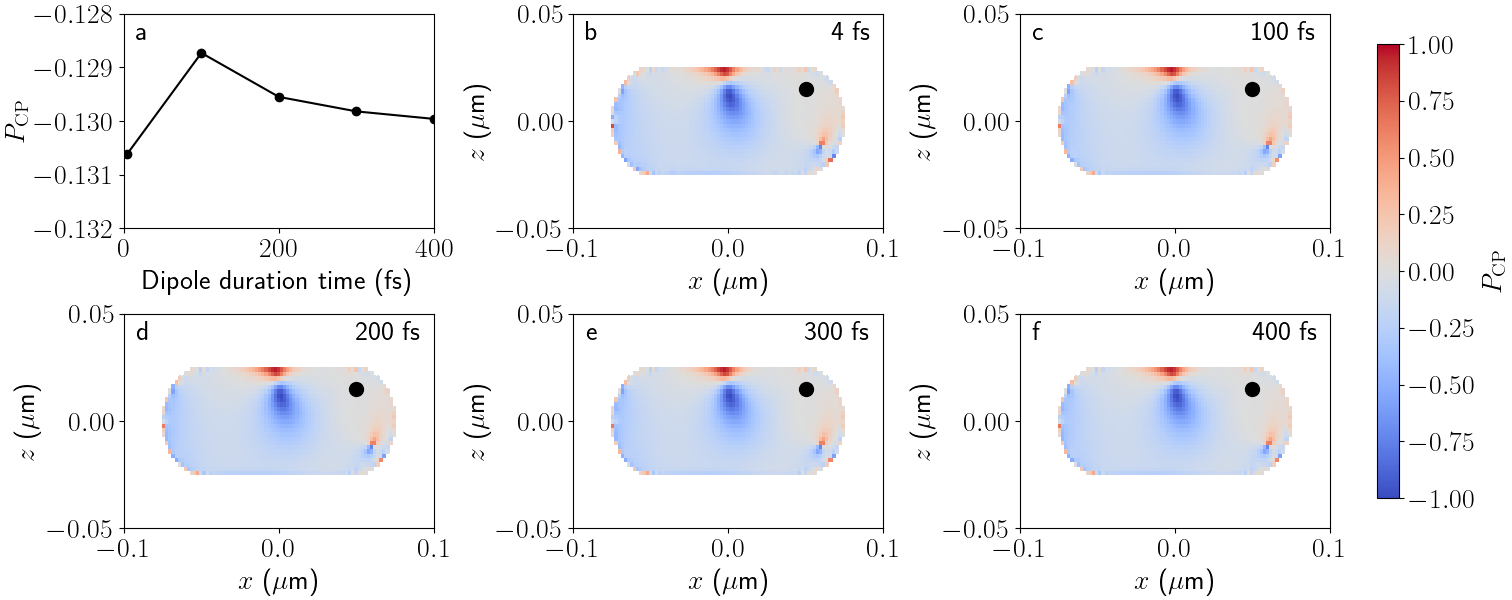
A4.2 Dependence of results on dipole duration
The effective lifetime of the pulses used to excite the system in FDTD simulations is similar to or shorter than the plasmon lifetime of the GNR. In realistic situations, assuming the Purcell regime, the reverse is actually the case. Our interpretation of the phenomenon observed here in terms of propagating modes of the GNR does not explicitly invoke the time-domain behavior of the source, and thus, if it is correct, the results should not depend on the lifetime of the excitation. On the other hand, a priori, it seems possible that the circular polarization effect could be transient, and that for sources with lifetimes longer than that of the plasmonic mode, the circular polarization component could vanish, as the system settles into a linearly polarized eigenmode.
To check this, we varied the duration time of the point dipole source in the FDTD simulations. The default optimized short pulse has a duration of approximately , i.e. of the same order as the plasmon lifetime. In addition, we performed simulations with longer durations of , , , and , i.e. up to approximately two orders of magnitude longer than the plasmon lifetime. The results for a point dipole source positioned at the upper-right corner, are shown in Fig. A5.
As illustrated in Fig. A5a, the over the rod volume is almost unaffected by the dipole duration. Furthermore, Figs. A5b–f show that the spatial distribution of the DCP also remains essentially unchanged for different dipole source durations.
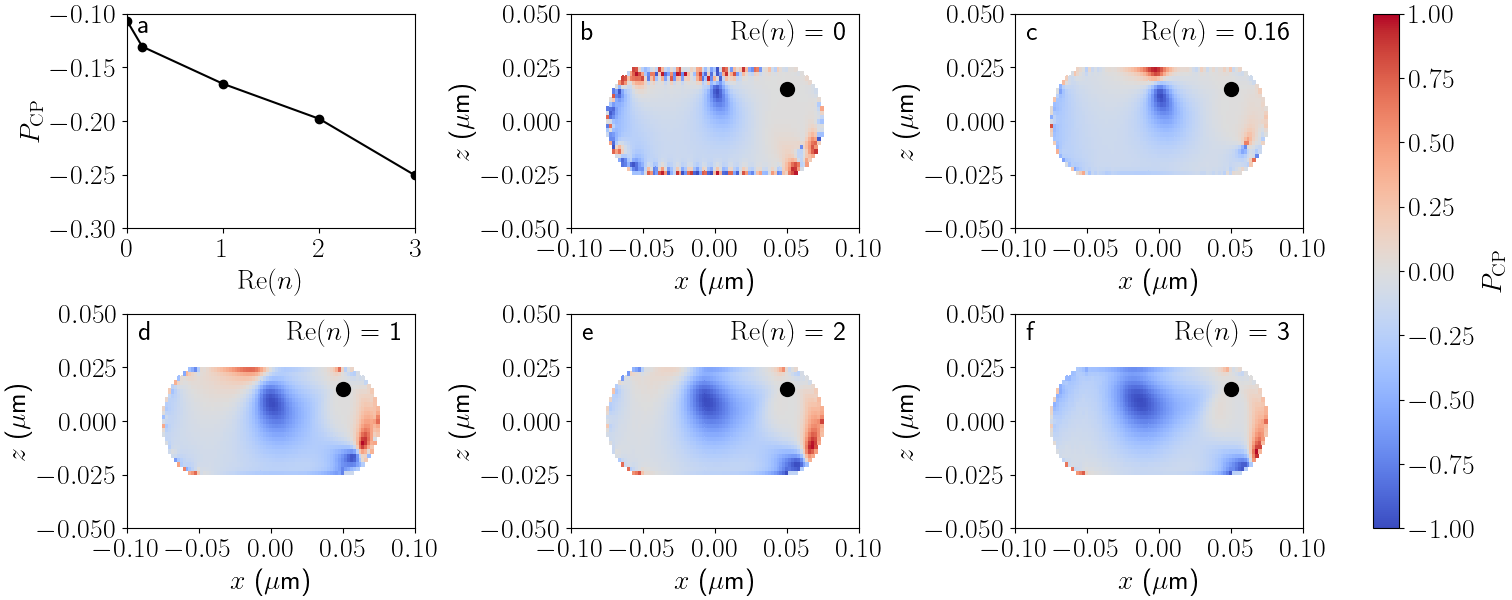
A4.3 Effect of optical loss on DCP of the dipole moment
A key point of our interpretation of the emission of CP light from the emitter-GNR system is that the rapid decay of the plasmon excitation allows the rotating polarization of the spin-orbit coupled propagating nanowire mode to dominate over the linearly polarized eigenmodes of the GNR.
To test this concept, we removed ohmic losses from the nanorod by making its permittivity purely real and negative (i.e. by making its refractive index pure imaginary). In this dielectric model, the complex refractive index of the nanorod is expressed as , where and denote the real and imaginary parts of the refractive index, respectively. The corresponding complex permittivity is given by . As increases, the real part of decreases, leading to the introduction of an imaginary component of the permittivity and thus optical loss 24. Under our interpretation, increasing loss should lead to increasing domination of the circularly polarized component of the dipole moment as the system does not have time to settle into the linearly polarized eigen modes of the system.
In the simulation, a dipole source was placed near the upper-right corner inside the GNR. We systematically varied the real part of the refractive index of the GNR material, while keeping the imaginary part and other optical parameters fixed to the CRC gold values at . The real part of the refractive index was set to , as well as the CRC reference value as illustrated in Fig. A6, to examine the effect of the end reflection on the CP emission. As can be seen, the results are in qualitative agreement with expectations under our interpretation. However, it is important to note that without optical loss, the mode can in principle oscillate indefinitely, whereas our simulations are necessarily for a limited time. Thus, the results for are an overestimate of the DCP which in principle should tend to zero as the simulation time increases.
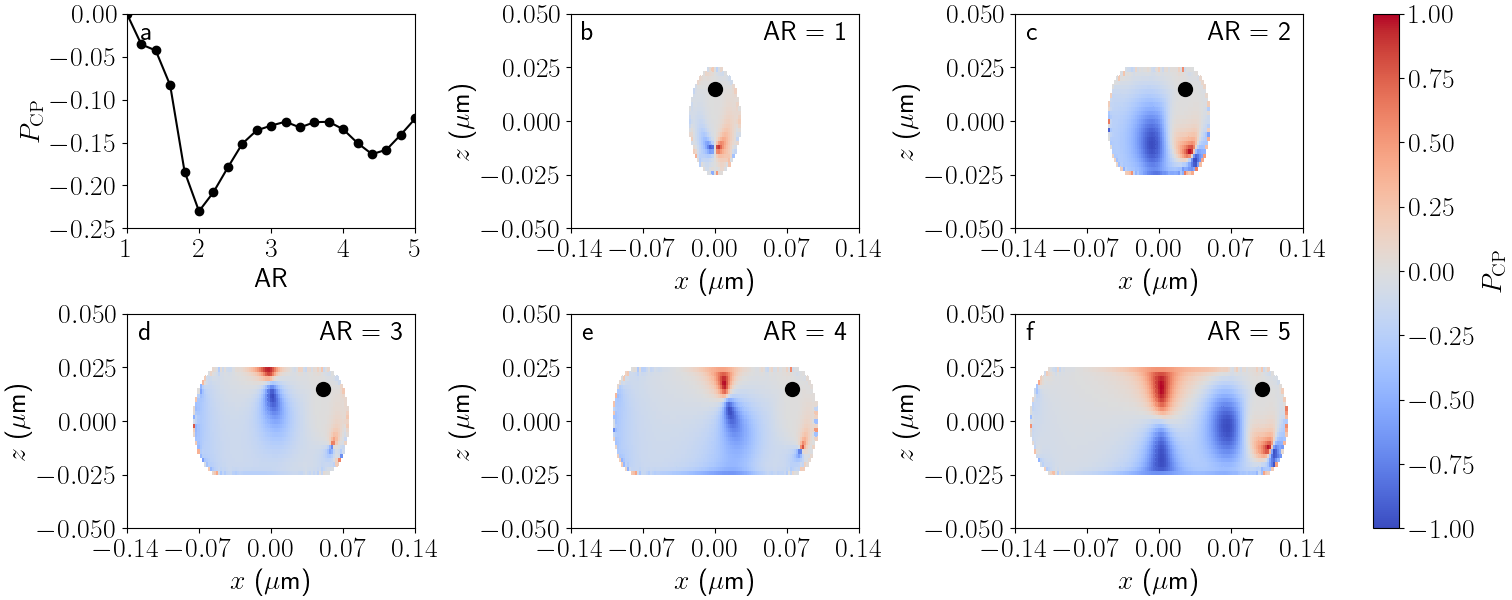
A4.4 Effect of GNR aspect ratio on DCP of GNR dipole moment
We also investigated the of the GNR dipole moment at 600 nm as a function of the GNR aspect ratio (AR), as shown in Fig. A7. The case of corresponds to a sphere, resulting in a of zero. The reaches approximately 23% at . Increasing the AR beyond this value does not lead to a further enhancement of DCP, ostensibly due to the fact that the mode settles into a wire mode which has no net DCP.
Appendix A5 Maximizing the DCP of emitted light
A natural question regarding the results we report here is how large a degree of circular polarization can be achieved? A systematic exploration of this question over all experimental parameters is beyond the scope of the present paper. Instead we provide evidence below that can become close to unity for experimentally achievable parameters.
In particular, as shown in Fig. A8, using the same GNR dimensions as in the main paper, but lengthening the emission wavelength from 600 nm to 750 nm is enough to produce a DCP for the emitted light of (Fig. A8(a),(b)). Interestingly, the directionality achieved for this near maximal DCP only approaches 50 as seen in Figs. A8(c),(d). The exact reason why a near perfect circular polarization does not correspond to a near perfect directionality is not yet completely clear, but is likely due to the modification of the fiber’s evanescent field polarization due to the presence of the GNR.
Appendix A6 Experimental methods
Here we give more details of the experimental setup, methods and analysis as introduced in the main text
A6.1 Experimental setup
Our experiments take place inside a scanning electron microscope (SEM, Carl-Zeiss SUPRA 40) with a homemade fiber feedthrough 36. An optical nanofiber fiber manufactured by a standard heat-and-pull method 37 is mounted inside the SEM and spliced to the fiber feedthrough.
By further splicing the output fiber on the air-side to a 600 nm single mode fiber (SMF) and using 600 nm long pass filters (LPF) before detection of the signal at the SPCMs, as shown in Fig. 3(d) of the main text, we ensured that the detected CL was that coupled to the fundamental mode of the fiber. For this mode, the evanescent field extends approximately one wavelength into the surrounding vacuum, and has an elliptical polarization in the plane dependent on the propagation direction, as shown by the thick black arrows in Fig. 3(a) of the main text. This spin-momentum locking in the evanescent field allows the conversion of polarization of CL emitted by the GNR to directionality of light in the fiber, as LCP (RCP) emission couples more strongly to the () propagating mode.
A6.1.1 Details of the electron beam scan
Fig. 3(a) of the main text depicts the GNR on the fiber surface, along with the path of the electron beam, and the polarization state of the evanescent field of the fiber mode for propagation. Note that the electron beam penetrates a distance into the fiber which is taken to be nm for the GNR, and nm for the silica fiber 31.
The electron beam scan was performed at a rate of approximately 30 lines per minute, typically at a magnification between 25 and 50 times depending on the purpose of the scan. The diameter of the electron beam is approximately 5 nm, although the effective resolution of the scan is principally decided by the scan rate and SPCM output sample rate.
A6.1.2 CL data analysis
Raw CL data was recorded as a time sequence of photon counts by SPCM1 and SPCM2. This was then reconstructed to give a CL image by aligning the data from each line scan. The characteristic rise due to the fiber edge was used to align the data when necessary.
We calculate the directionality by calculating the ratio
for each point in the CL image, where and are the SPCM1 and SPCM2 photon counts respectively.
We note that which SPCM should be considered 1 and which should be considered 2 may not be clear, or can easily be mixed up by accidentally swapping the input fibers. Luckily, it is always possible to decide which is 1 and which is 2 post-measurement, since the SPCM1 end of the GNR gives larger intensities on average at SPCM1 rather than SPCM2 and vice versa. This allows the correct sign of to be determined at analysis time for comparison with simulations.
An additional complication in calculating is that although the relative changes in intensity at each SPCM are determined by the directionality of coupling, the average value of the intensity at each SPCM, which ideally should be the same, can depend on the details of individual fiber tapers, including the shape of the taper itself on each side of the nanofiber region, and any impurities introduced asymmetrically on the fiber during the GNR deposition process. It is thus necessary in general to scale the signals and so that their average values are the same. In addition, for comparison with simulations, it is necessary to set the experimental directionality for excitement at the GNR center to its ideal value of zero. For some data sets, this condition is already true to a good approximation, but for data sets where the mean values of and differ, an offset can exist at the center position. We subtract any such offset before comparison of the 1D data (i.e. on a line through the GNR center) with simulations, so that the qualitative shape of the directionality can be compared between experiments and simulations.
References
- Purcell 1946 Purcell, E. M. Proceedings of the American Physical Society. Phys. Rev. 1946, 69, 681(B10)
- Aharonovich et al. 2016 Aharonovich, I.; Englund, D.; Toth, M. Solid-state single-photon emitters. Nature photonics 2016, 10, 631–641
- Unitt et al. 2005 Unitt, D.; Bennett, A.; Atkinson, P.; Ritchie, D.; Shields, A. Polarization control of quantum dot single-photon sources via a dipole-dependent Purcell effect. Physical Review B—Condensed Matter and Materials Physics 2005, 72, 033318
- Munsch et al. 2012 Munsch, M.; Claudon, J.; Bleuse, J.; Malik, N. S.; Dupuy, E.; Gérard, J.-M.; Chen, Y.; Gregersen, N.; Mørk, J. Linearly polarized, single-mode spontaneous emission in a photonic nanowire. Physical Review Letters 2012, 108, 077405
- Zhu et al. 2014 Zhu, Q.; Zheng, S.; Lin, S.; Liu, T.-R.; Jin, C. Polarization-dependent enhanced photoluminescence and polarization-independent emission rate of quantum dots on gold elliptical nanodisc arrays. Nanoscale 2014, 6, 7237–7242
- Pfeiffer et al. 2018 Pfeiffer, M.; Atkinson, P.; Rastelli, A.; Schmidt, O. G.; Giessen, H.; Lippitz, M.; Lindfors, K. Coupling a single solid-state quantum emitter to an array of resonant plasmonic antennas. Scientific reports 2018, 8, 3415
- Chandra et al. 2020 Chandra, S.; Ahmed, H.; McCormack, S. Polarization-sensitive anisotropic plasmonic properties of quantum dots and Au nanorod composites. Optics Express 2020, 28, 20191–20204
- Zhang et al. 2019 Zhang, H.; Li, M.; Wang, K.; Tian, Y.; Chen, J.-S.; Fountaine, K. T.; DiMarzio, D.; Liu, M.; Cotlet, M.; Gang, O. Polarized single-particle quantum dot emitters through programmable cluster assembly. ACS nano 2019, 14, 1369–1378
- Sugawara et al. 2022 Sugawara, M.; Xuan, Y.; Mitsumori, Y.; Edamatsu, K.; Sadgrove, M. Plasmon-enhanced single photon source directly coupled to an optical fiber. Physical Review Research 2022, 4, 043146
- Shafi et al. 2023 Shafi, K. M.; Yalla, R.; Nayak, K. P. Bright and polarized fiber in-line single-photon source based on plasmon-enhanced emission into nanofiber guided modes. Physical Review Applied 2023, 19, 034008
- Chen et al. 2025 Chen, Y.; Wang, M.; Si, J.; Zhang, Z.; Yin, X.; Chen, J.; Lv, N.; Tang, C.; Zheng, W.; Kivshar, Y., et al. Observation of chiral emission enabled by collective guided resonances. Nature Nanotechnology 2025, 1–8
- Ahn et al. 2024 Ahn, H.-Y.; Le, K. Q.; Narushima, T.; Yamanishi, J.; Kim, R. M.; Nam, K. T.; Okamoto, H. Highly chiral light emission using plasmonic helicoid nanoparticles. Advanced Optical Materials 2024, 12, 2400699
- Xie et al. 2025 Xie, Y.; Krasavin, A. V.; Roth, D. J.; Zayats, A. V. Unidirectional chiral scattering from single enantiomeric plasmonic nanoparticles. Nature Communications 2025, 16, 1125
- Lodahl et al. 2017 Lodahl, P.; Mahmoodian, S.; Stobbe, S.; Rauschenbeutel, A.; Schneeweiss, P.; Volz, J.; Pichler, H.; Zoller, P. Chiral quantum optics. Nature 2017, 541, 473–480
- Petersen et al. 2014 Petersen, J.; Volz, J.; Rauschenbeutel, A. Chiral nanophotonic waveguide interface based on spin-orbit interaction of light. Science 2014, 346, 67–71
- Le Feber et al. 2015 Le Feber, B.; Rotenberg, N.; Kuipers, L. Nanophotonic control of circular dipole emission. Nature communications 2015, 6, 6695
- Schäferling et al. 2012 Schäferling, M.; Yin, X.; Giessen, H. Formation of chiral fields in a symmetric environment. Optics Express 2012, 20, 26326–26336
- Hashiyada et al. 2018 Hashiyada, S.; Narushima, T.; Okamoto, H. Imaging chirality of optical fields near achiral metal nanostructures excited with linearly polarized light. ACS Photonics 2018, 5, 1486–1492
- Hashiyada et al. 2019 Hashiyada, S.; Narushima, T.; Okamoto, H. Active control of chiral optical near fields on a single metal nanorod. ACS Photonics 2019, 6, 677–683
- Chang et al. 2007 Chang, D. E.; Sørensen, A. S.; Hemmer, P.; Lukin, M. Strong coupling of single emitters to surface plasmons. Physical Review B—Condensed Matter and Materials Physics 2007, 76, 035420
- Alpeggiani et al. 2018 Alpeggiani, F.; Bliokh, K.; Nori, F.; Kuipers, L. Electromagnetic helicity in complex media. Physical review letters 2018, 120, 243605
- Yang et al. 2023 Yang, X.; Mou, Y.; Zapata, R.; Reynier, B.; Gallas, B.; Mivelle, M. An inverse Faraday effect generated by linearly polarized light through a plasmonic nano-antenna. Nanophotonics 2023, 12, 687–694
- Griffiths 2023 Griffiths, D. J. Introduction to electrodynamics; Cambridge University Press, 2023
- Takahara et al. 1997 Takahara, J.; Yamagishi, S.; Taki, H.; Morimoto, A.; Kobayashi, T. Guiding of a one-dimensional optical beam with nanometer diameter. Optics letters 1997, 22, 475–477
- García de Abajo 2010 García de Abajo, F. J. Optical excitations in electron microscopy. Reviews of modern physics 2010, 82, 209–275
- Polman et al. 2019 Polman, A.; Kociak, M.; García de Abajo, F. J. Electron-beam spectroscopy for nanophotonics. Nature materials 2019, 18, 1158–1171
- Garcia de Abajo and Di Giulio 2021 Garcia de Abajo, F. J.; Di Giulio, V. Optical excitations with electron beams: challenges and opportunities. ACS photonics 2021, 8, 945–974
- Novotny and Hecht 2012 Novotny, L.; Hecht, B. Principles of nano-optics; Cambridge university press, 2012
- Le Kien et al. 2004 Le Kien, F.; Liang, J.; Hakuta, K.; Balykin, V. Field intensity distributions and polarization orientations in a vacuum-clad subwavelength-diameter optical fiber. Optics Communications 2004, 242, 445–455
- Sugawara et al. 2020 Sugawara, M.; Mitsumori, Y.; Edamatsu, K.; Sadgrove, M. Optical detection of nano-particle characteristics using coupling to a nano-waveguide. Optics Express 2020, 28, 18938–18945
- Uemura et al. 2021 Uemura, Y.; Irita, M.; Homma, Y.; Sadgrove, M. Probing the local density of states near the diffraction limit using nanowaveguide-collected cathode luminescence. Physical Review A 2021, 104, L031504
- Coenen et al. 2014 Coenen, T.; Bernal Arango, F.; Femius Koenderink, A.; Polman, A. Directional emission from a single plasmonic scatterer. Nature communications 2014, 5, 3250
- 33 Ansys Lumerical FDTD
- Haynes 2016 Haynes, W. M. CRC handbook of chemistry and physics; CRC press, 2016
- Zarraoa et al. 2019 Zarraoa, L.; González, M. U.; Paulo, Á. S. Imaging low-dimensional nanostructures by very low voltage scanning electron microscopy: ultra-shallow topography and depth-tunable material contrast. Scientific Reports 2019, 9, 16263
- Abraham and Cornell 1998 Abraham, E. R.; Cornell, E. A. Teflon feedthrough for coupling optical fibers into ultrahigh vacuum systems. Applied optics 1998, 37, 1762–1763
- Birks and Li 2002 Birks, T. A.; Li, Y. W. The shape of fiber tapers. Journal of lightwave technology 2002, 10, 432–438